Yellow
Green
Blue
Red
Magenta
Remove

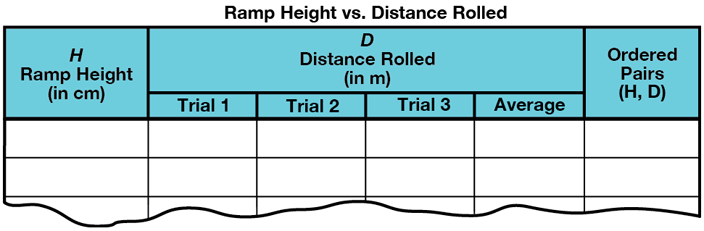
- Work with your group to collect data for the experiment you designed.
- Discuss what values you will use for the height (H).
- Measure the height in centimeters.
- Measure the distance (D) the car rolls to the nearest hundredth of a meter. Use decimals to record your measurements of this distance.
- Do three trials for each height. Average the three distances for each height by finding the median distance.
- Keep track of your data on the Downhill Racer Data Table from the Student Activity Book. Use the Ramp Height and the Average Distance Rolled for the ordered pairs.
- Why is it a good idea to find the average distance?

- Plot your data points on Centimeter Graph Paper. Put the manipulated variable on the horizontal axis and the responding variable on the vertical axis. Before you scale your axes, discuss with your group how much room you need on your graph for extrapolation. (Hint: Look at Questions 11–14.)
- Look at your points on the graph. Do the points lie close to a straight line? If so, use a ruler to draw a best-fit line. Extend the line in both directions.