


Yellow
Green
Blue
Red
Magenta
Remove
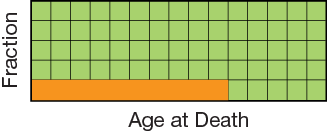
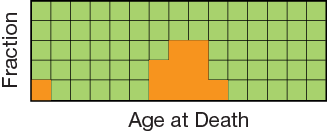
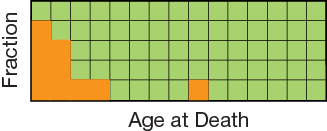
- Following are three graphs that show the age at which these animals are most likely to die. Find the graph that matches the description for each animal: humans, American robins, and oysters.
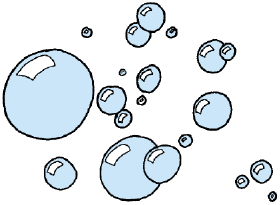
Experimenting with Soap Bubbles
You will collect data on the life spans or “age at death” of soap bubbles to simulate the life spans of population of animals. You will then compare the patterns in this data to the life span data patterns graphs in Question 1.

- Try out your bubble solution. Observe the bubbles. Catch some with your wand and observe them until they pop. What variables are involved in the experiment? What variables do you think affect the life span of a soap bubble?
- Develop a plan for collecting reliable data on the life spans of soap bubbles. Consider the following:
- When does a bubble's “life” begin and end? When will you start and stop the timer?
- What variables should be held fixed?
- Sometimes, many bubbles are made at once. Which bubbles will be part of your sample?
- How many bubbles will you time? How many bubbles will be in your sample?
- What will each member of your group do to help collect the data?