


Bar Graph or Point Graph
Arti and Jessie decided to graph their data to see if there were any patterns that could help them find the number of drops of water the paper towel can absorb.
“I think we should make a bar graph,” said Arti.
“I think we should make a point graph,” said Jessie. “Which kind of graph is best?”
“Let's do both kinds of graphs and find out,” said Arti.


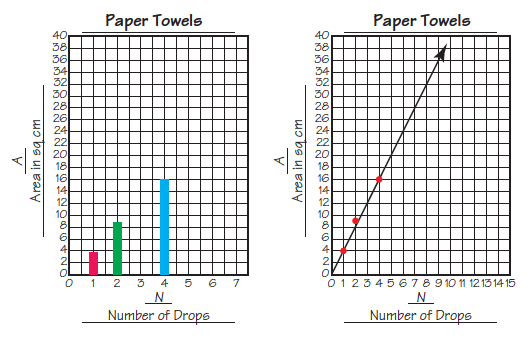
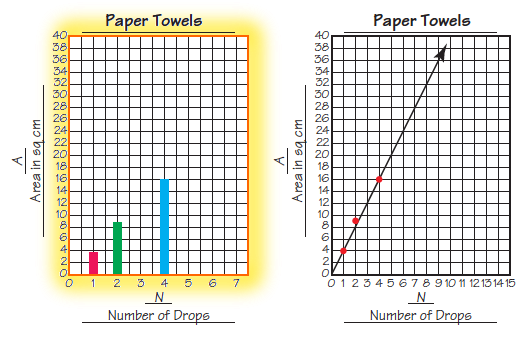
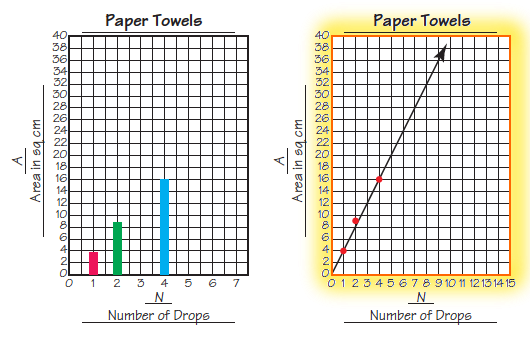
Arti made a bar graph and Jessie made a point graph as shown.
“You were right, Jessie,” said Arti. “The point graph is better. We can find the area for any number of drops by using the line. See, I can find the area of a spot with 6 drops like this.”
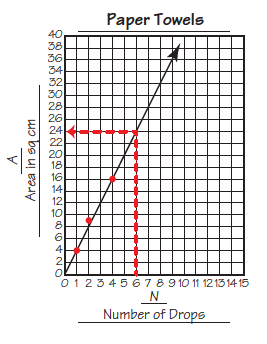
“There are times when it is good to make a bar graph and times when it is good to make a point graph,” said Mr. Moreno. “We make a point graph when both variables are numerical and when it makes sense to think about values between the data points. For example, it makes sense to think about the area of a spot made with 3 drops of water. This information lies between the data for 2 drops and 4 drops. By fitting a line to the points, we can find the area of a spot made with 3 drops. We can also find the area of a spot made with 6 drops.”