Yellow
Green
Blue
Red
Magenta
Remove

You will need a sheet of Centimeter Grid Paper and a ruler to complete this homework.
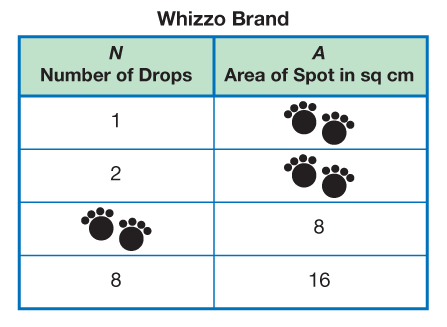
- Professor Peabody tested Whizzo brand paper towels. He noticed a very interesting pattern in his data. Then his pet mouse, Milo, tracked ink across his data table. Look for a pattern in Professor Peabody's data.
- Copy the data table on your paper and fill in the missing values.
- Make a point graph of the data. Graph the number of drops on the horizontal axis and the area on the vertical axis. Use a ruler to fit a line to the points.
- What would be the area of a spot made with no drops? Add this point to your graph.
- Choose a point on the graph and use it to write the ratio (
 ) of the area to the number of drops.
 - Using fractions, write two ratios equal to the ratio in Question 2A.
- What area would 6 drops make on a Whizzo brand paper towel? Show your work.
- How many drops are needed to make a spot with an area of 28 sq cm? Show your work.