Review the Number Line.
Direct students’ attention to the display of the number line.
-
How do we represent skip counting by 10s on the
number line? (Possible response: The 10s have longer marks on the number line.)
-
How do we represent skip counting by 5s on the number line? (Possible response: The 5s have
longer marks, also, but shorter than the marks for the 10s.)
-
Why do you think the 5s and 10s are marked differently? Why not the 4s and 8s? (Responses will
vary. Possible response: It’s easy to skip count by 5s and 10s but not by 4s and 8s.)
The purpose of this part of the lesson is to give students
the opportunity to reflect about what is different
about the 5s and 10s in our number system. Have
students use the number line to demonstrate skip
counting by 5s and 10s.
If you have a number line that does not have the 5s and 10s
benchmarked, you may want to place self-adhesive notes of
one color just above each of the 10s (i.e., 10, 20, 30, 40) and
place self-adhesive notes of another color just below each of
the 5s (i.e., 5, 10, 15, 20).
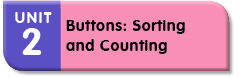
Practice Estimating, Grouping, and Counting a
Handful of Buttons. Use the display of the
Estimate, Group, and Count page in the Student
Activity Book to demonstrate the activity. Grab a
handful of buttons and display the buttons just long
enough for students to make an estimate of the number
in the handful. Refer students to the benchmark
referent bags of buttons on the number line. See
Materials Preparation.
- Look at the handful of buttons I grabbed from the
plastic bag. Use the benchmark bags of 20, 50, and
80 buttons to make an estimate of the number of
buttons in my handful.
- Does my handful look like I have more or less than 20? 50? 80?
- Does it look like a lot more or just a little more than 20? 50? 80?
- What is an estimate or a “good guess” for the total in my handful?
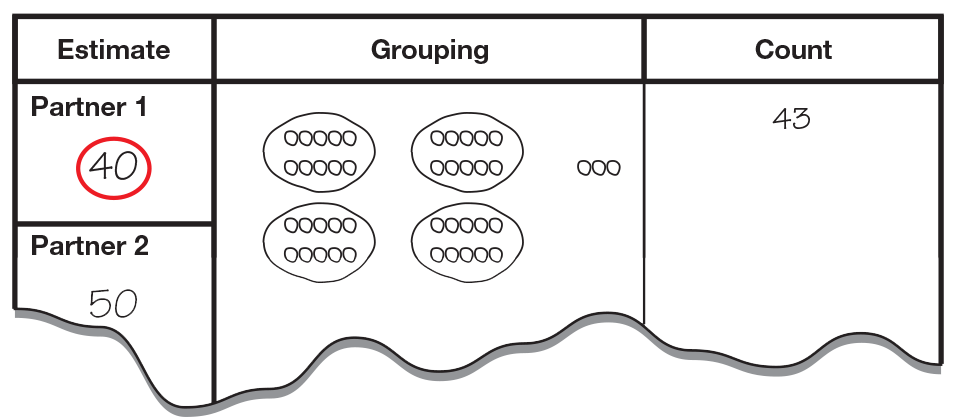
Ask a student volunteer to write his or her estimate
on the display for Partner 1. Write your estimate on
the display for Partner 2 as shown in Figure 1. Have
a student point on the class number line for each
estimate.
Ask students how they would group the buttons so
that counting them will be easier. Emphasize the fact
that you can count the buttons one by one but there
are more efficient methods. Discuss skip counting as
students suggest groupings and help students to see
that although it is possible to have groupings such as
fours or sixes, they should select groupings that are
easier to skip count, such as twos, fives, and tens.
Ask a student volunteer to group the buttons and
skip count to find the total. Demonstrate how to
draw a picture of the groupings on the display and
emphasize that the leftover buttons do not have a circle
around them. Use skip counting to count the
groupings and count the leftovers by ones. Write the
total number of buttons on the display and have a
student find the number on the number line.
- Are our estimates close to the actual number of buttons?
- Which estimate is closer? (40)
- Is the actual number of buttons between 41 and 50 or between 51 and 60? (41 and 50)
Have a student point out the numbers 41 and 50 on
the number line and demonstrate that 43 falls
between these two numbers. Tell students that in
mathematics, this is called an interval.
- How can we decide which estimate is closer?
(Possible response: Look to see which interval
the actual number falls between. If both estimates
are close to the actual count, count up or count
back to see which is closer.)
- If the actual number of buttons had been 49
instead of 43, which estimate would be closer? (50)
- How would you figure that out? (Possible
response: If you count up from 40, 49 is 9 away and if you count back from 50, it’s only 1 away.)
Pass out a bag of buttons to each student pair. See
Materials Preparation. Have student pairs indicate
who is Partner 1 and who is Partner 2 on the
Estimate, Group, and Count page and decide who
will grab the first handful of buttons from the bag.
After students draw a picture of their groupings and
write the total number of buttons for that trial, have
them determine which partner’s estimate was closer
to the actual number of buttons in the handful. Have
pairs repeat the activity with the other student grabbing
the handful. Suggest that they group the buttons
differently each time they count the handful.
Students can practice up to six times by putting
together their pages from the Student Activity Book.
As students work on the activity, walk around and
ask student pairs to explain how they skip counted to
find the actual number of buttons and how they
determined which estimate was closer. Identify a few
students who will share their estimating, grouping,
and counting strategies with the rest of the class.
Share Strategies for Estimating, Grouping, and Counting. Ask a few student pairs to describe their
procedures for estimating, grouping, and counting to the class.
Guide the discussion by asking:
- What strategies did you use to make a good estimate?
(Possible responses: I compared the handful
to the benchmark bags. When we counted the
first handful, it was 36, so I made an estimate
that was close to that number. For the second
handful, I thought that it was more than the first
handful, so I made an estimate that was larger.)
- How did you group your buttons? (Possible
response: We grouped them by tens because it
was easier to count them than if we grouped
them by sevens.)
- Did anyone grab more than 50 buttons? More than 80 buttons?
- Did anyone grab between 31 and 40 buttons?
- Did anyone grab between 21 and 30 buttons?
Ask a student volunteer to show these numbers and
all the numbers in between on the number line.
- How did you decide whose estimate was closer to
the actual count? (Possible response: We looked
at which interval the actual number was in and
then we counted up.)
- Why didn’t you grab the same number of buttons
each time? (Possible response: The buttons are
different sizes; each time you grab, you might do it differently.)
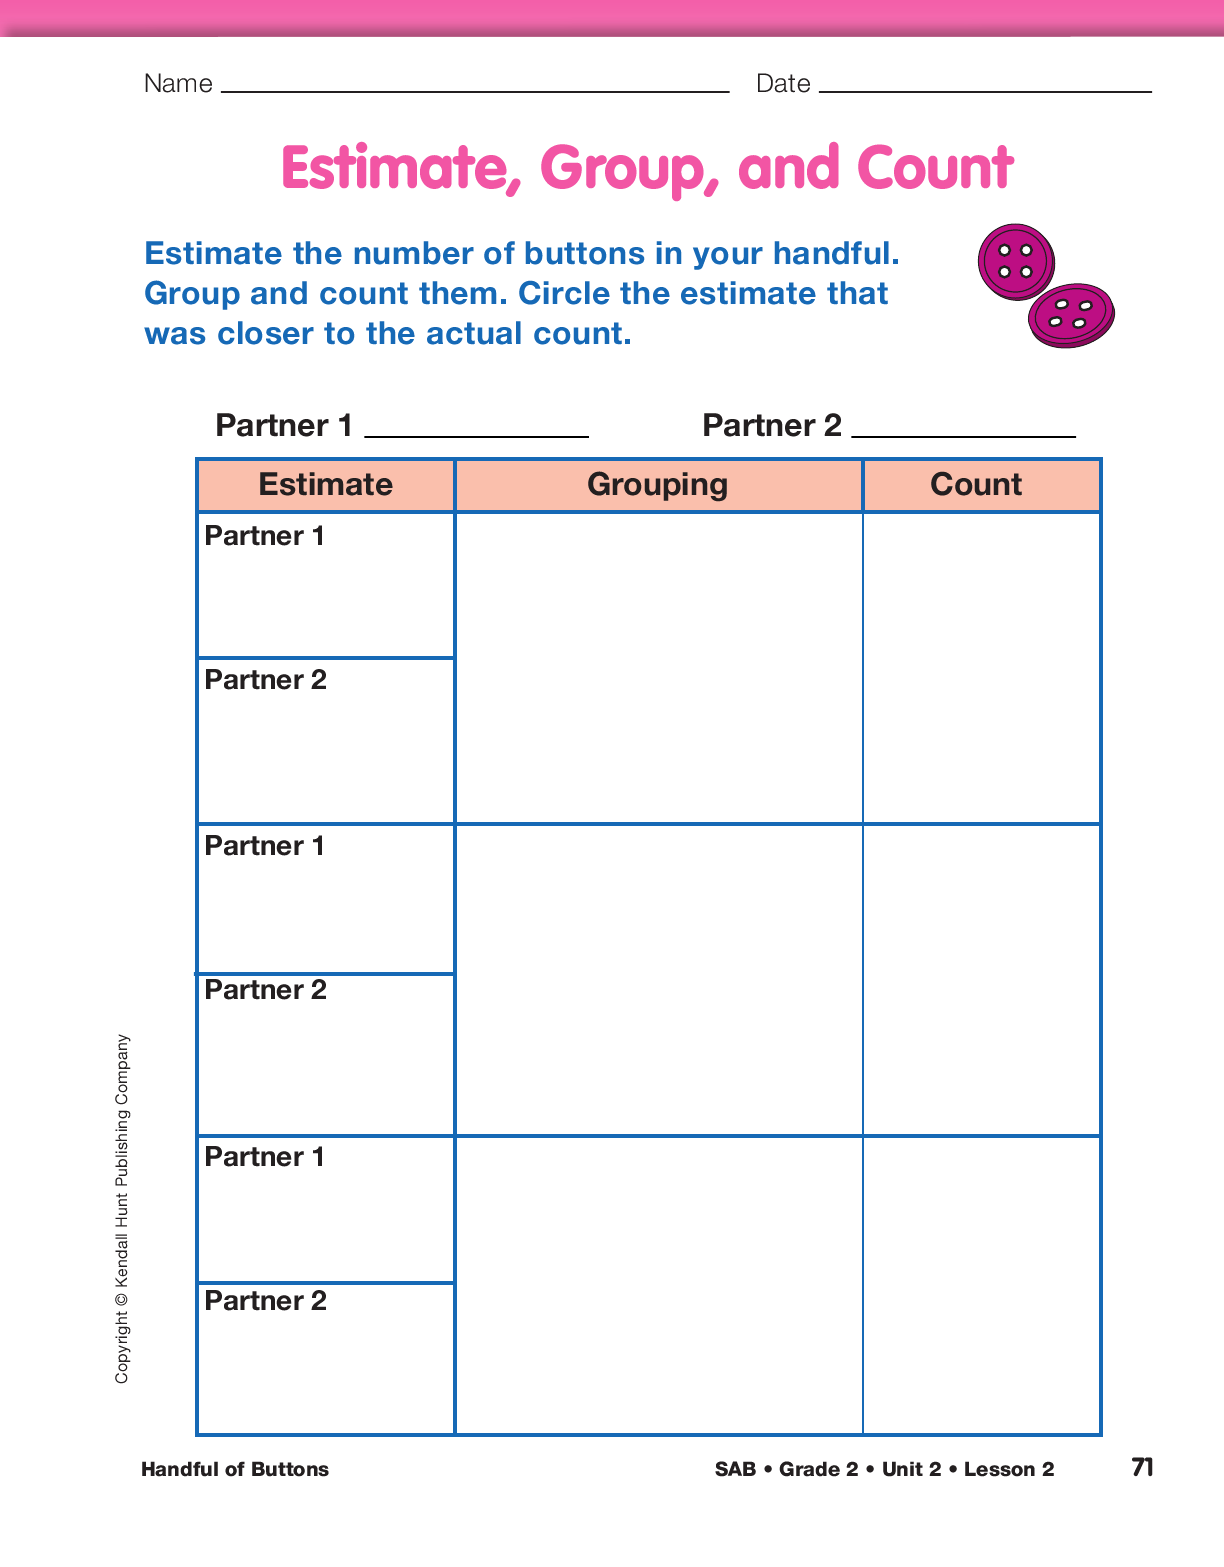
Group and Count a Handful of Buttons. Refer
students to the Handful of Buttons page in the
Student Activity Book and ask each student to grab a
new handful of buttons. Pairs must now share the
bag of buttons so each student has a sample. Direct
students to group the buttons and count them.
Remind them to use efficient groupings that are easier
to skip count. Have students draw pictures of
their groupings and write the total number of buttons
on the top section of the page. Have students check
each other’s groups and totals.
Introduce Intervals on the Handful of Buttons
Data Table. Use the display of the Handful of
Buttons page and ask students to look at the groups
of numbers listed on the left side of the Handful of
Buttons Data Table. Explain that the groups of numbers
are intervals.
As students look at the intervals, ask:
- What patterns do you see? (Possible responses:
For each interval, the first number has a one in it
and the second number has a zero in it; the second
number in each interval is the skip counting
by ten number)
- Where did we see these intervals before? (on the
number line or the 200 Chart)
- How is it like the arrangements on the number line
or 200 Chart? (Possible response: The second
number in each interval is the ten marked on the
number line; the first and last numbers in each
interval are like the first and last numbers on one
row of the 200 Chart.)
- How is it different from the intervals on the number line or 200 Chart? (Possible response: We
can’t see all the numbers in between the first and last number.)
- What do you think the dash means—for example, “one, dash, ten”?
The 200 Chart also may be helpful as students choose the interval that corresponds to the number of buttons in their handful.
If no one volunteers, explain that the dash means
that you are talking about the two numbers given
and all the numbers in between. The dash is usually
read as “to” or “through.” So, 1–10 includes 1, 10,
and all the numbers in between—2, 3, 4, 5, 6, 7, 8, 9.
It is read as “one to ten” or “one through ten.” On
the Handful of Buttons Data Table there happens to
be intervals of 10, but it is possible to have other
intervals.
- What are the numbers in the interval 1–5? (1, 2, 3, 4, 5) Point to them on the number line.
- What are the numbers in the interval 4–8? (4, 5, 6, 7, 8) Point to them on the number line.
- What are the numbers in the interval 31–40? (31, 32, 33, 34, 35, 36, 37, 38, 39, 40)
- How many numbers are in each of the intervals listed on the Handful of Buttons Data Table?
(10 numbers)
- How do you know there are 10 numbers? (We can count them on the number line. There are nine numbers for 31 to 39, then one more for 40.)
Give each student a self-adhesive note. Ask them to
record the number of buttons in their handful along
with their names or initials. Students should also
choose an interval that corresponds to their count.
Students will use these notes to create a class graph.
In the TIMS Laboratory Method, students normally complete
a data table before graphing their data. In this activity, we
suggest that you reverse the process by having students
place self-adhesive notes on a large display of the class
graph so they can see the actual number of students whose
handful of buttons fall within an interval. The data is then
transferred to the data table.
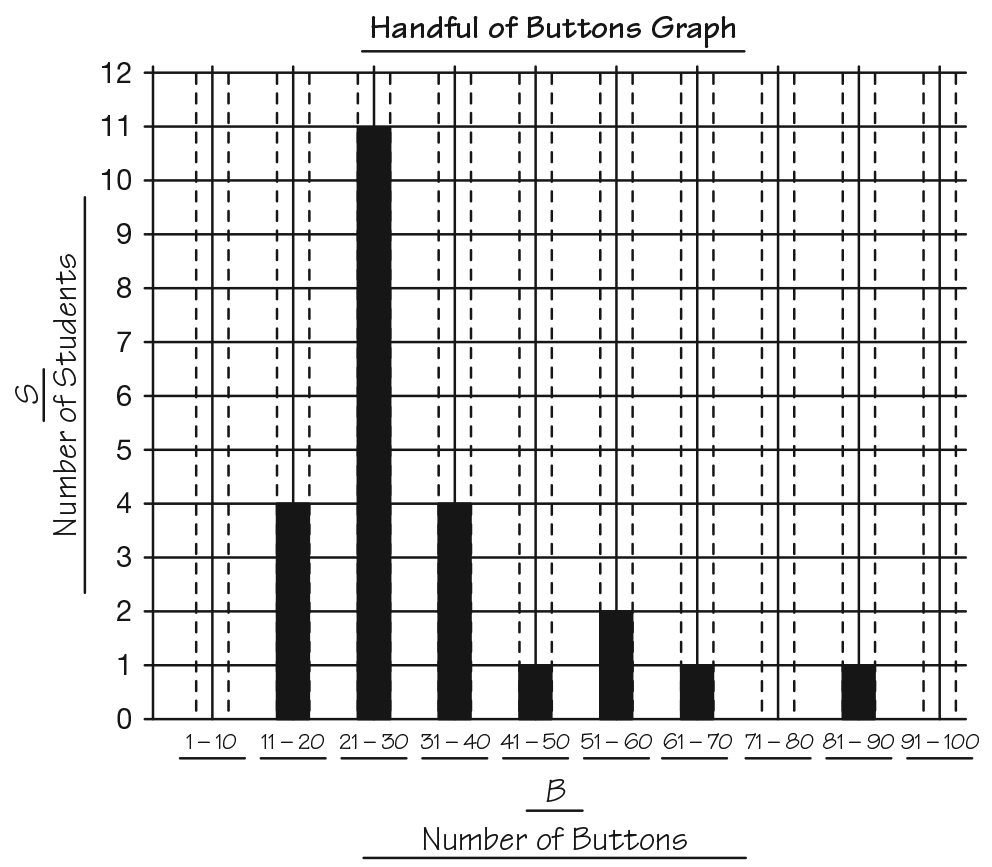
Display Data on Graph and Data Table. Direct students’ attention to the display of the
Handful of Buttons Graph you prepared.
- What do you see on this graph that is the same as
the data table? (Possible responses: Across the
bottom, it shows intervals just like the ones on
the data table; the vertical axis has “Number of
Students,” which is the same as the title of the
second column of the data table. The titles are
similar: Handful of Buttons Data Table and
Handful of Buttons Graph.)
- Are the intervals the same on both the data table and the graph? (yes)
- What information is on the vertical axis? (the number of students)
- What information are we going to show with this graph? (the number of students that have buttons
in each interval; how many students counted between 11–20 buttons in their handful)
Ask students who grabbed between 1–10 buttons to
come up and place their self-adhesive notes on the
graph starting at the bottom and moving up the axis.
As students add their data to the graph, ask the class
to check whether their self-adhesive note is being
added in the correct location. Continue calling the
remaining intervals until all students have placed
their notes on the graph. See Figure 2.
Before placing self-adhesive notes on the graph, you might
want to see if students understand intervals by having them
find intervals for different numbers. Ask:
- In which interval would you place 34? (31–40) 51? (51–60)
For students who have difficulty with intervals, have them
use their desk number line and place self-adhesive strips to
indicate intervals (e.g., 1–10, 11–20). Ask them to find a
number such as 18 and tell in which interval it belongs.
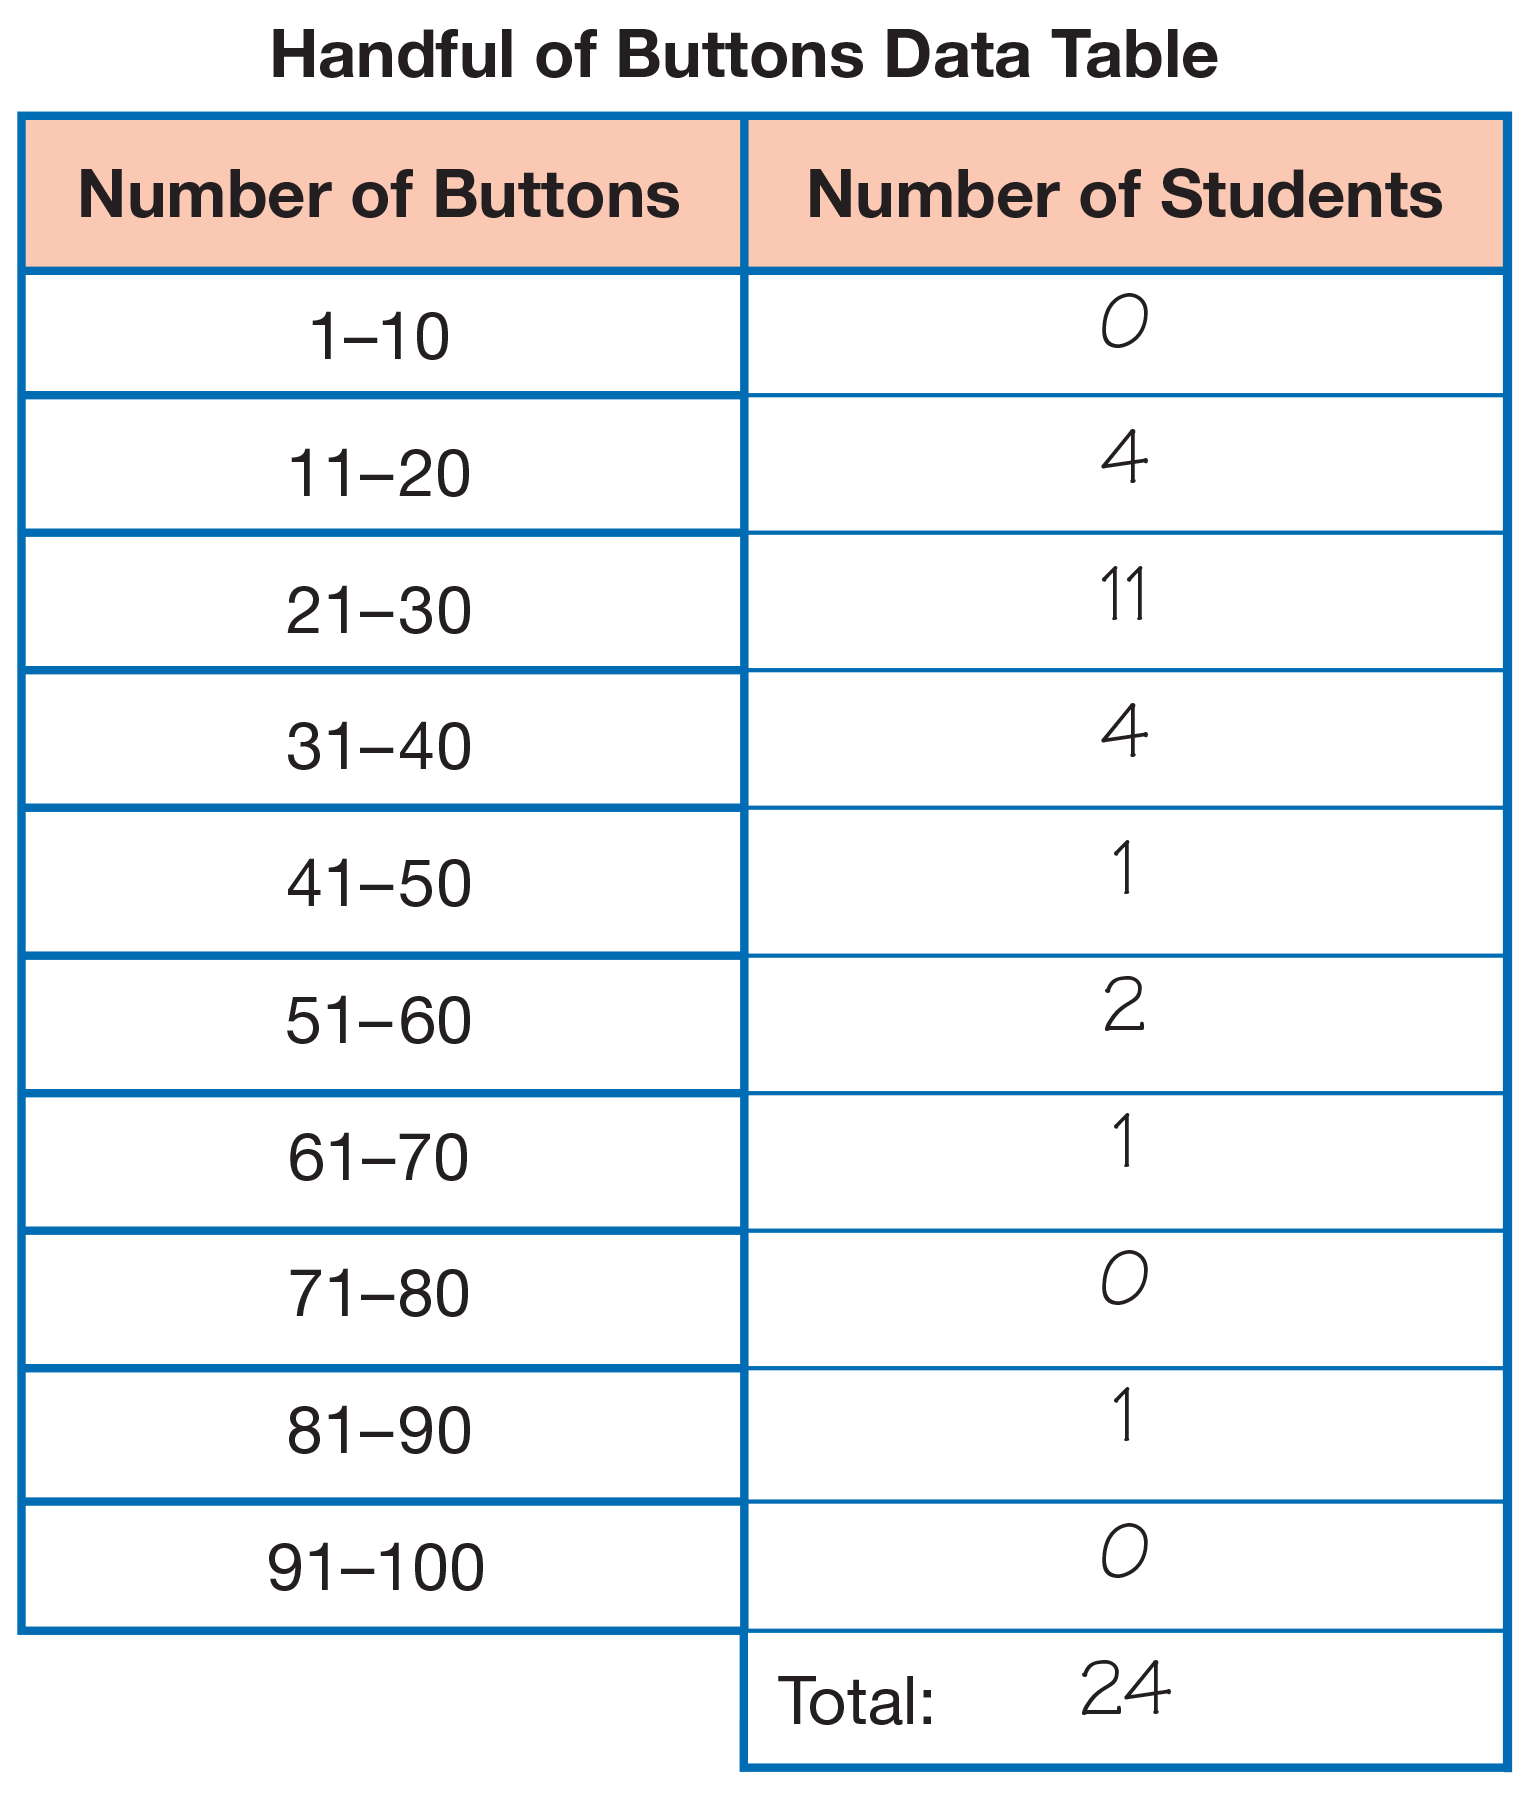
Next ask students to help transfer the data from the graph to the data table on the Handful of Buttons page. See Figure 3.
- How many students grabbed between 1 and 10 buttons? Fill in the number on the data table under the column “Number of Students.”
Continue with other intervals until the Handful of Buttons Data Table is completed.
Describe the Handful of Buttons Data. Give students
a few minutes to review the
Handful of Buttons Graph
and compare it with their completed
Handful of Buttons Data Table. Initiate a class discussion
about how to interpret the data. Responses to
the following questions are based on the sample data
in Figures 2 and 3.
- Look at the graph. What can you say about our
handfuls of buttons? (Possible responses: More
students had handfuls in the 21–30 interval than
any other; the next two highest intervals are
11–20 and
31–40; no one had fewer than 11 buttons
or more
than 90.)
- Which intervals have the least number of students? (1–10, 71–80, 91–100)
- How do you know? (Possible responses: I looked for the intervals that had zero for the number of
students; I looked for the intervals that had the shortest bars on the graph.)
- Which intervals have the most number of
students? (21–30)
- How do you know? (Possible response: I looked at the graph for the tallest bars.)
- Did more students grab more than 51 buttons or less than 51? (less than 51)
- How do you know? (Possible response: I looked
at the numbers at the bottom of the graph to find
51. The bars that show less than 51 buttons are
the tallest. There are only 3 short bars for 51 or
more buttons.)
- Do we have data for all the students in this class
on the graph? How do you know for sure? Explain
how you figured that out. Who figured it out a different
way? (Possible responses: I counted all the
students in the class and I counted all the
self-adhesive notes on the graph; I added all the
numbers on the data table.)
Ask students to use the information in the data table
and graph to make some predictions.
- If a new student joined our class and grabbed a
handful of buttons, how many buttons do you
think he or she would grab? Why? (Possible
response: I think he or she would grab 25 buttons
because most of the students in our class grabbed
between 21 and 30 buttons.)
- Do you think the new student might grab more
than [the most common interval on the class
graph] buttons? Why or why not? (Possible
response: It would depend on the size of his or
her hand and how they grabbed the handful.)
- How many students in our class drew less than
[the most common interval on the class graph]
buttons? How do you know?
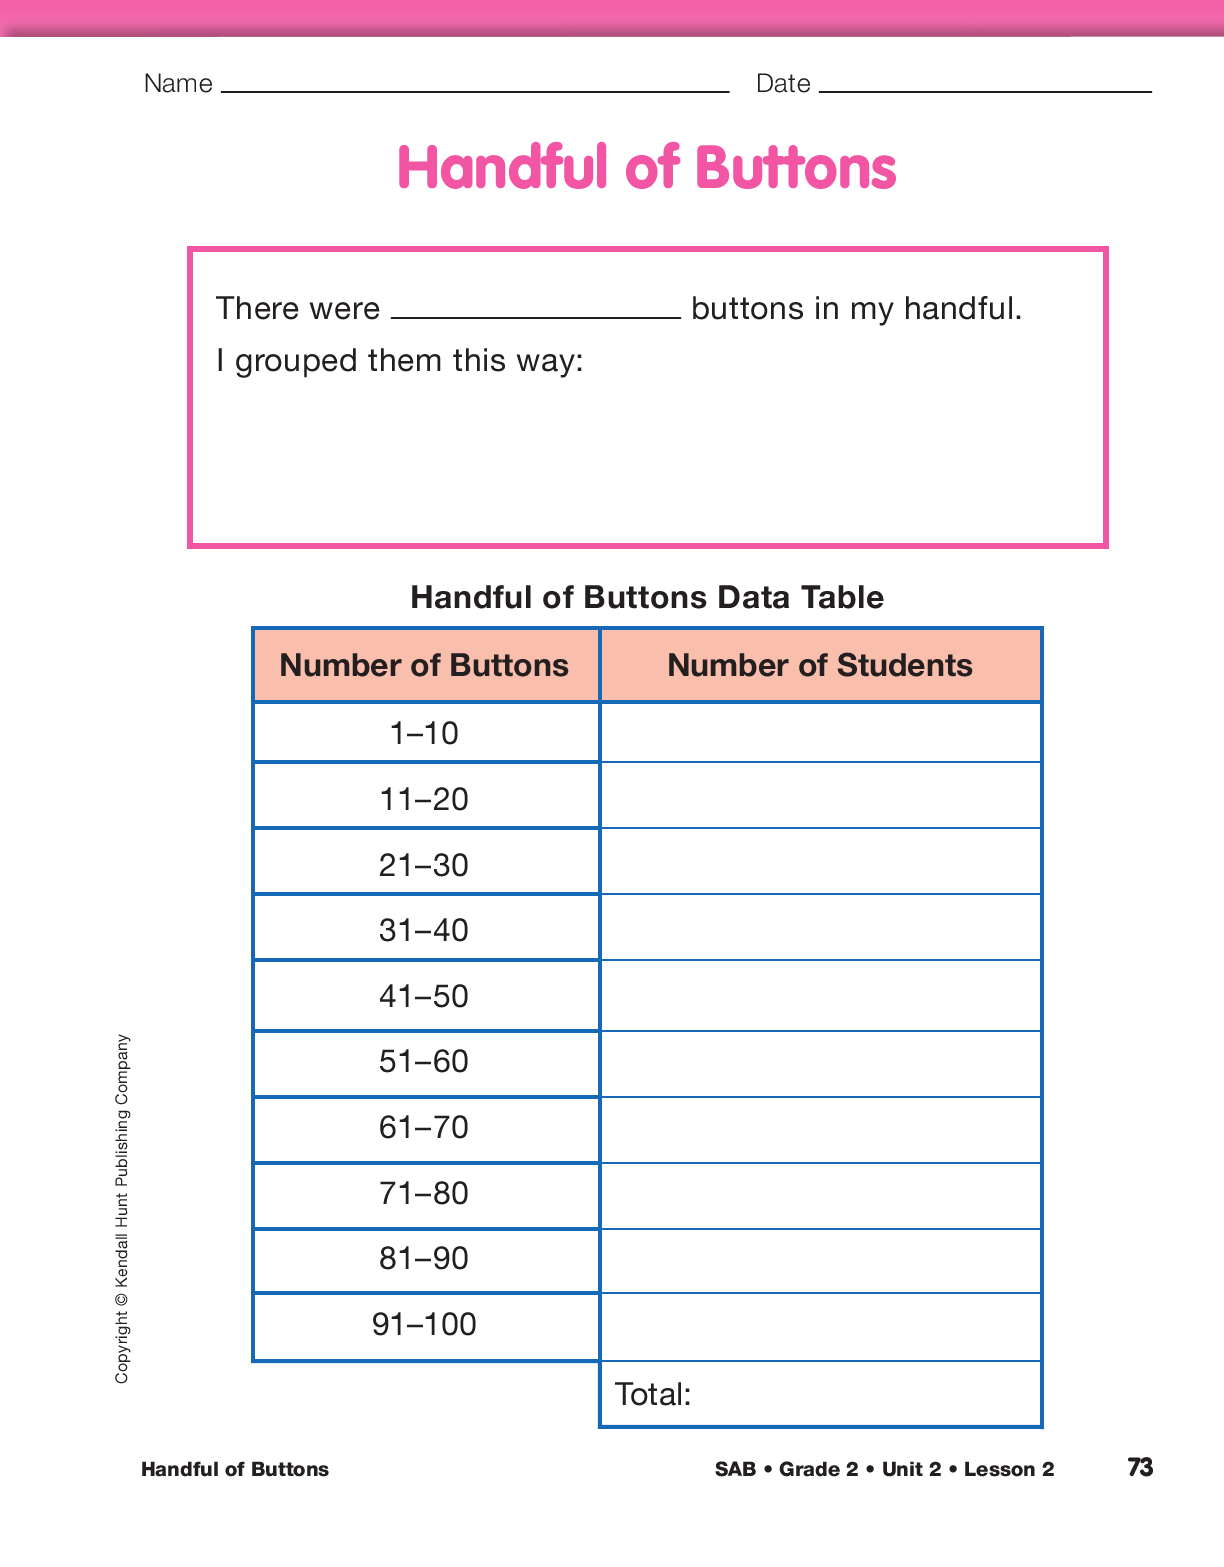
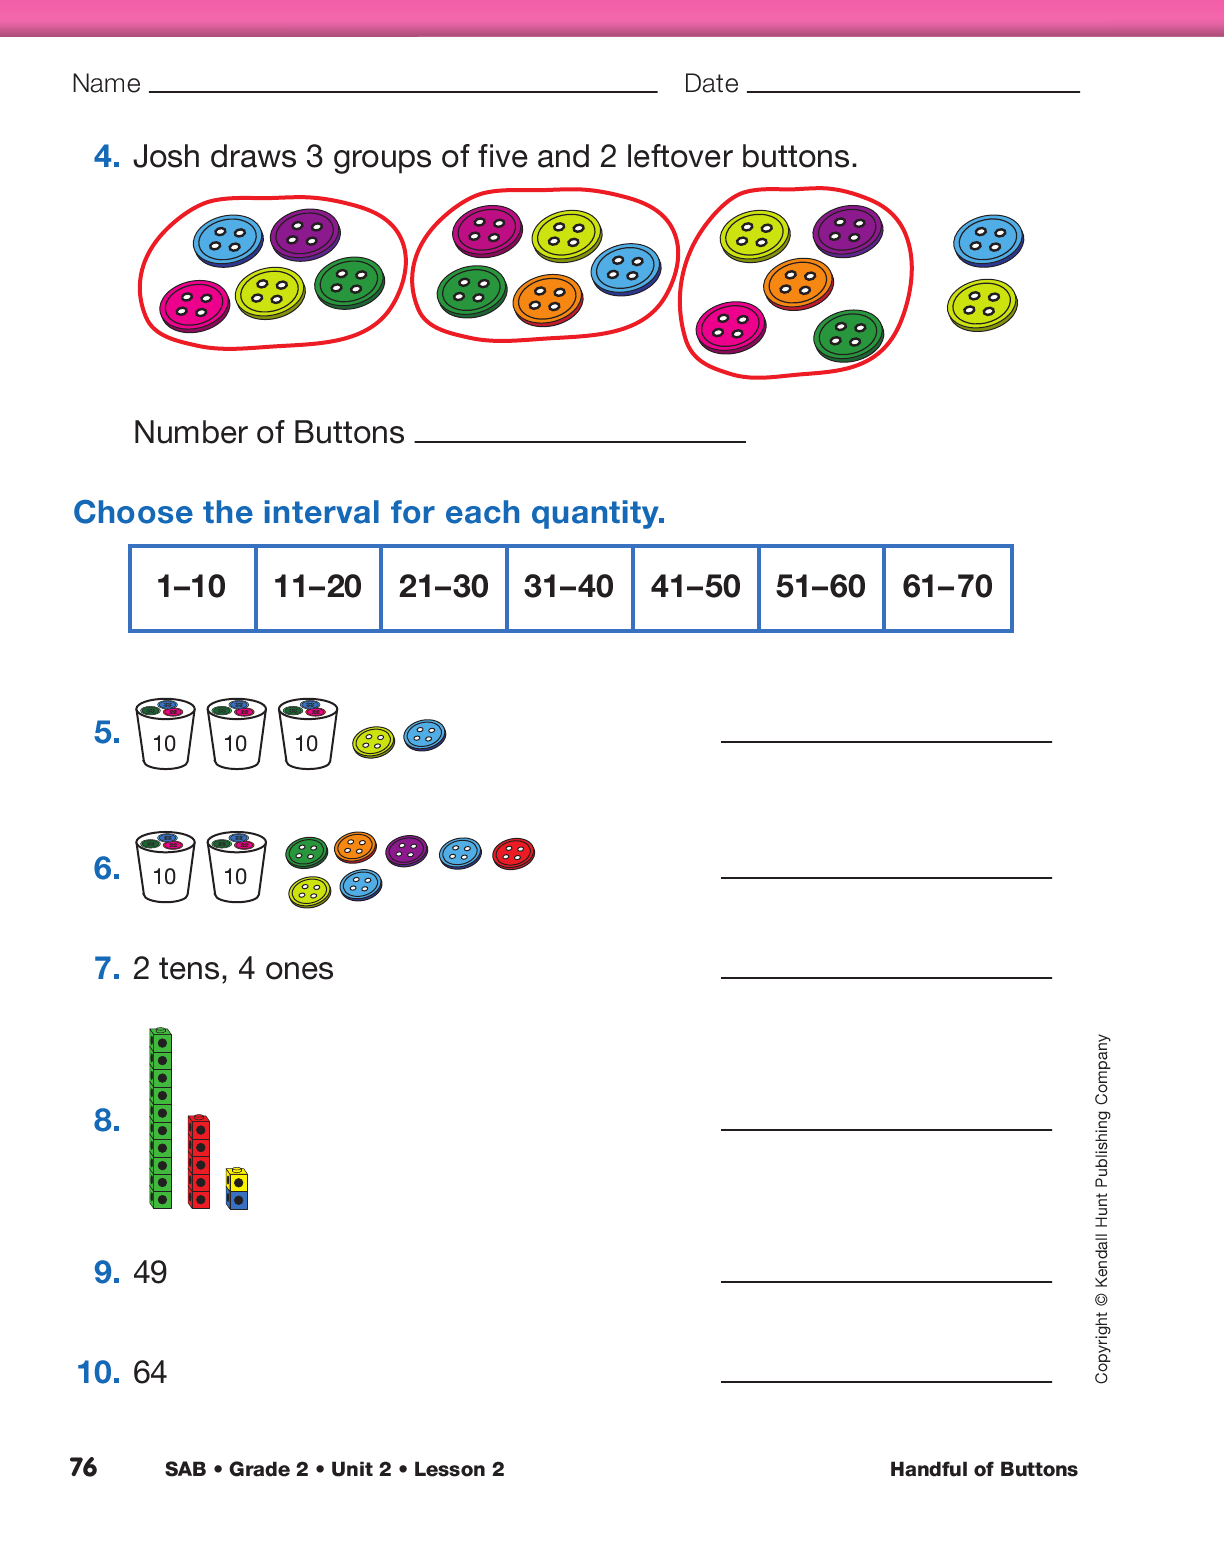
Assign the Groups of Buttons pages in the Student Activity Book to assess students’ abilities to use skip
counting to group and count buttons and to place numbers in intervals.
Use the Groups of Buttons pages in the Student Activity Book
to assess students’ abilities to represent and identify
quantities using groups of counters and drawings [E1]; use
efficient grouping strategies to count a collection of objects
[E3]; and use words and symbols to show comparisons of
quantities [E5].