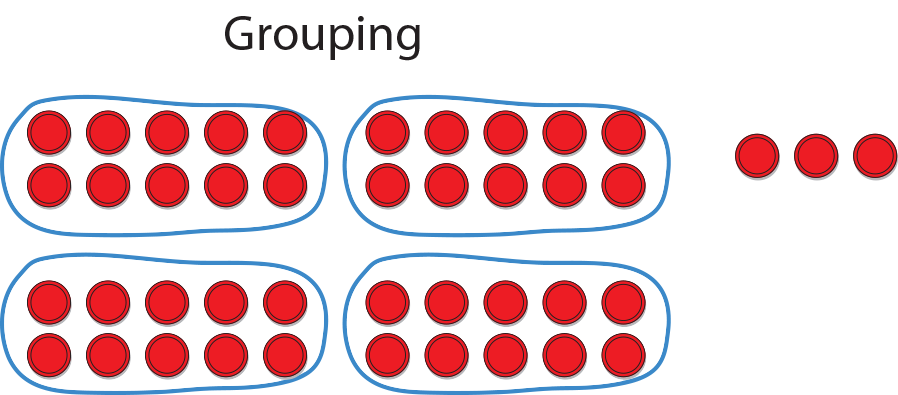
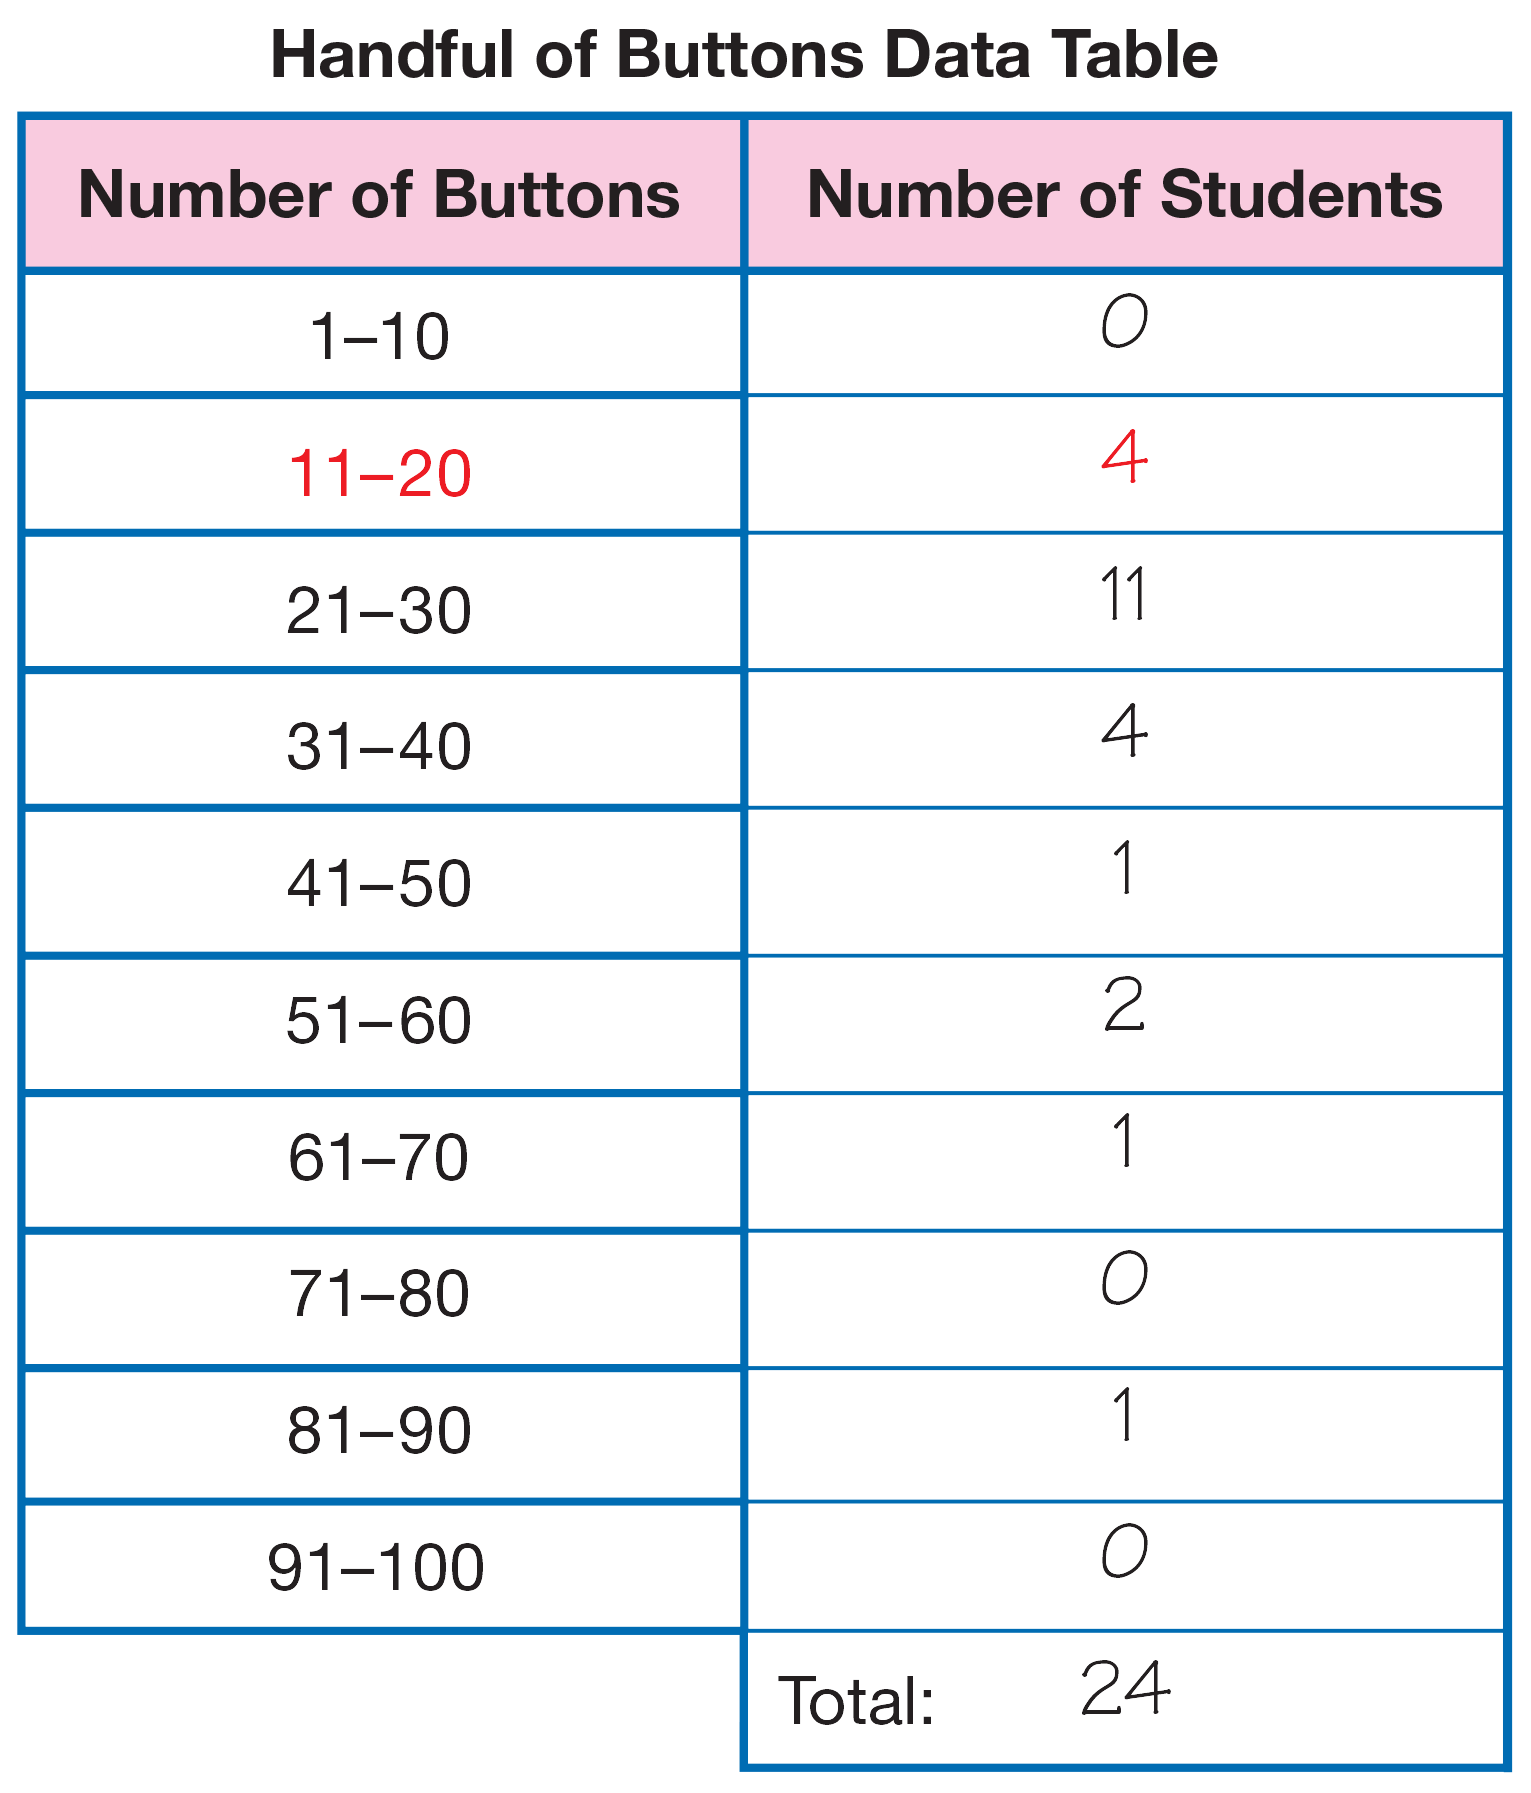
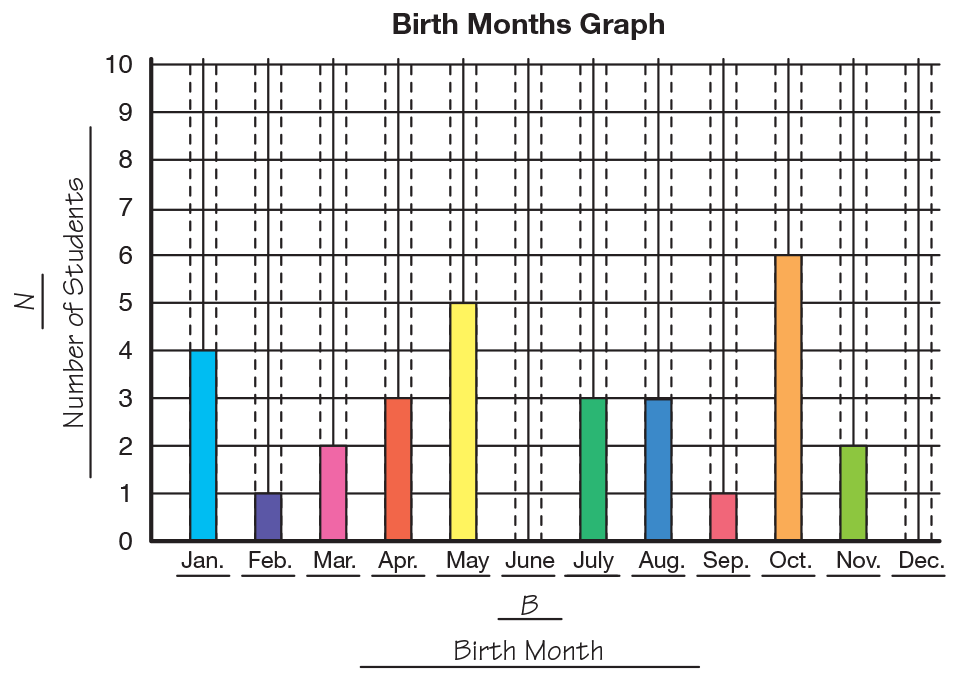
Students demonstrate their estimation and number sense skills. They estimate the number of buttons in their handful, group them to make counting easier, and skip count to find the total. They sort a handful of buttons, draw a picture of the sorted groups, and count the buttons according to the groupings. Students then make a class data table and a graph. The class analyzes the results, draws conclusions, and makes predictions based on the results.
Content in this Lesson
- Representing and identifying quantities using groups of counters and
drawings [E1]. - Using efficient grouping strategies to count a collection of objects [E3].
- Using a benchmark to estimate a quantity of objects in a collection [E4].
- Using words to show comparisons of quantities [E5].
- Collecting and organizing data in a table and bar graph [E9].
- Using a table or bar graph to solve problems about a data set. [E10].
Daily Practice and Problems E–H
Assessment in this Lesson
| ASSESSMENT | EXPECTATION ASSESSED |
|---|---|
|
Groups of Buttons Student Activity Book Pages 75–76 |
|
|
Observe the Write Problems about the Data section Teacher Guide - digital |
|


