


Button Sizer
Est. Class Sessions: 1–2Developing the Lesson
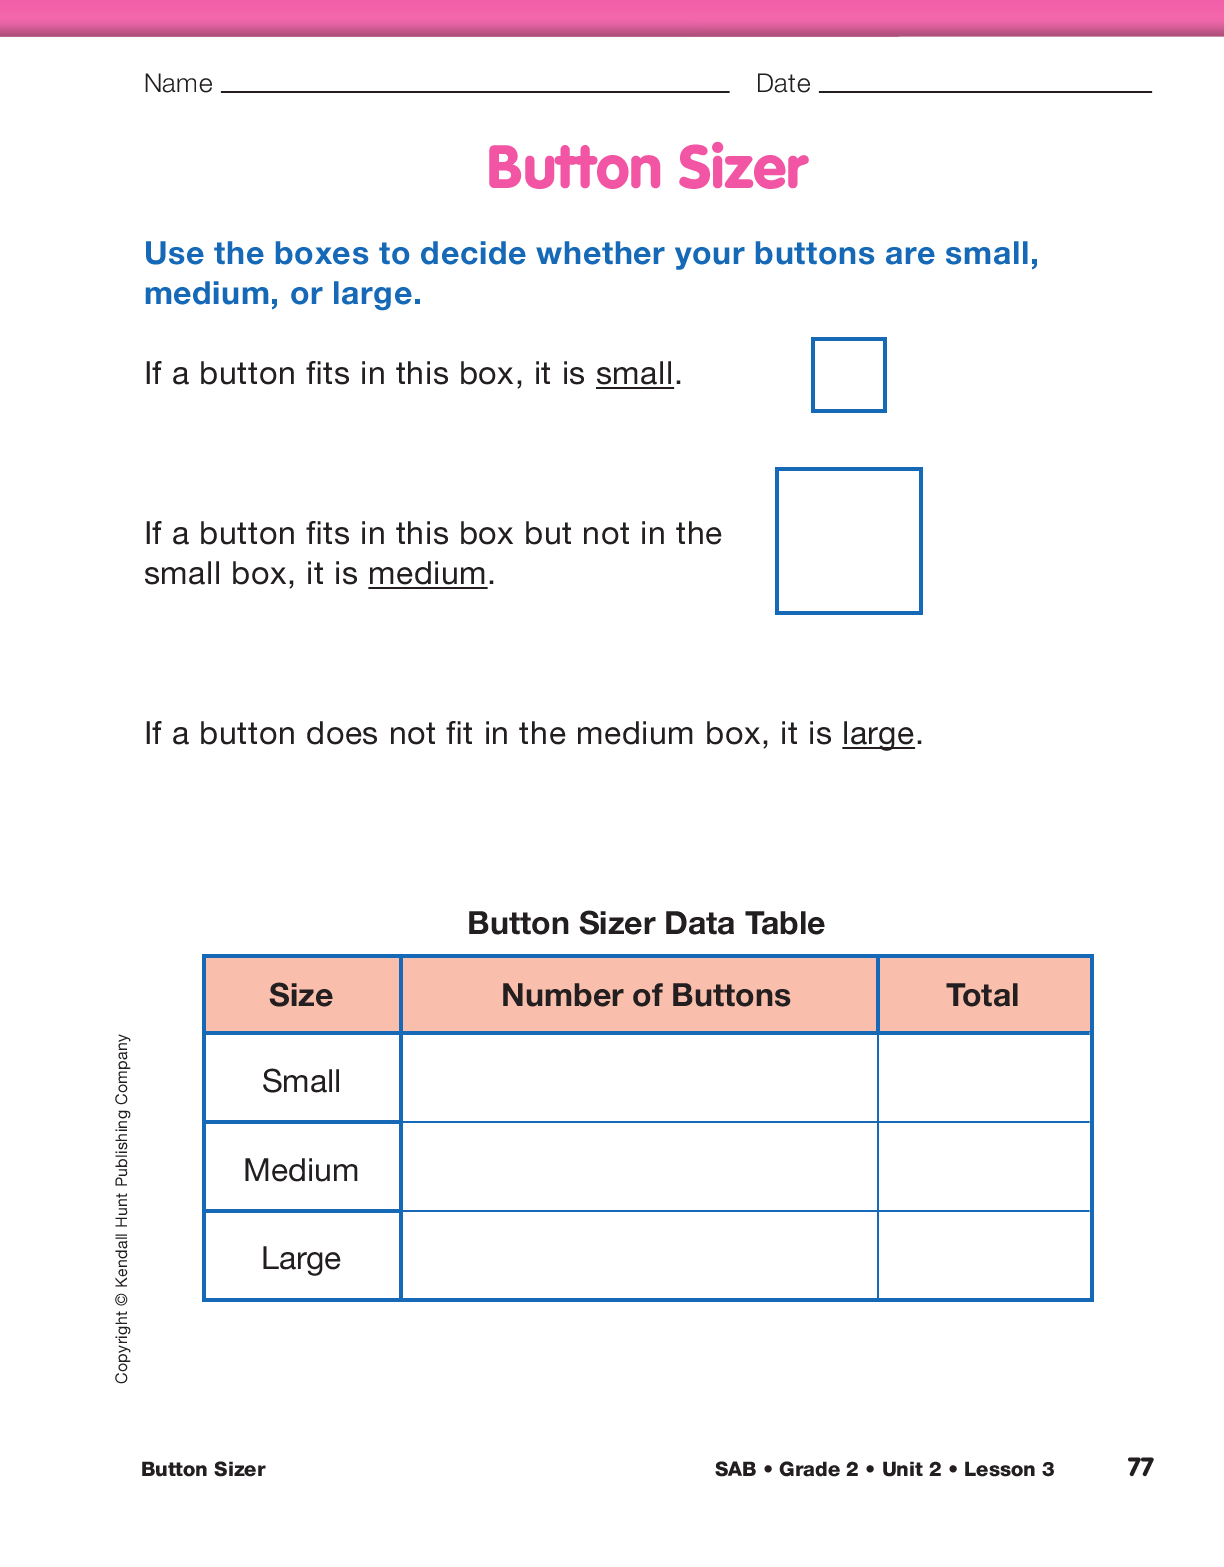
Collect and Organize Button Sizer Data. Grab a handful of buttons from the bag of buttons and ask students to brainstorm ways in which they might determine whether a button is small, medium, or large. Then display the first page of the Button Sizer pages in Student Activity Book.
Ask:
If necessary, explain that if a button does not fit inside the small box, they should see whether it fits inside the medium box. If the button does not fit inside the medium box, it is considered a large button.
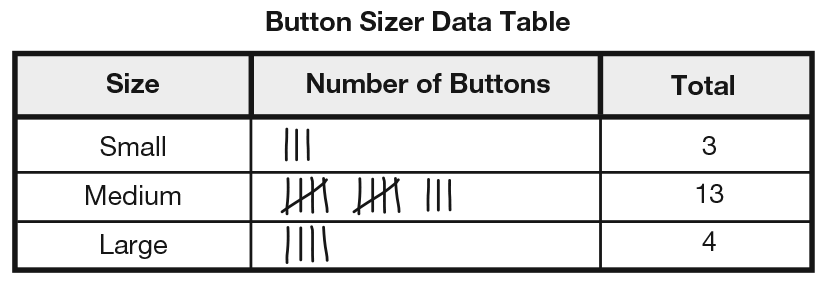
Each student pair should have a bag of buttons. Direct one student in each pair to grab a handful of buttons from the bag. Pairs work together to sort the buttons by size. However, each student should record the number of buttons for each size in his or her own data table. See Figure 1. Allow students to choose their own method of recording. Some may use tally marks or draw pictures of the buttons while others may write the total number onto the table after sorting the buttons on a desktop.
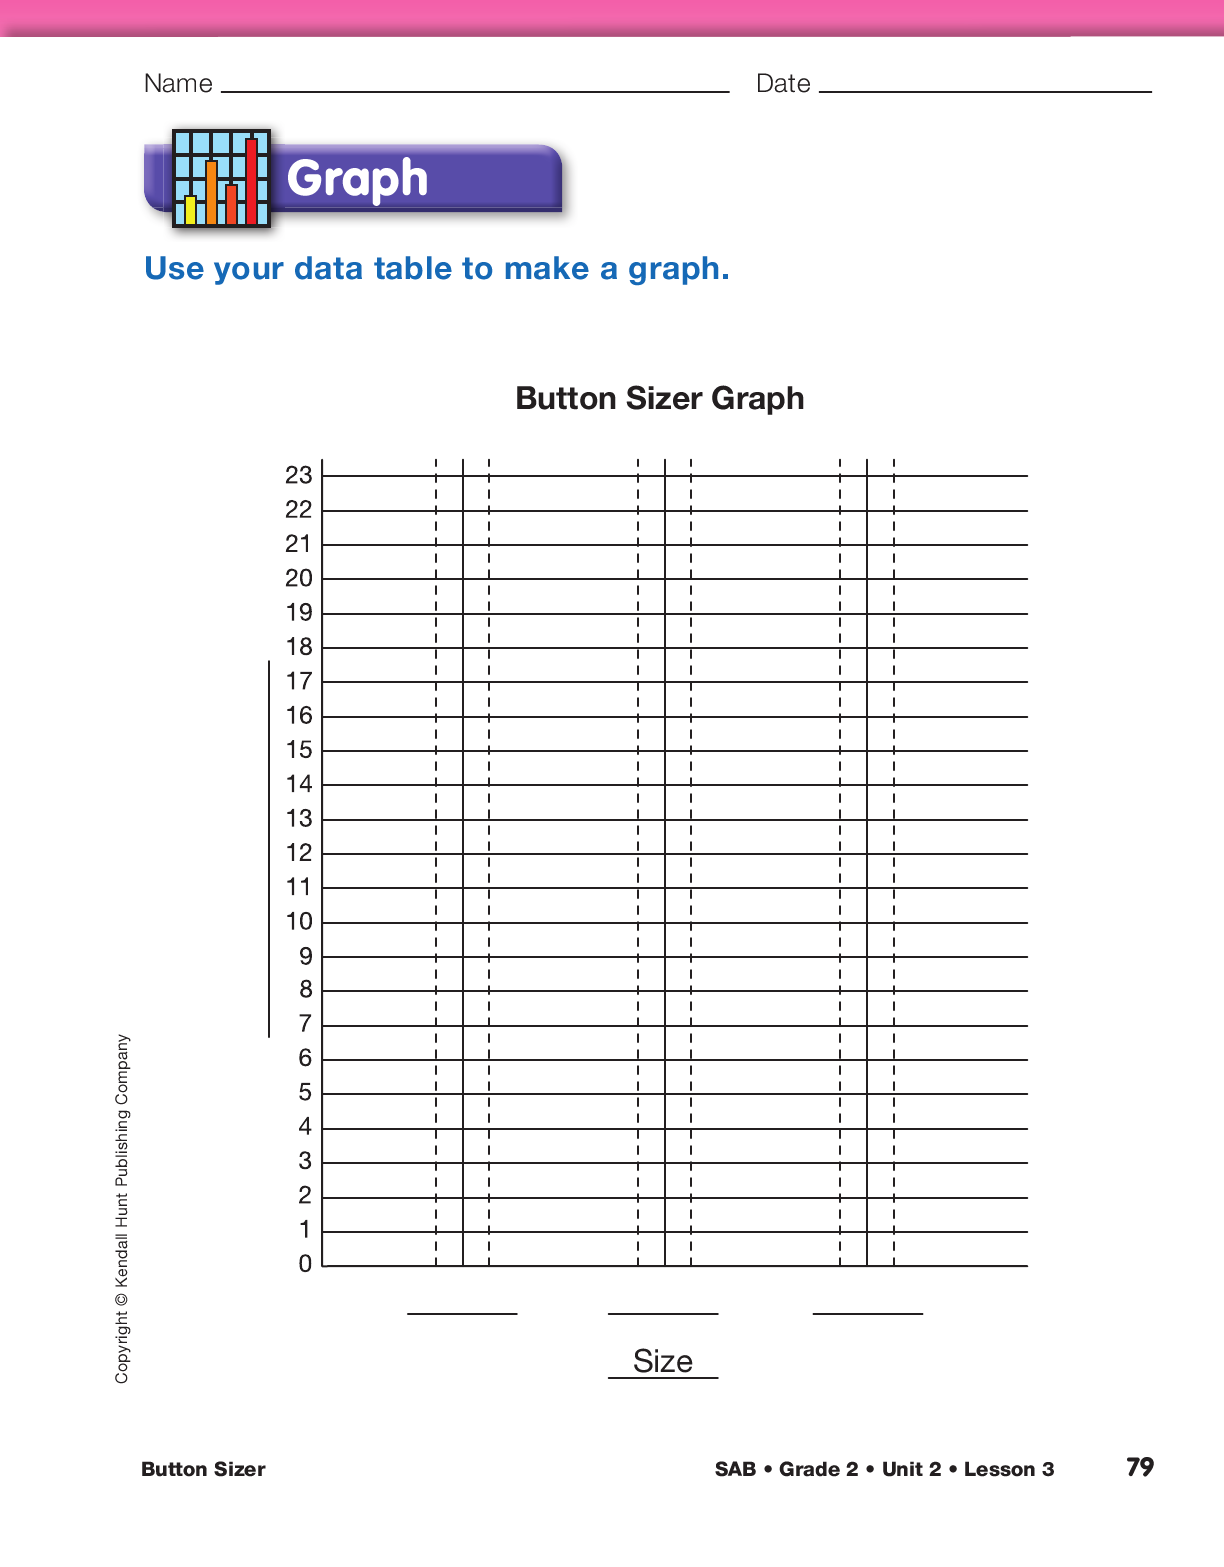
Graph Button Sizer Data. Guide students as they make a graph of their data on the Button Sizer Graph. See Figure 2 for a sample graph.
Ask:
Ask students to label the vertical axis of the graph.
Ask:
After students have completed their graphs, have pairs of students present their data tables and bar graphs to the class. Ask each pair to point out the graph’s highest and lowest bars and to summarize the results by explaining which sizes of buttons occurred most often and least often in their handful. While students are sharing their graphs, choose one graph to display and use for later discussions.
Ask students to use their graphs to figure out the total number of buttons in their handful. They should check the results with the information in their data tables. If there is a discrepancy, they should try to find the error.

Analyze Button Sizer Data. Display a completed Button Sizer Graph from one of the student pairs. Use the graph to solve a variety of addition and subtraction problems (e.g., join/start unknown, join/change unknown, compare/difference unknown.) Problems and responses are based on the sample graph in Figure 2.
Ask:

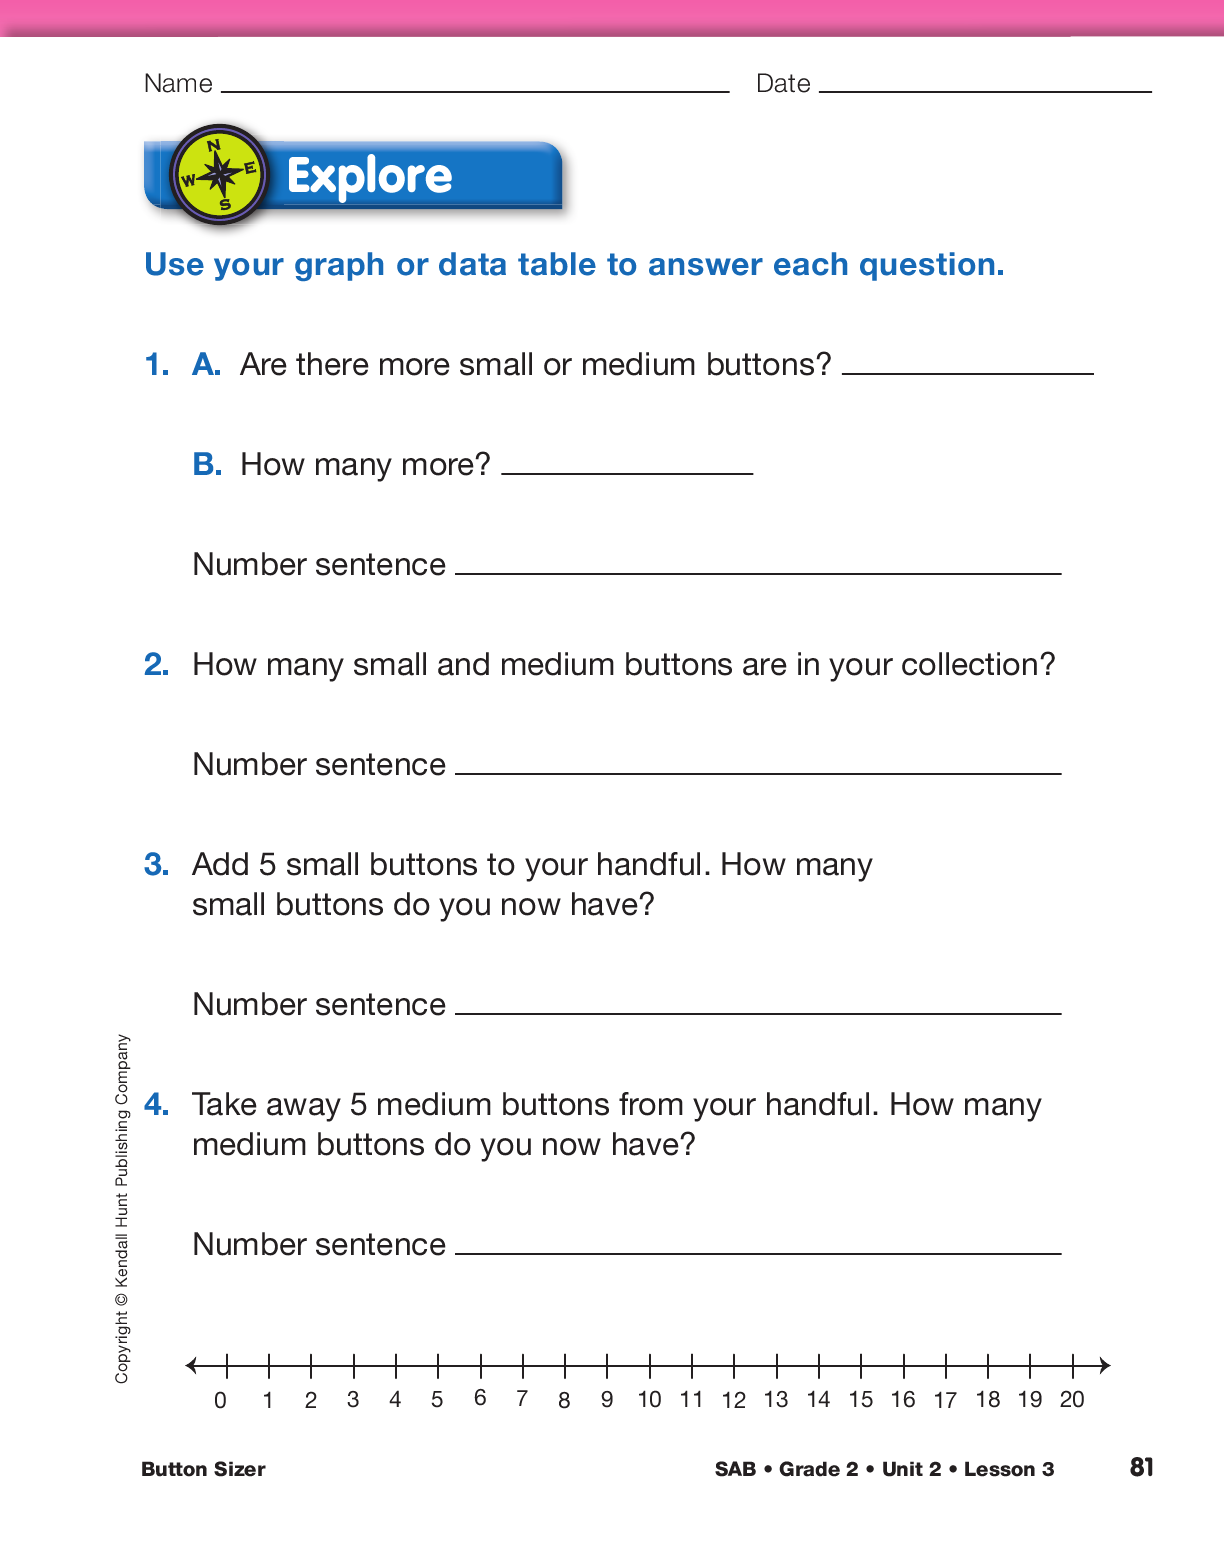
Assign Questions 1–5 in the Explore section of the Button Sizer pages in the Student Activity Book. Students are asked to solve problems about their data using the table or graph. As students are working, observe their problem-solving strategies.
Ask:
Ask students to share their strategies to Questions 1–5. Ask students to demonstrate the problem (e.g., act it out, show their picture) and show how they solved the problem.
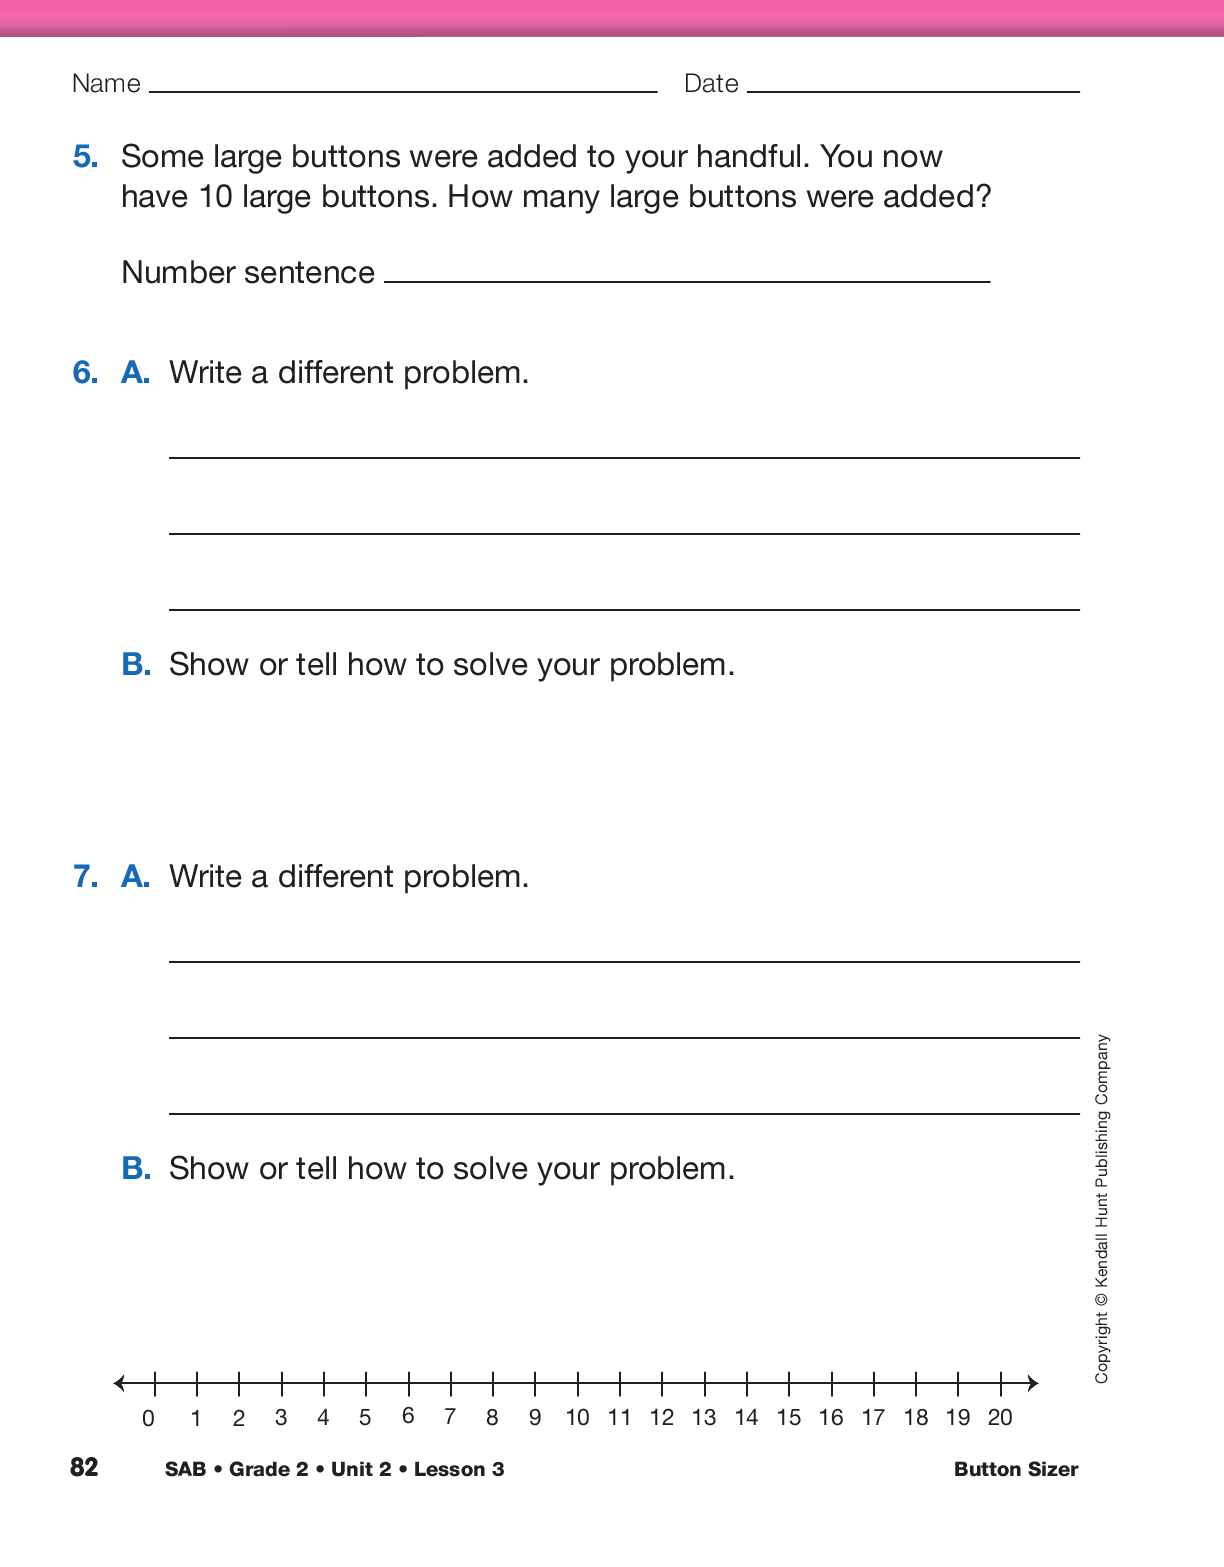
Next assign Questions 6–7. Students are asked to write a problem about their data and show how to solve it. Students could write two problems and then exchange papers with their partner and solve their partner’s problems. Have connecting cubes, the 200 Chart, and Number Line 0–30 from the Student Activity Book Reference section readily available.