Measure Palms in Centimeters. Ask a student to
measure a length (e.g., length of your desk, a
meterstick, the board) using the two one-palm units
you prepared. Record this measurement on the
board. Then ask a student to measure the same
length with the gorilla palms you prepared. Record
this measurement on the board as well.
- Why are the measurements not the same? (Possible response: The units are not the same
size.)
- How much do you think the palm units vary in our
class? (Responses will vary. Possible responses:
I think they will vary a lot; I do not think they
will vary much because we are all about the same
size.)
- Think about all the people in the entire school.
How much do you think the palm units vary? (Possible response: I think they will vary more
than our class because the older students and
adults have larger palms.)
Tell students that they are going to look at the variation
in palm sizes today.
- What do you think I mean when I say variation in
size? (Possible response: how the palms are different)
Use a centimeter ruler to measure your palm and the
gorilla palm. Record the measurements on the board.
- Do you think your palms are larger or smaller than
these two palms? (Possible response: probably
smaller)
Ask students to remove the Palm Variation: Our
Class pages from the Student Activity Book. In
Question 1 students are asked to trace and then measure
their palm. Give each student a self-adhesive
note to record their name and the size of their palm
in centimeters. As students complete their measurements,
ask them to record their name and measurement
on a display of the Palm Variation: Our Class Data Table and then place their self-adhesive note
above the appropriate number on the line plot you
prepared. See Materials Preparation.
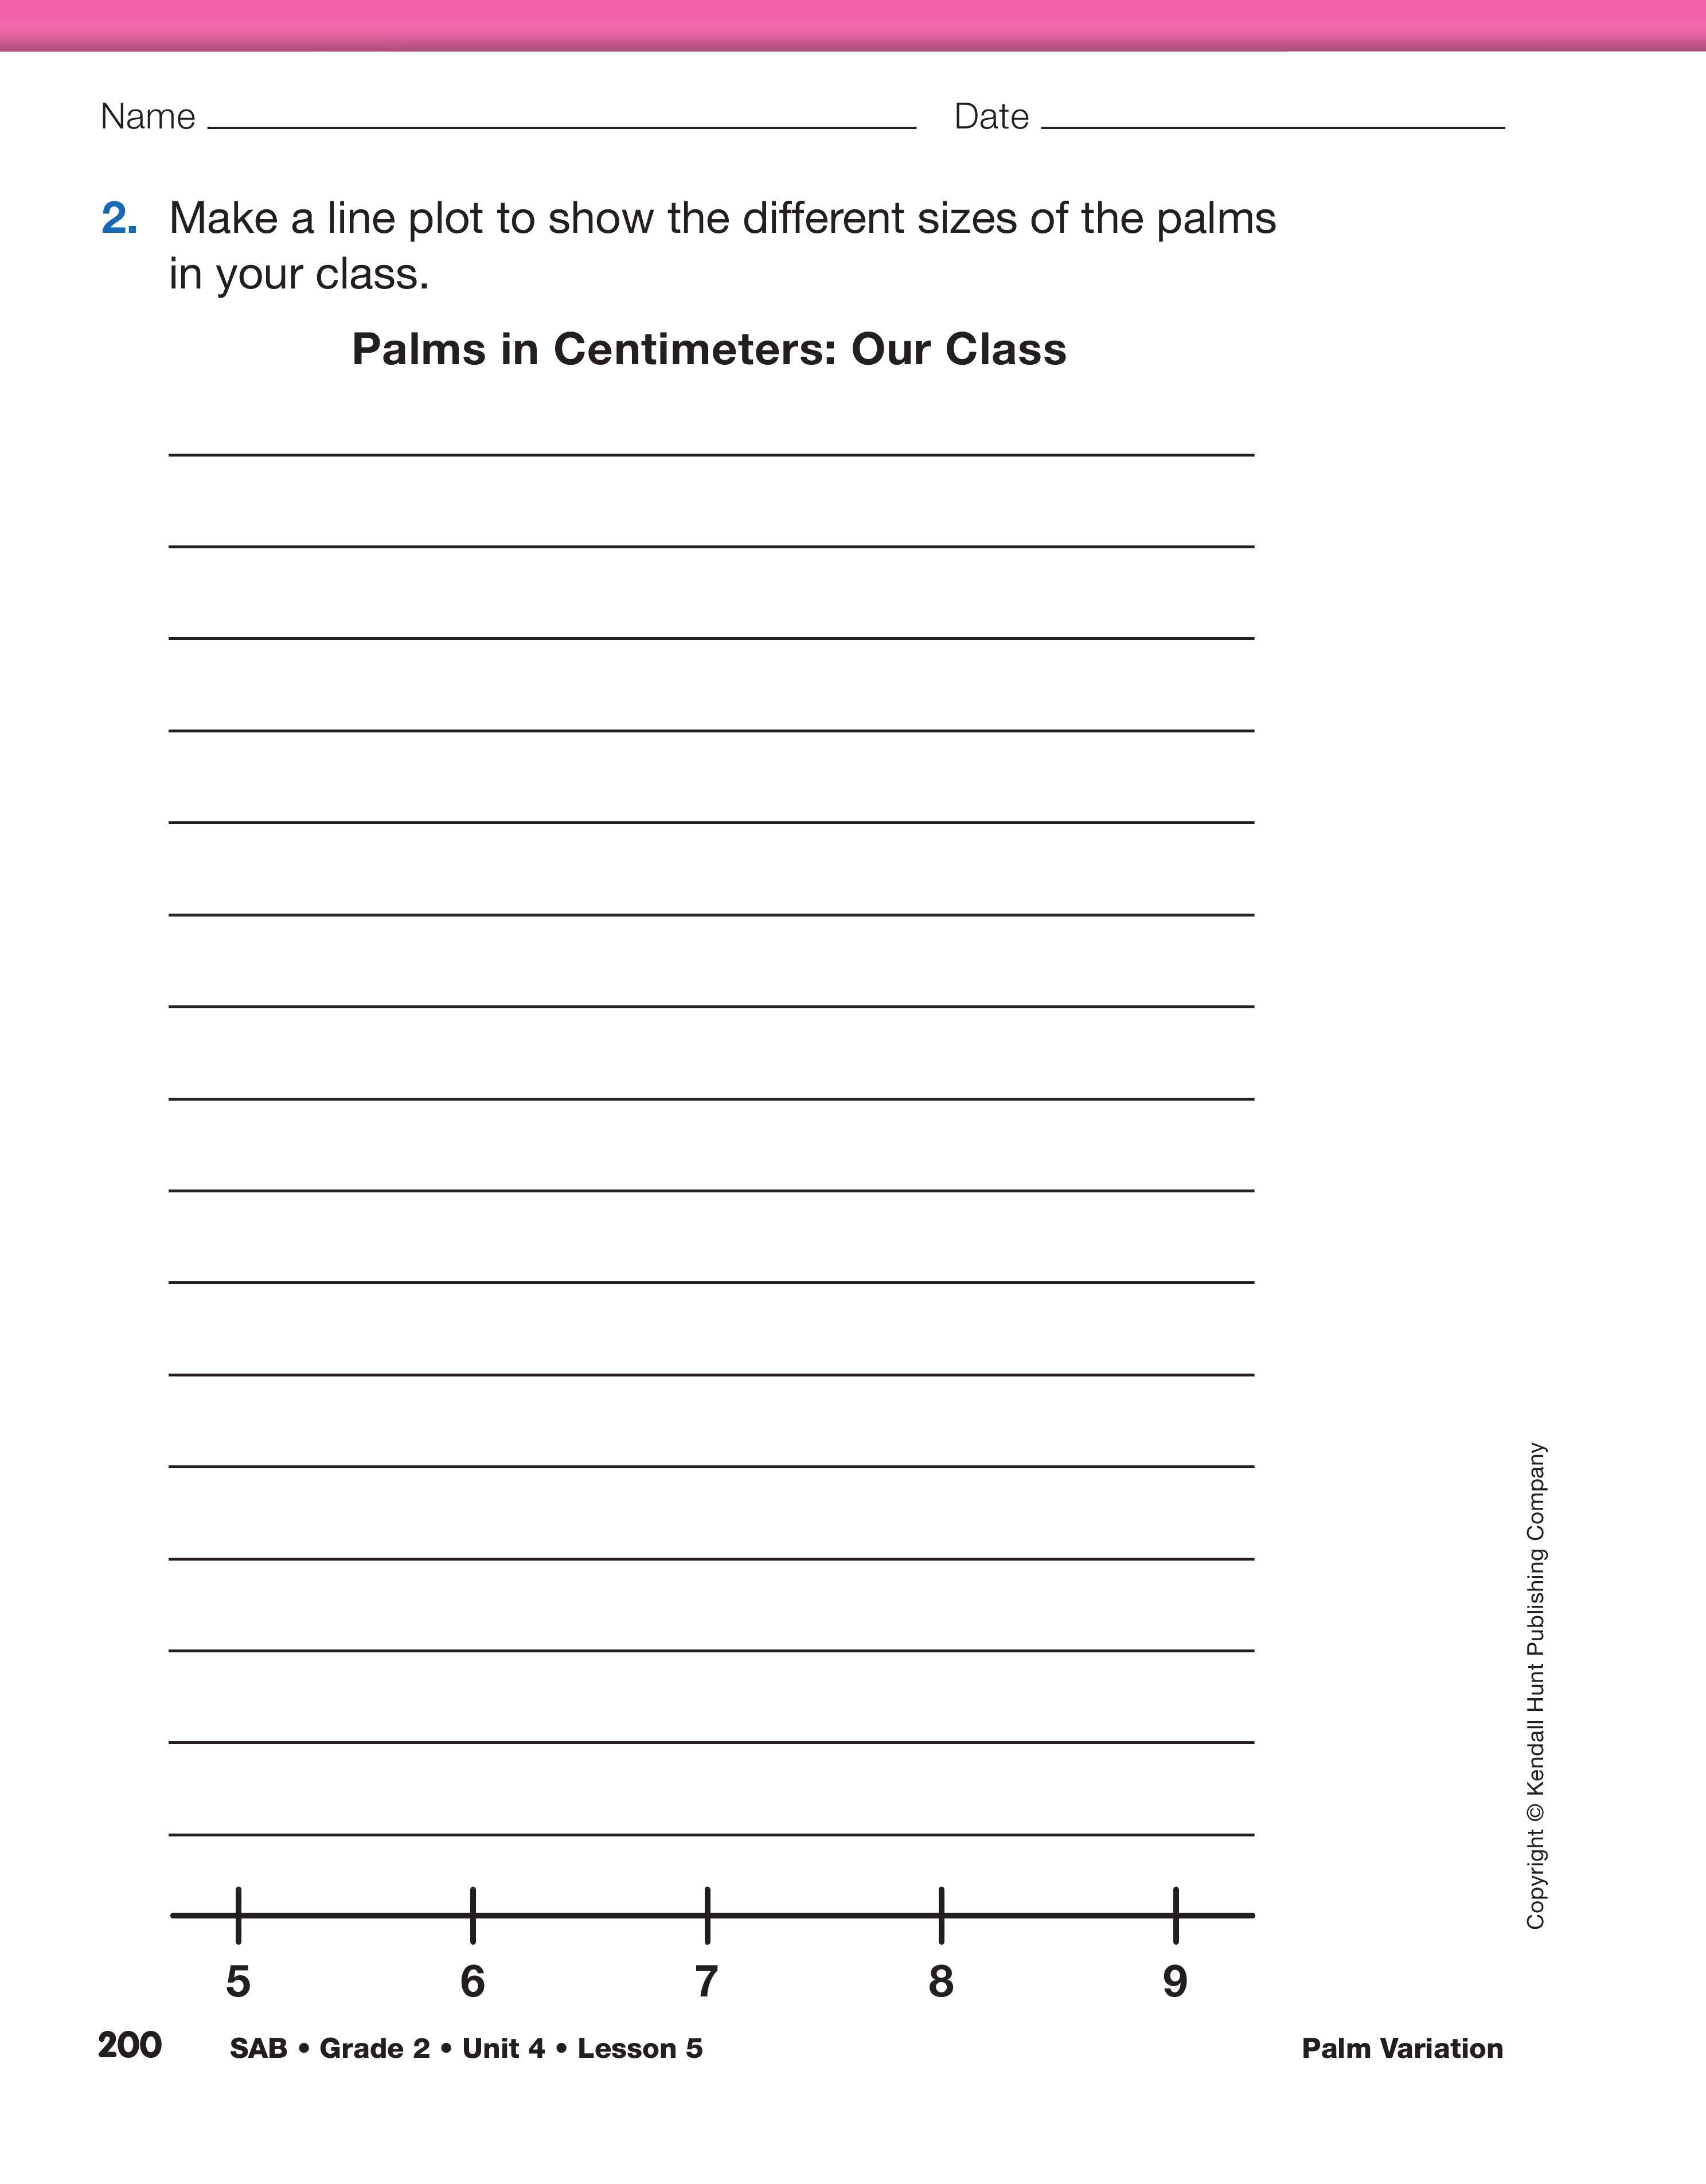
Now that the students have successfully collected
the palm measurements from the class, ask them to
use the table or line plot to make their own version
of a line plot in Question 2. Students should record
each measurement with an "X" using the lines as a
guide. Then ask students to work with a partner to
answer Question 3.
As students are working, circulate
and ask:
- How many students are shown on the line plot?
- How did you figure that out?
- Does that match the number of students in the
class?
- Does that match the number of students listed on
the data table?
Line Plot. A line plot is a graph that shows the frequency of
data along a number line. Line plots are best for small data
sets that contain less than 30 data points. Line plots are also
very similar to bar graphs. Bar graphs include a scaled
vertical axis that line plots do not. Each "X" on a line plot
represents one piece of data. Line plots are quick and simple
representations used to show the distribution of data and
find measures of central tendency such as median and
mode.
There are some challenges to making these simple representations.
The "Xs" need to be about the same size or students
will have to count each "X."
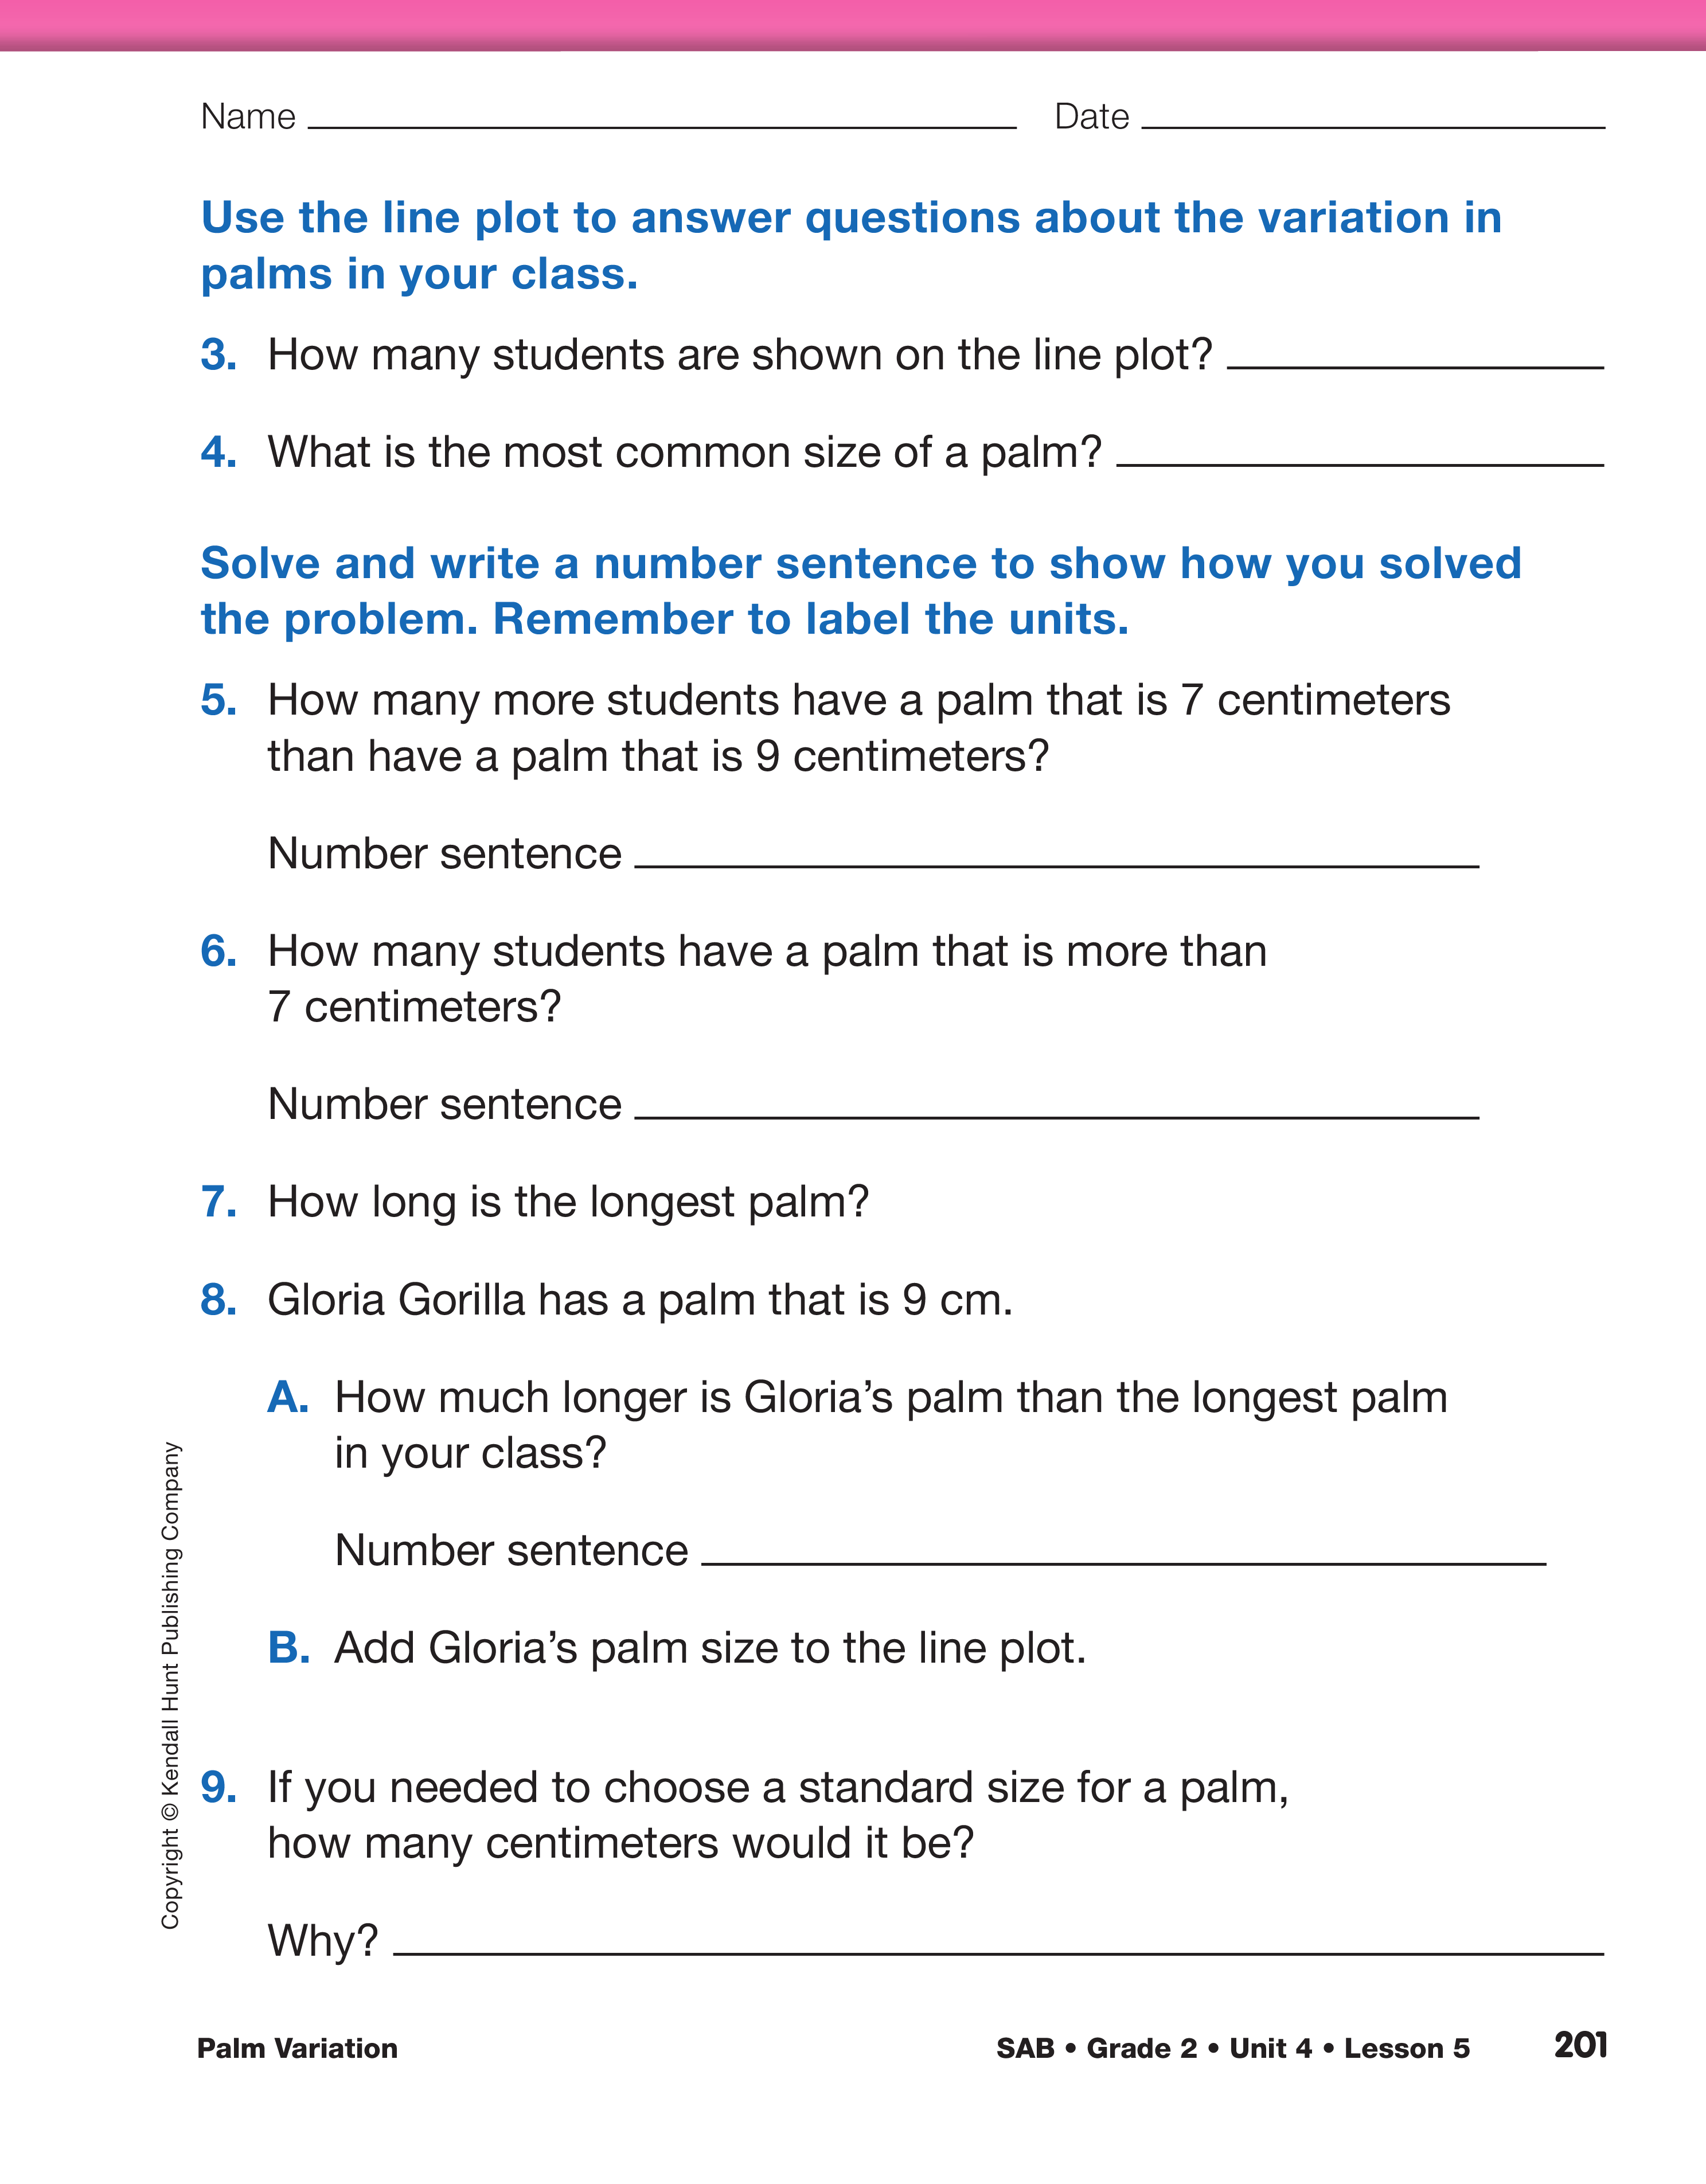
Analyze and Solve Problems about Class Data. Ask students to work with a partner to answer
Questions 4–7. When most are done, ask a few students
to share their strategies for solving these questions.
- What information did you need to solve this problem?
- Where did you find the information: line plot or
data table?
- What strategy did you use?
- How did you decide which palm was the longest
palm [Question 7]? (Possible response: the largest
measurement on a self-adhesive note, on the line
plot, or table)
Direct students' attention to Question 8. Ask a student
to show how to solve Question 8A. Then ask
students to complete Question 8B, adding Gloria
Gorilla's data to the line plot. While students are
adding an "X" to their line plot, make a self-adhesive
note to represent Gloria's palm size and add it to
the line plot display. Circulate, watching students as
they add Gloria's data to the line plot.
Pose the question in Question 9, if you needed to
choose a standard palm size, how many centimeters
would it be? Ask students to share their ideas with a
small group of students.
While students are discussing
ask:
- What is the most common palm size?
- If we were going to make a palm a standard or set
size, what size do you think you should choose? (Possible response: the most common; the size of
the teacher's palm)
- What if you collected data from the entire school:
adults and kids? Do you think the most common
palm size would be the same? (No, because second-graders are smaller than many of the people
in the school.)
- Would it make sense to make a palm unit 1 meter? (Possible response: No, because no one has a
palm that is 1 meter. That does not make sense.)
- Can you think of another unit that is similar in size
to a body part? (Possible response: A foot is
about the size of a foot and inch is about the size
of my thumb. A centimeter is about the width of
my pinkie.)
- Would it make sense if a foot was about the size of
a meter? (Possible response: No, because a meter
is too big; only if everyone was the size of
dinosaur.)
As a class, briefly discuss the question of how to
determine a standard palm size to get students
thinking. There will be a chance to revisit this
question later in the lesson.
In Question 9 on the Palm Variation: Our Class page students
add Gloria Gorilla's palm to the line plot. If your class
is using a copy of the larger gorilla palm from the cover of
the book Actual Size, extend the line plot you have displayed
to add this palm to the data set.