Palm Variation
Est. Class Sessions: 1
Students use a line plot and table to analyze the variation in palm sizes. They use this data to solve problems and choose a standard size for a palm.
Content in this Lesson
- Solving word problems (e.g., compare) involving length [E3].
- Making a line plot to find information about a data set [E8].
- Reading a table and line plot to find information about a data set [E9].
- Using a table or line plot to solve problems about a data set [E10].
- Using labels to show what numbers mean [MPE6].

Materials for Students
| Daily Practice and Problems | Lesson | Homework | Assessment | ||
|---|---|---|---|---|---|
Student Book |
Student Activity Book |
|
|
|
|
Teacher Resources |
Teacher Guide - digital |
|
|
Supplies for Students
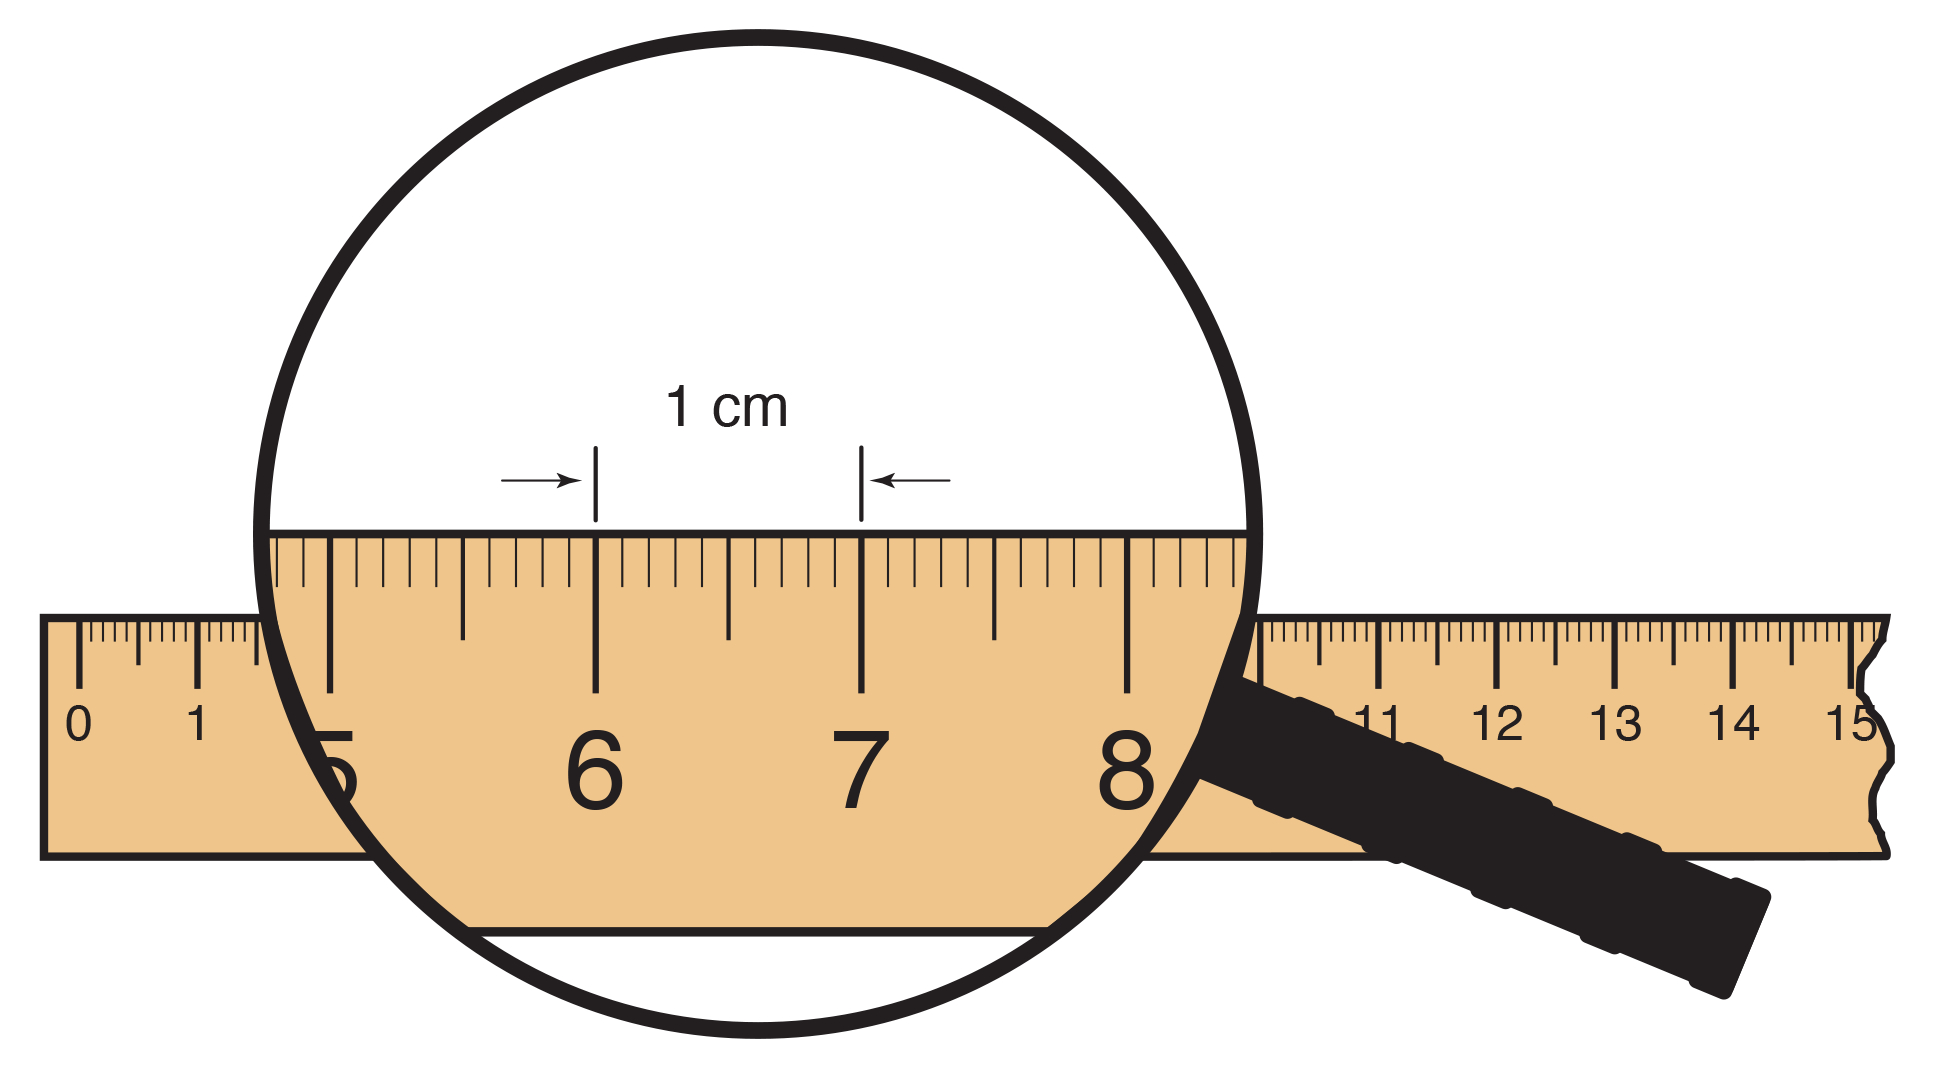
centimeter ruler
small self-adhesive note
Supplies for Student Groups
chart paper
Materials for the Teacher
two copies of Gloria the Gorilla's Palm from Lesson 1 (Teacher Guide)
Display of Palm Variation: Our Class Data Table Master (Teacher Guide)
Unit 4 Assessment Record
Math Facts Class Record
two one-palm units from Lesson 1. See Materials Preparation.
centimeter ruler
Display of a line plot on chart paper or the board. See Materials Preparation.
chart paper
Materials Preparation
One-Palm Units. As you did in Lesson 1, trace your hand with your fingers together and your thumb perpendicular to your palm. You will need two copies of this palm unit. You could also use the copies saved from Lesson 1.
Make a Line Plot. Make a line plot on the board or on chart paper. See Figure 1. Leave enough room around each number on the horizontal axis the size of a self-adhesive note.
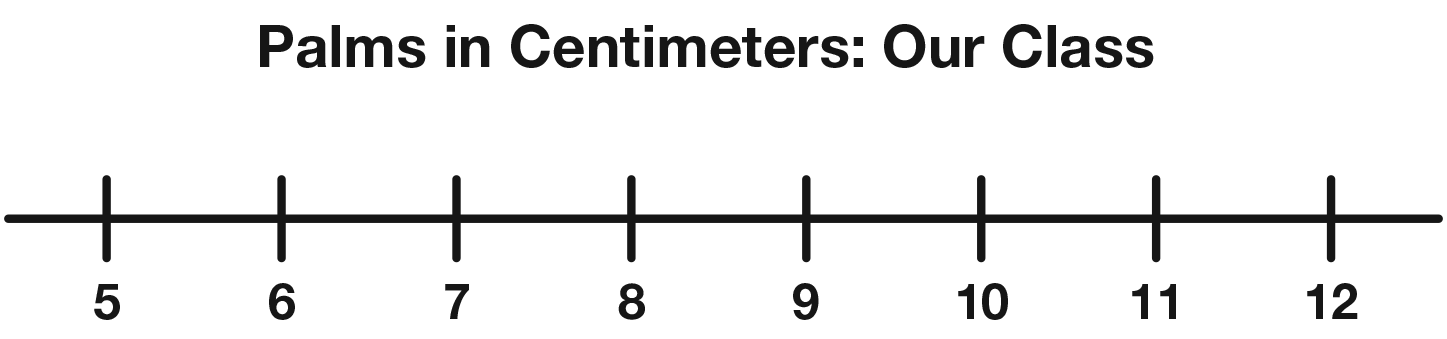
Figure 1: Blank line plot to collect palm size data
Assessment in this Lesson
| Assessment | Expectation Assessed | Math Practices Expectation Assessed |
|---|---|---|
|
Palm Variation: Central School with Feedback Box Student Activity Book Pages 203–208 |
|
|
|
DPP Item K Using Math Facts Teacher Guide - digital |
|
|