Rolling Along in Centimeters
Est. Class Sessions: 3–4Developing the Lesson
Part 5: Explore and Use Data
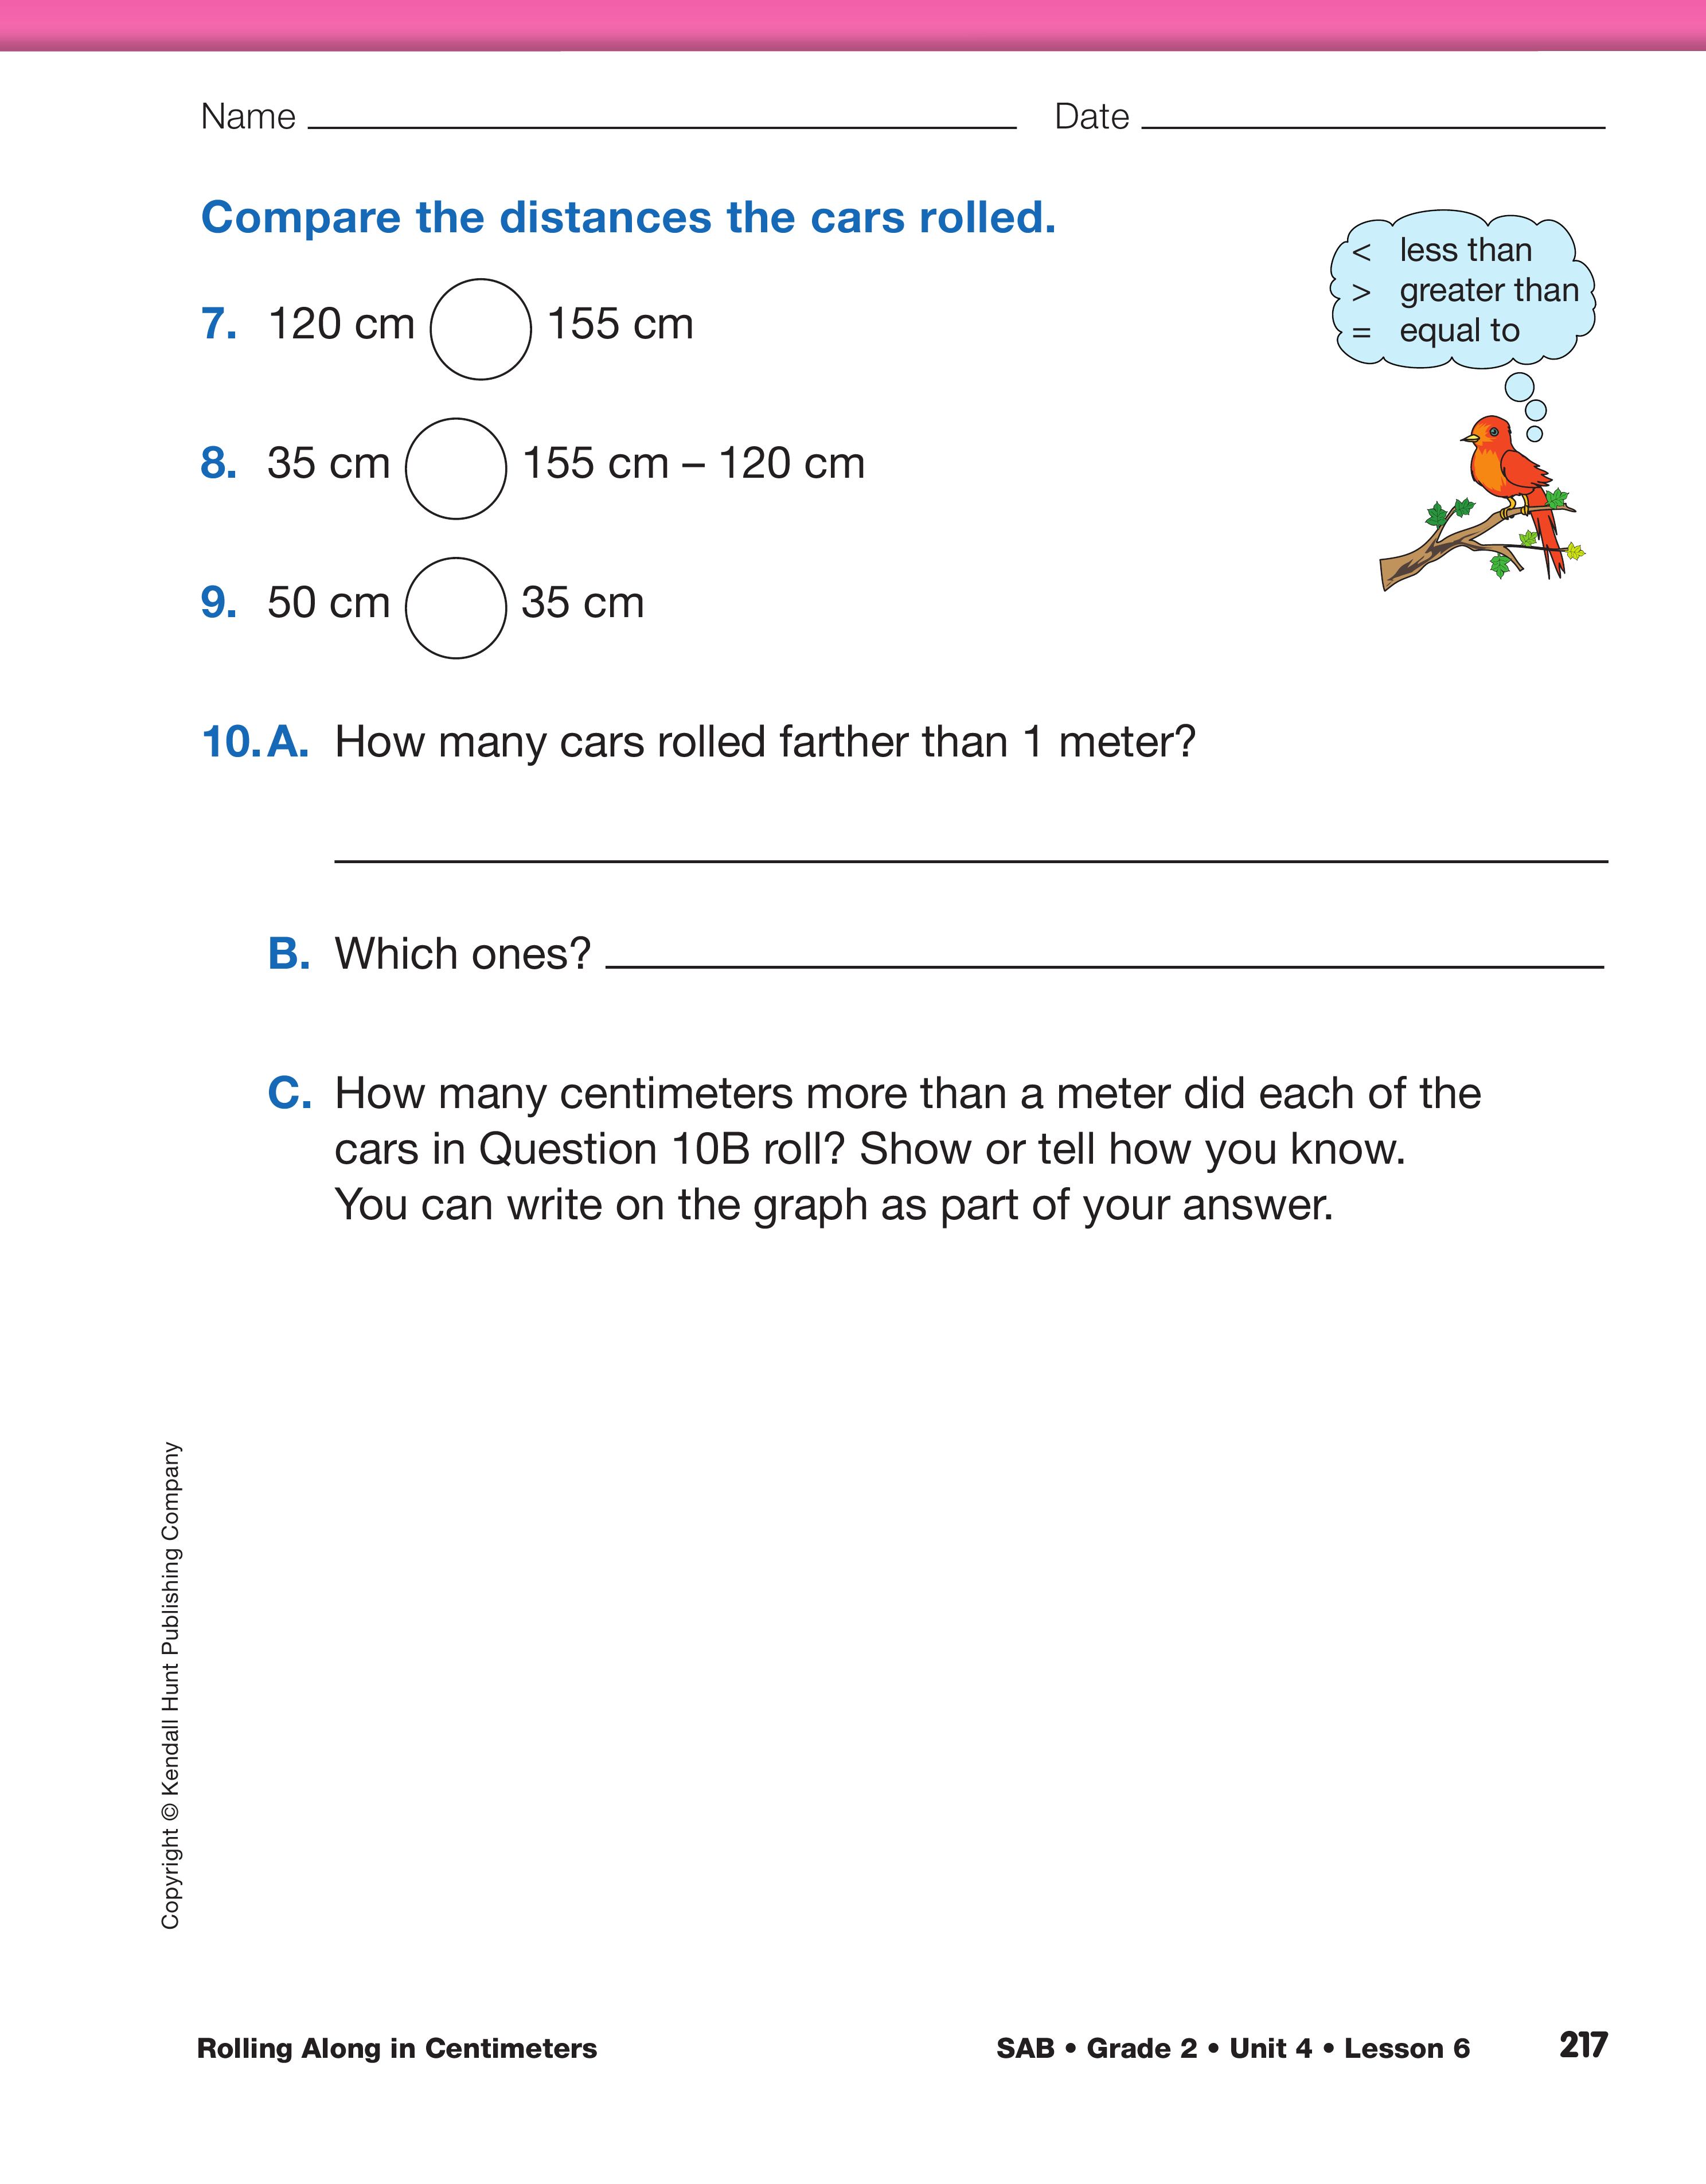
Explore the Data. When students are done graphing, have them complete Questions 7–10 in the Explore section of the Rolling Along in Centimeters pages in the Student Activity Book with a partner. Answers for Questions 7A–C will vary with each group's data; however, have students share strategies for solving Question 7C. Discuss solutions and strategies for Questions 8–10, which have varied strategies for solving but result in specific solutions.
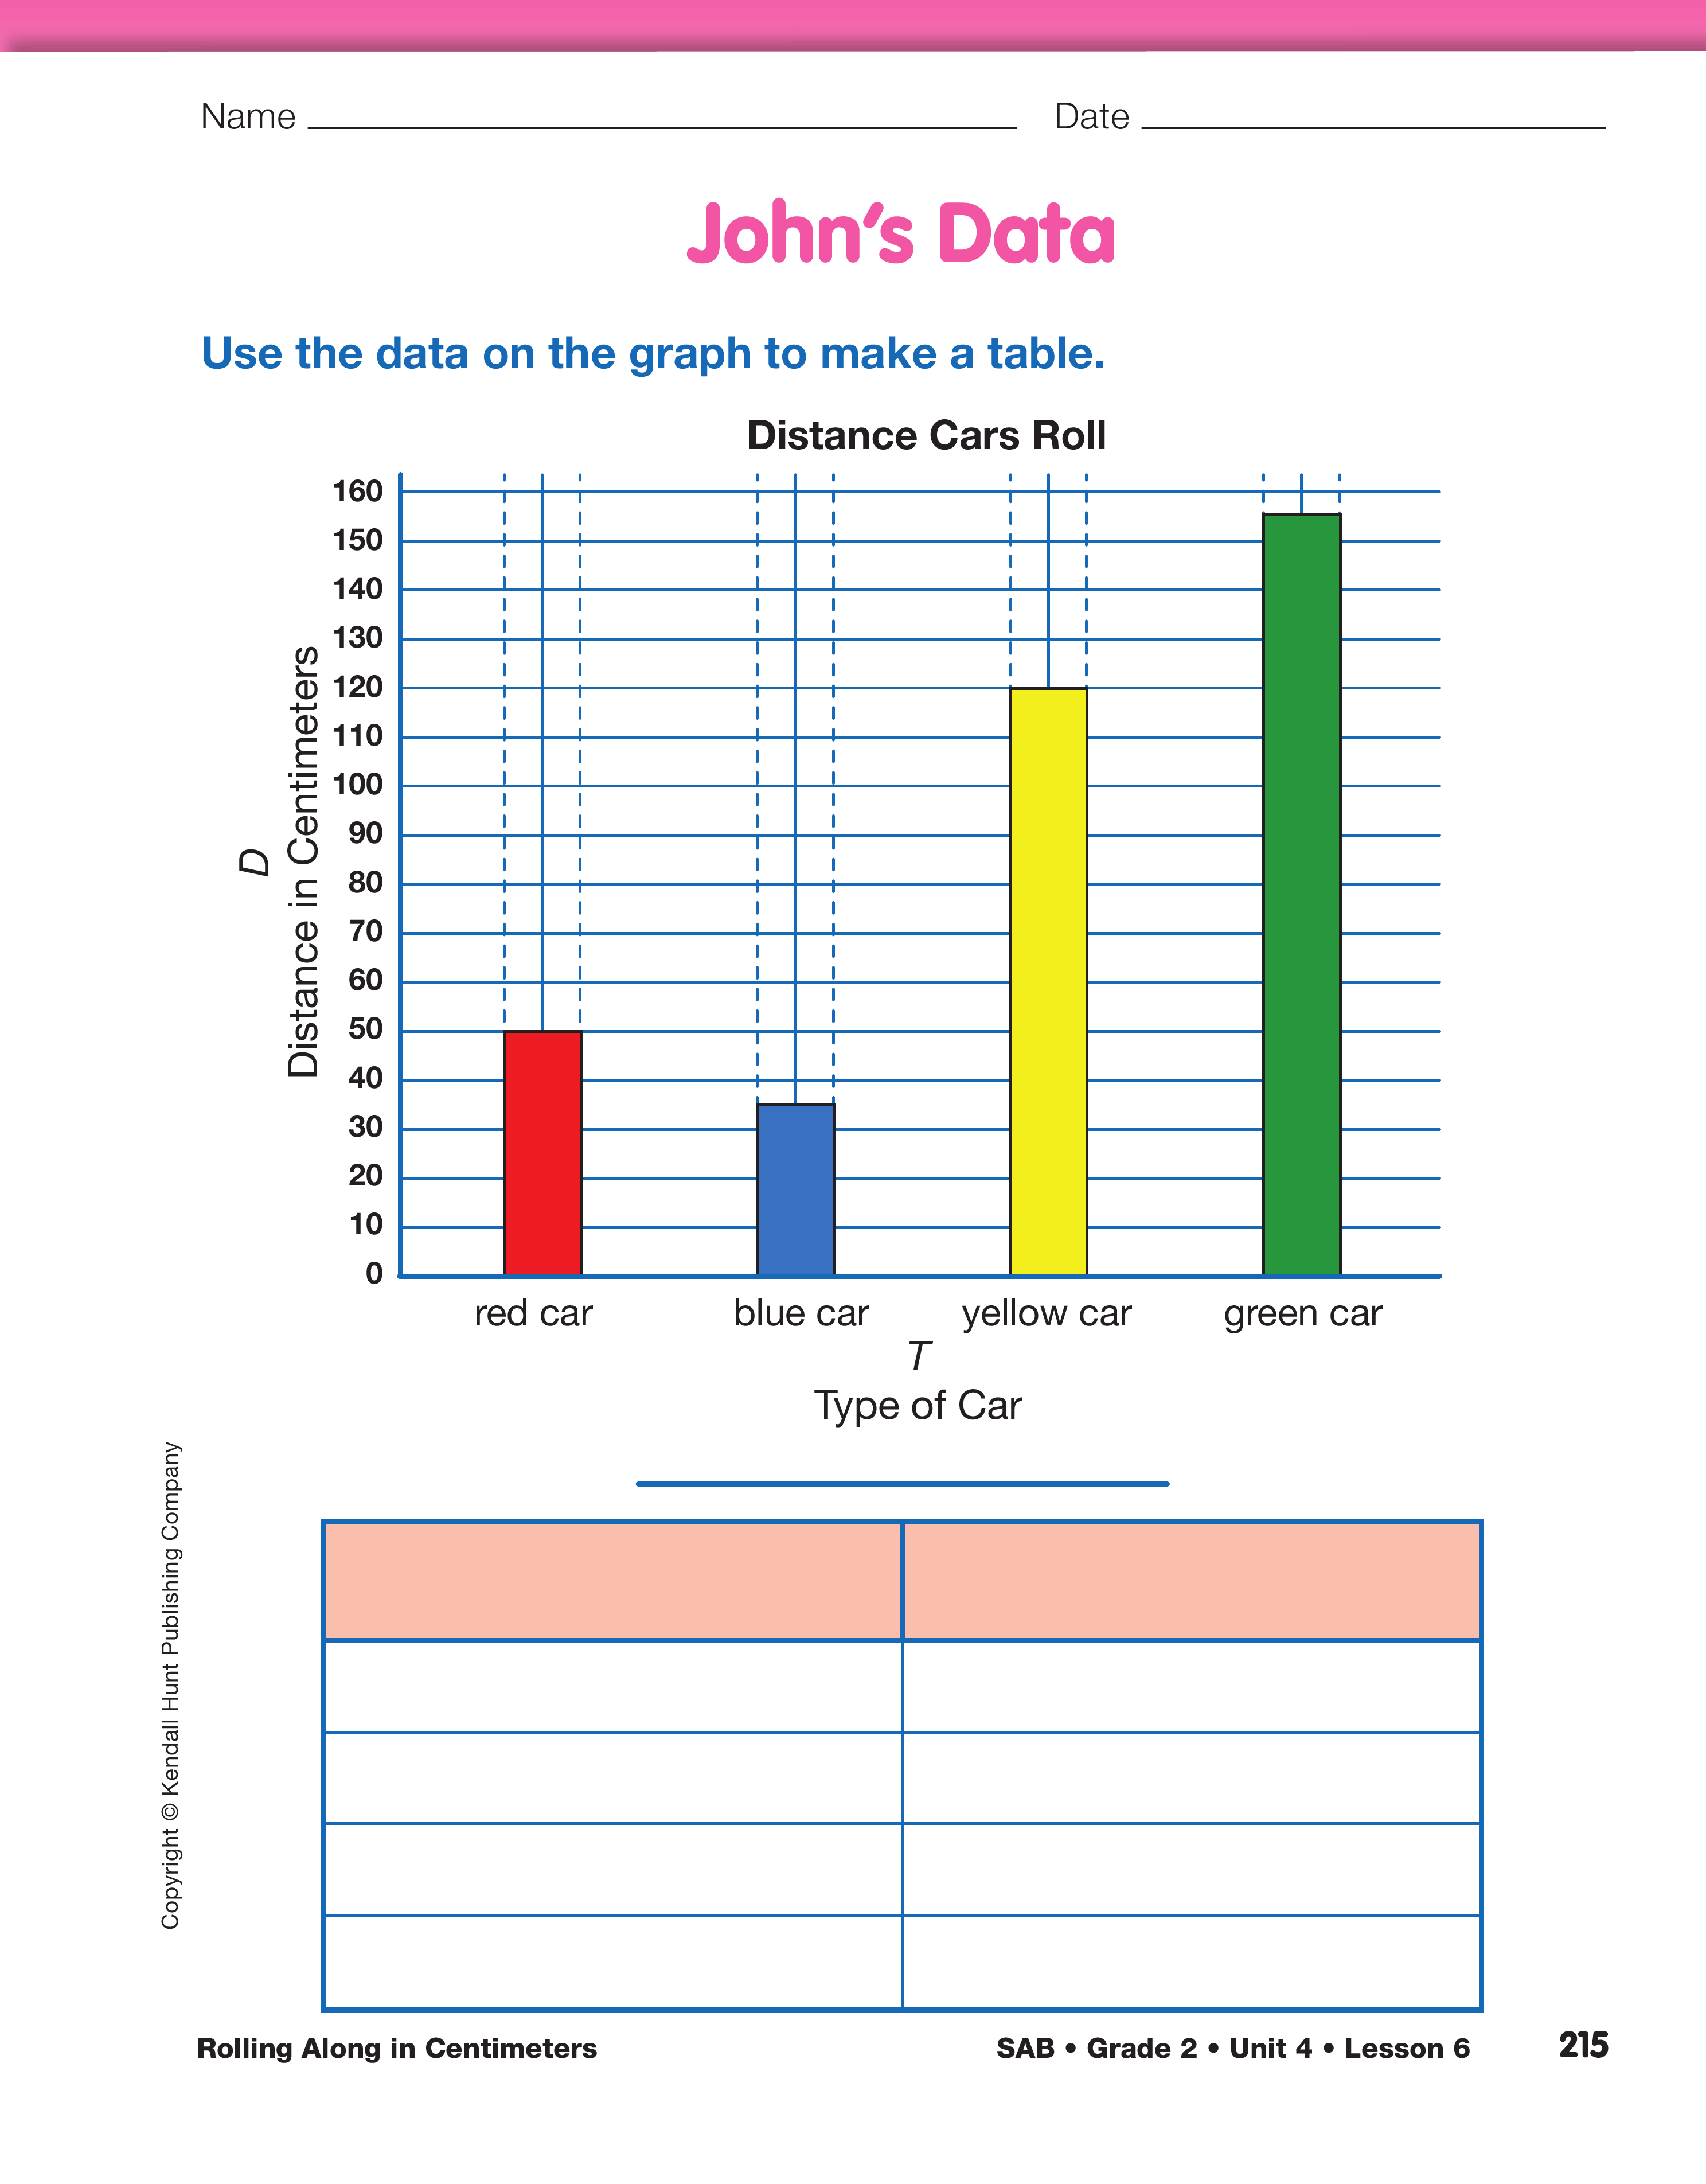
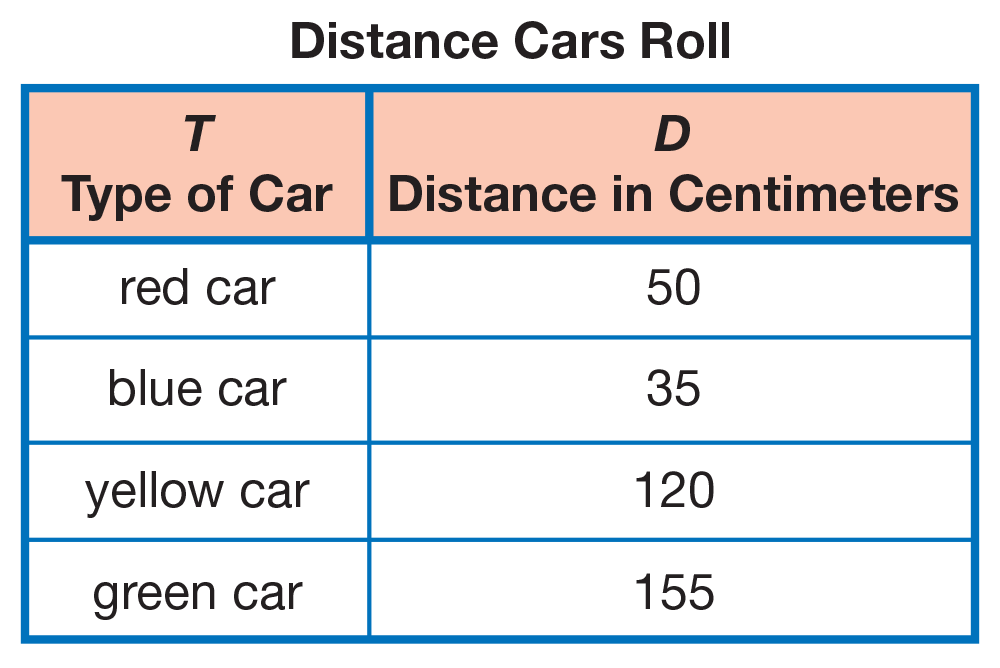
Use Data to Solve Problems. Show a display of the first page of the John's Data pages in the Student Activity Book and ask students to compare the graph to the data table under it. Tell students John lost his data table and that they are going to create a new one. Have students discuss with a neighbor what labels they should write for the two columns and what data needs to be filled in. Conduct a discussion with the class demonstrating completion of the data table. See Figure 9. Have students compare how the same information can be shown in a table or a graph and how it is possible to go from one to the other.
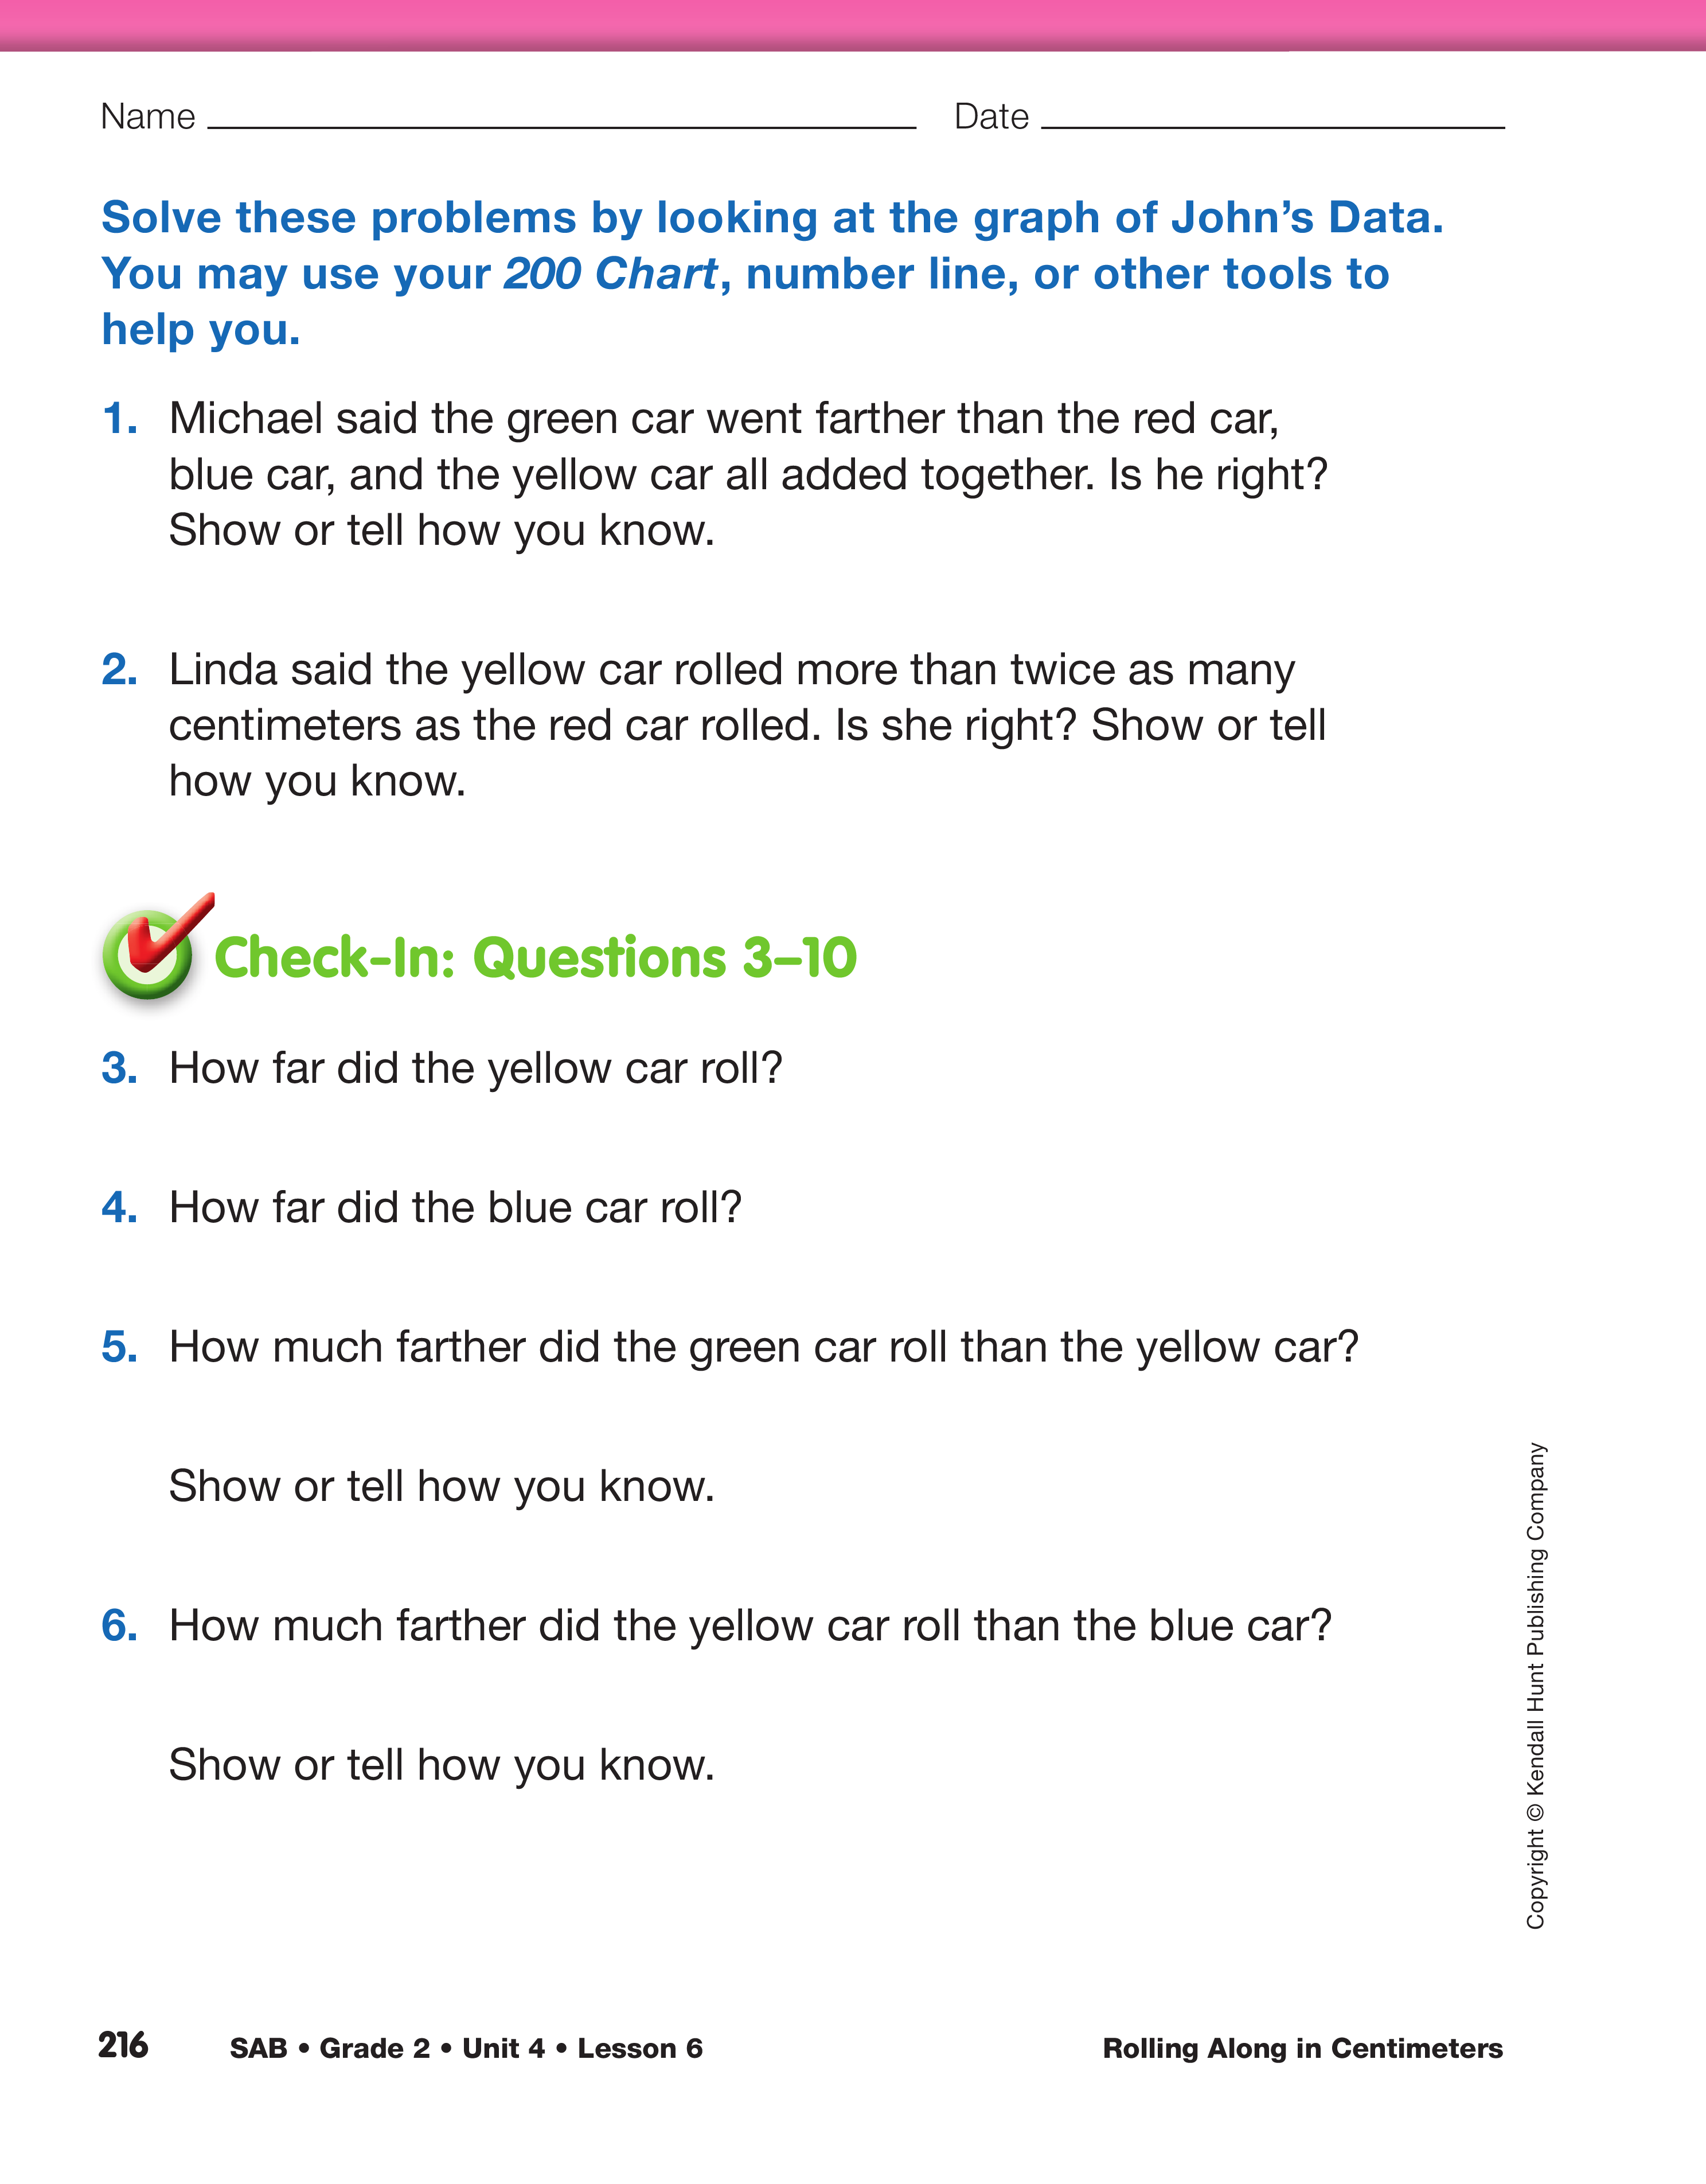
Allow time for students to work with a partner on Questions 1–2, which involve computation with more than one step and may present a challenge, then discuss the solution strategies as a class. As students are working together, circulate about the room observing their work. See Meeting Individual Needs for ways to support individual students with these two questions.

Use Math Practices. Next display and direct students' attention to the Math Practices page from the Student Activity Book Reference section and refer students to Math Practice 2, Find a strategy; Math Practice 5, Show my work; and Math Practice 6, Use labels.
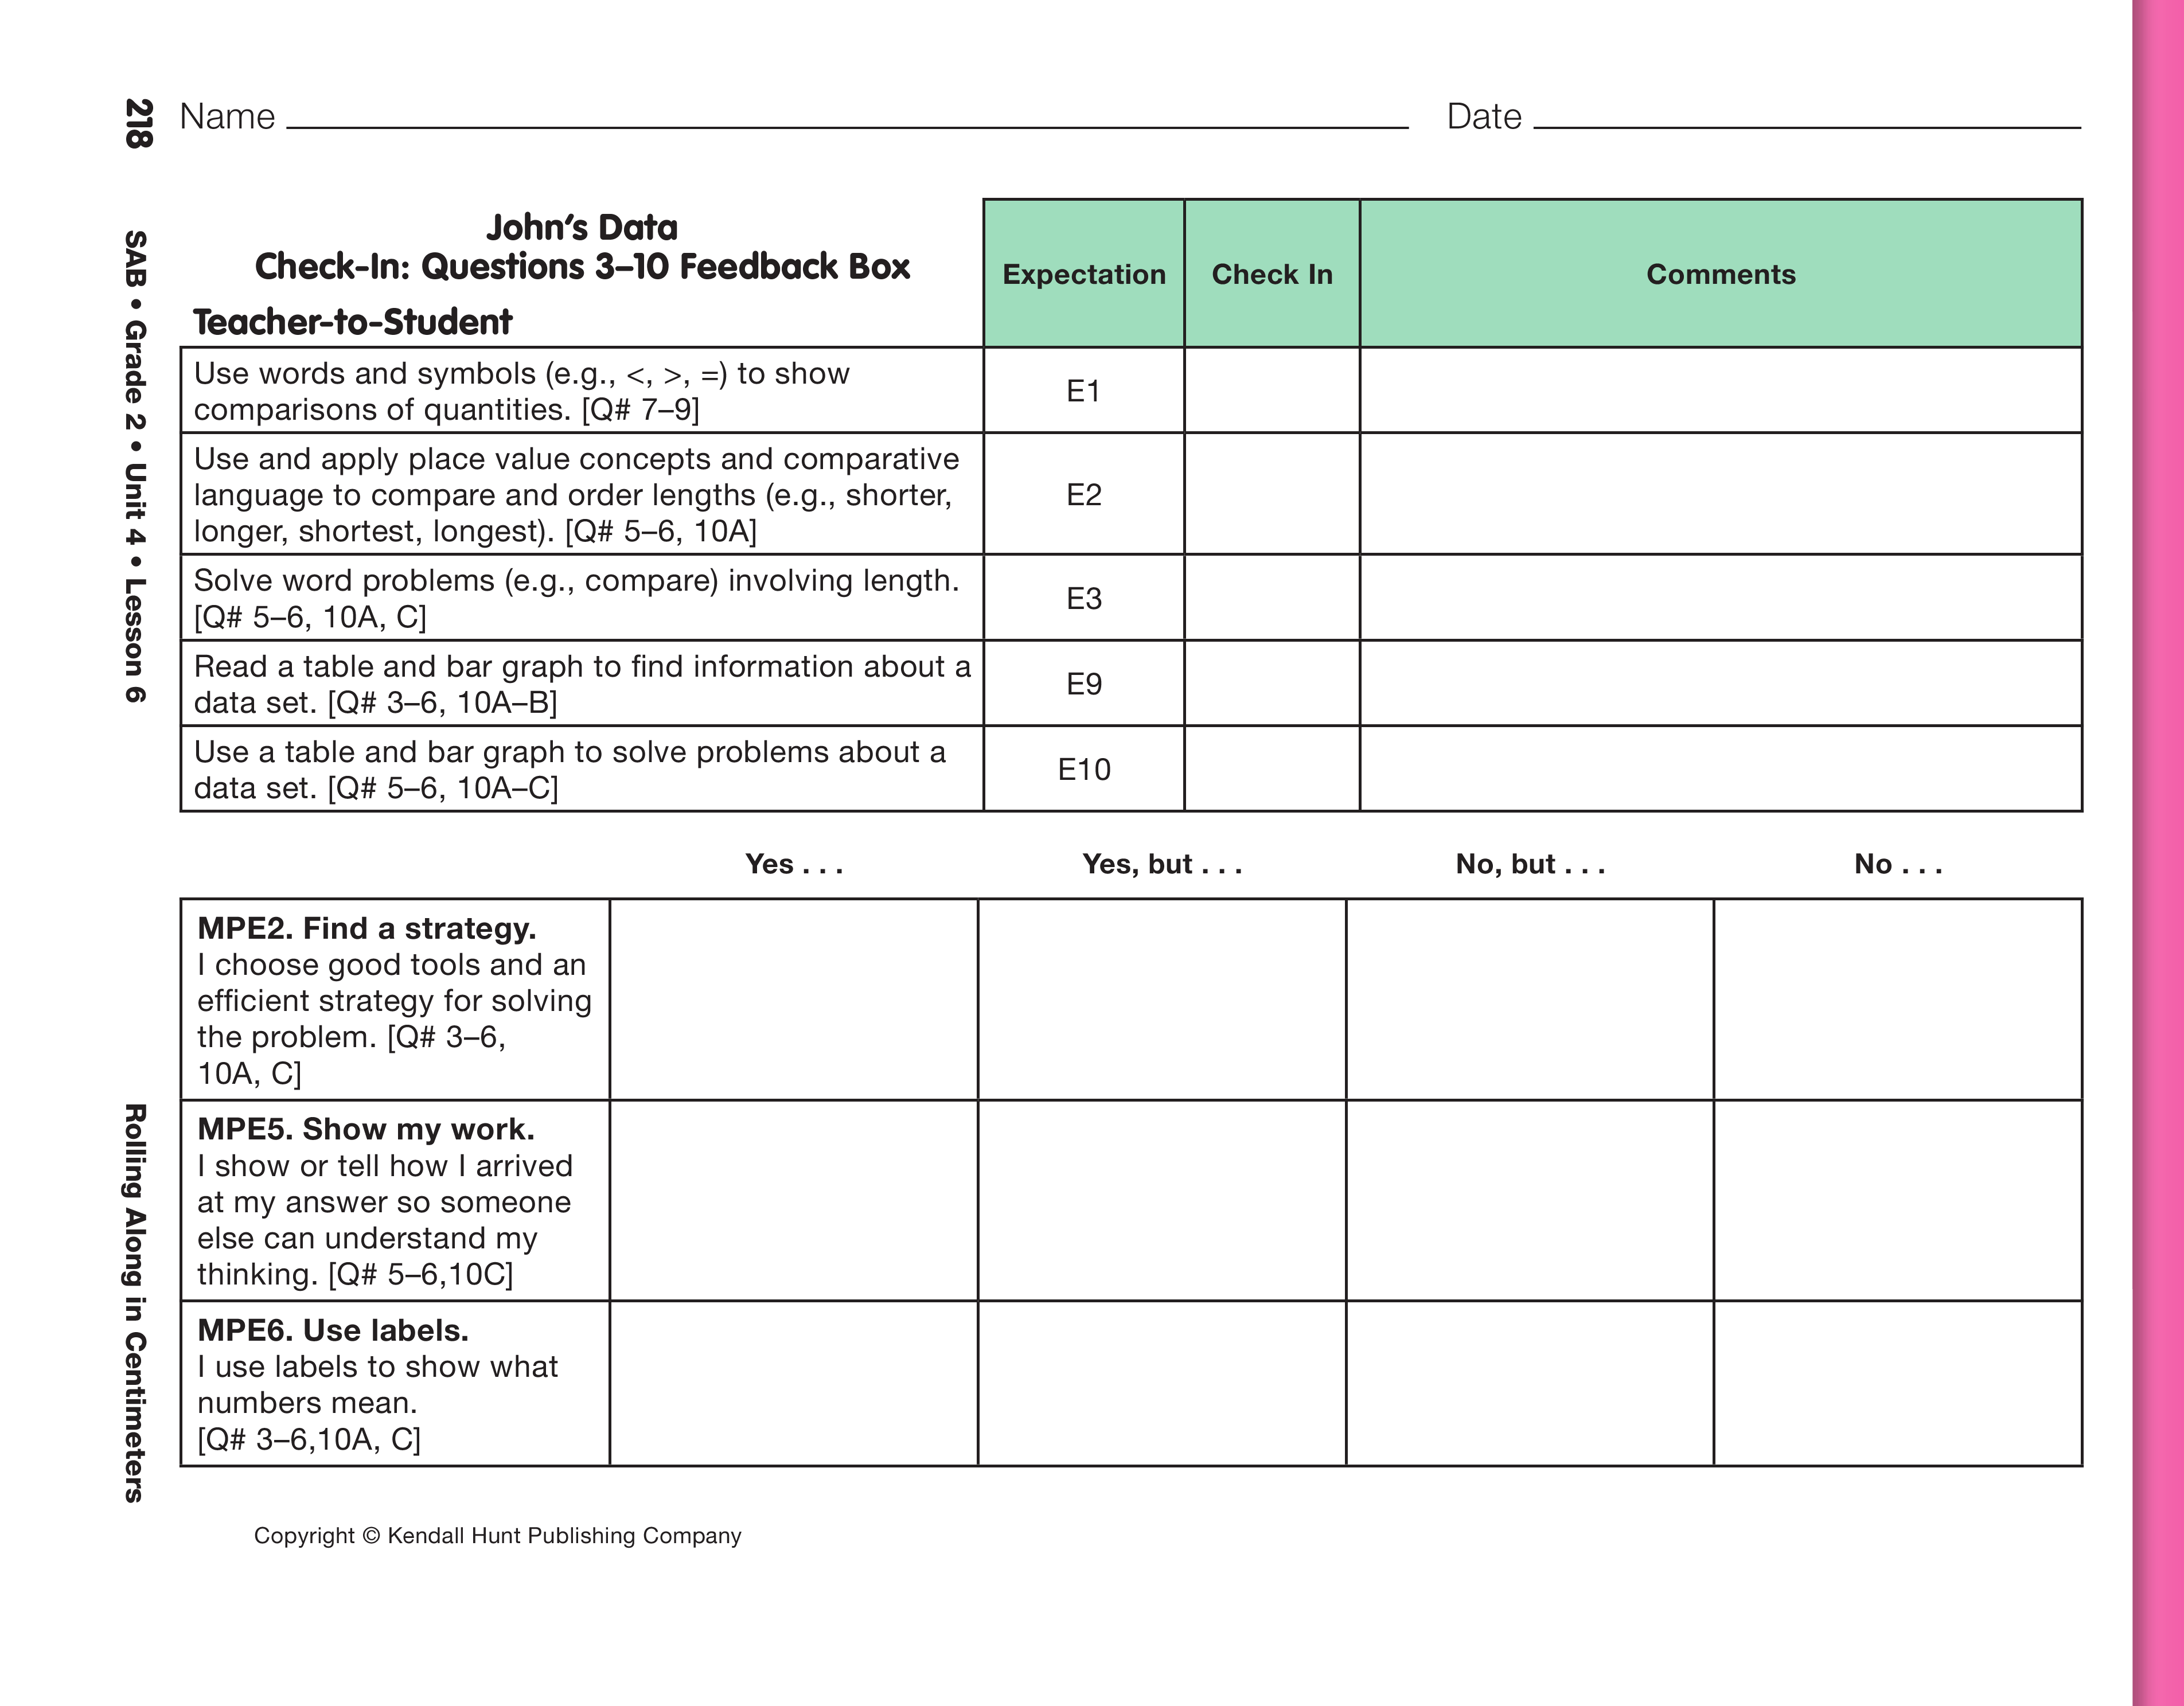
Direct students' attention to Check-In: Questions 3–10 on the John's Data pages in the Student Activity Book. Tell students they will answer questions independently then review a partner's work for Question 10 using a Student-to-Student Feedback Box.
Ask:
Provide time for students to complete Check-In: Questions 3–10 independently. Students may use their 200 Charts to help them solve the problems. As students work on the page, circulate about the room and engage them in conversation about their work. Questions 3–4 ask for information that students already have determined and written in John's data table. Questions 5–6 are straightforward questions that involve reading the graph and doing a one-step computation. Questions 7–9 involve making comparisons using symbols. As you circulate, ask students to show you how they use the graph and 200 Chart to solve the problems. Have metersticks readily available to use as number lines or as a reference for how many centimeters are in a meter.
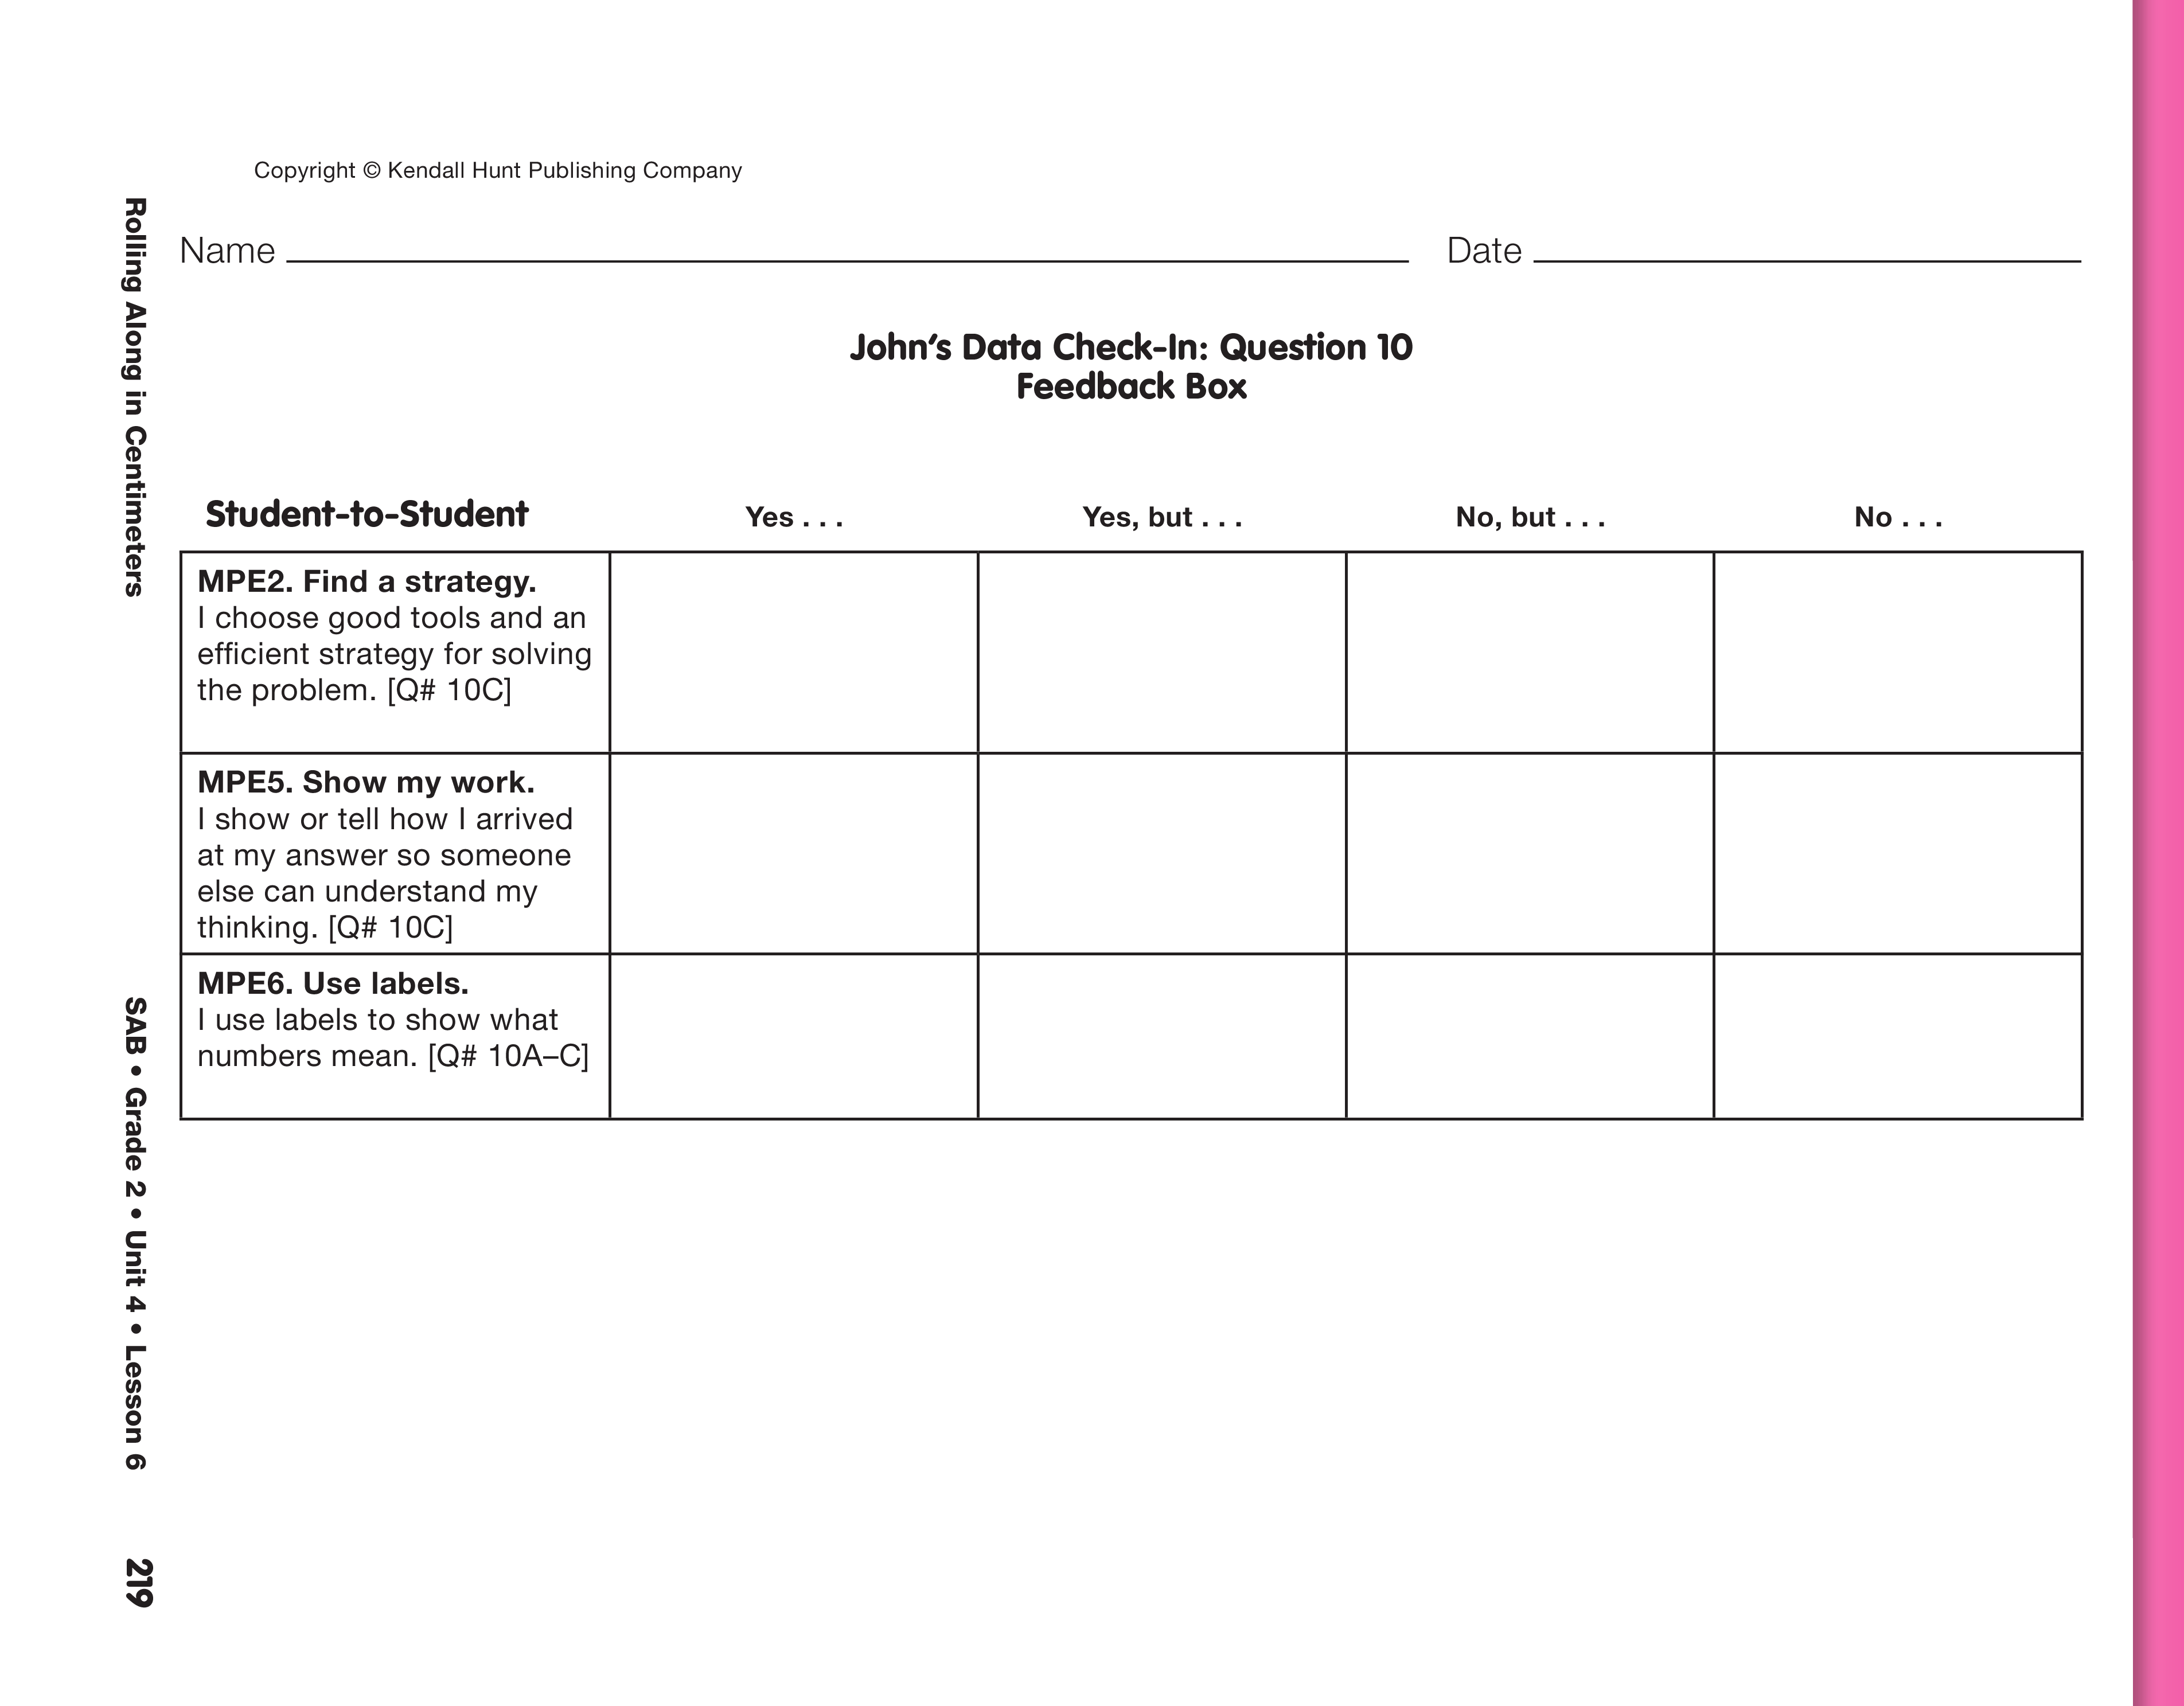
Review Partner's Work with Student-to-Student Feedback Box. When students complete Check-In: Questions 3–10, have them exchange papers and review a partner's work on Question 10 using the Student-to-Student Feedback Box on the John's Data Check-In: Question 10 Feedback Box page. Allow students to revise their work after discussing feedback with their partner. A Teacher-to-Student Feedback Box has been provided for your use after revisions are complete.

Assign the Make It True Homework Master. To be sure students understand the directions, ask them to complete the first problem in class as an example.