Lesson 6

Rolling Along in Centimeters

Est. Class Sessions: 3–4

Developing the Lesson

Part 4: Graphing the Data

Find and Record the Median. After data collection is complete, engage students in a discussion about why a median value is used.

  • I see that many of your data tables show that the cars did not roll the same distance for each of the three rolls. Why do you think this happens? (Answers will vary. Allow students to speculate.)

Explain that many things can affect the distance the cars roll and this normal variation is expected. Help students understand that scientists address this by making multiple trials and then determining the representative, or average, values for the data.

  • If scientists and engineers were testing the cars, they would roll each car more than one time. They would conduct several trials as we did. Why do you think it is a good idea to try the cars more than once? (Possible response: The scientists want to be sure they don't make any mistakes.)
  • Rather than using measurements from all three trials scientists use a single value called the median to represent all three trials. Why do you think scientists use just one measurement? (Possible response: Maybe there's too many numbers to keep track of. If they have so many cars and try each one many times, that's a lot!)
  • Scientists use the median, or middle distance, rather than the longest or shortest distance. Why would it be a good idea to use the median distance? (Possible response: You could get a really long roll or a really short one and the middle is best. It is more normal, not too long and not too short.)

Conclude that the middle value is a good representation of how far the car rolls since it is neither the shortest nor the longest distance.

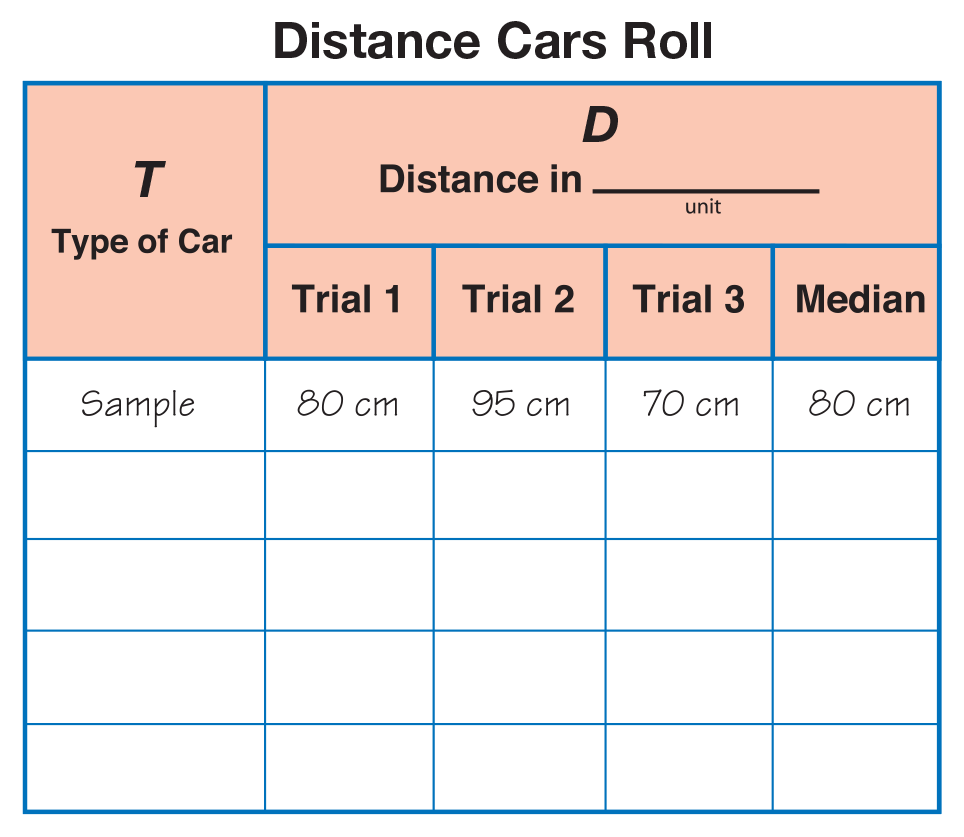
Introduce median using the sample data collected in Part 2 on the display of the data table. With the help of the students, order the measurements from smallest to largest. Ask students to determine the middle value. When arranged sequentially, the median is the middle measurement. Record the median in the appropriate column on the display. See Figure 6. Ask students to find the median for their own data. They might use a number line or cross out the high and low measurements.

The word median is a new mathematics word, but some children might know about the median strip on the highway, a stripe or barrier down the middle of the road.

The everyday meaning of "average" is slightly different from the mathematical meaning. In ordinary English, average usually means the add-up-all-the-numbers-and-divide average that we learned in school. Mathematicians call this number the "mean." Mathematicians also recognize other averages, or measures of central tendency. One type of average accessible to young students is the median, or middle value of a set of ordered values. Second-graders can understand the middle value in terms of being the "fairest" among several trials. Three trials were specifically used in this experiment because it makes finding the median easy.

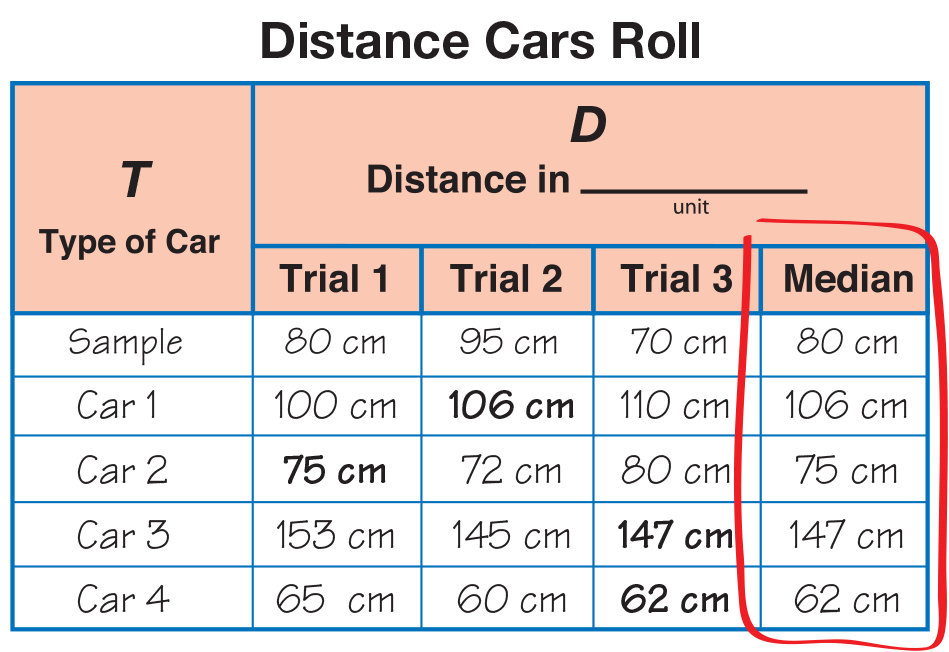
Check to see that students have not confused the median with Trial 2. Sometimes the median might occur in the second trial; however, this will not always be the case. If students have difficulty identifying the median, list some measurements in groups of three on the board. Use a number line or the 200 Chart to help students identify the median for each group of three. Have students draw a box around the median column on their data table with a crayon or colored pencil so they will not be confused about which measurement to graph. See Figure 7.

If using a number line or 200 Chart to order the measurements, circle the three measurements when placed on the line or chart. Ask which of the three numbers is in the middle.

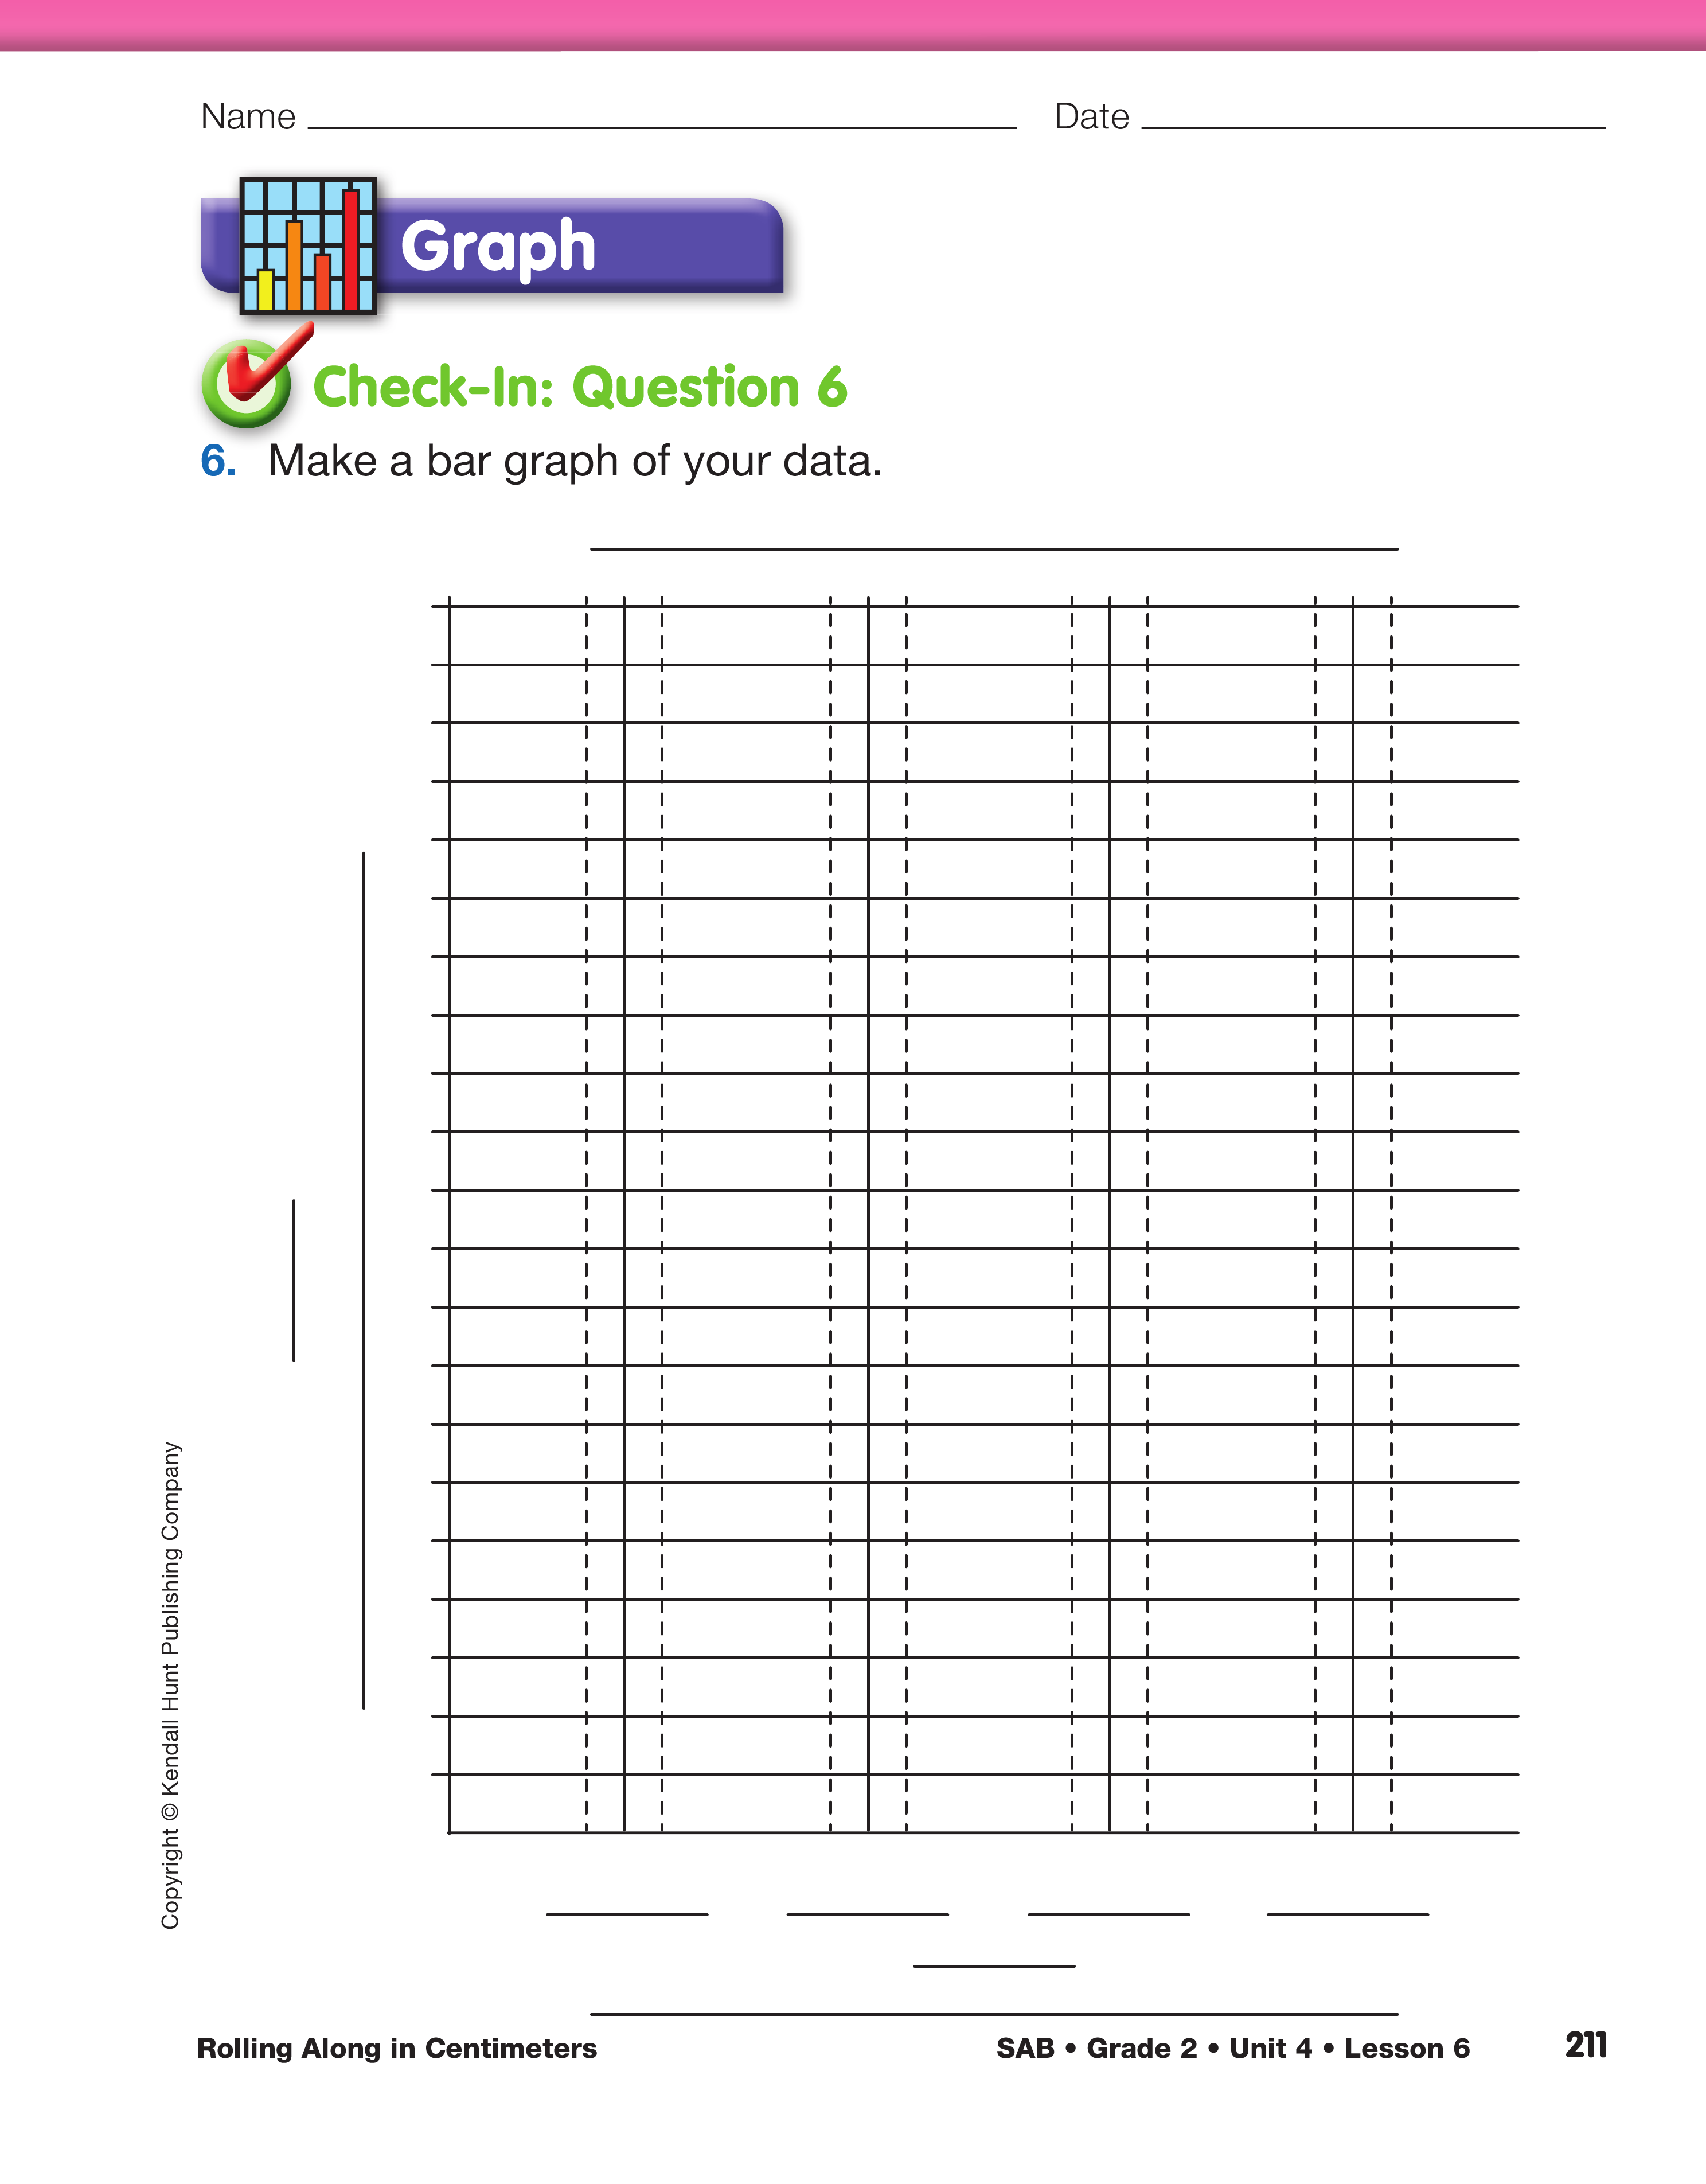
Graph the Median. Have students compare their completed data tables to a display of the empty graph in Question 6 of the Student Activity Book. Discussion should include:

  • a title and labels for each axis on the graph is needed;
  • values for each bar along the horizontal axis should be written (colors—red car, blue car, etc. or numbers—car #1, car #2, etc.);
  • deciding with students how to number the vertical axis (by fives or tens depending on the distances their cars rolled);
  • demonstration of what to do if the distances fall between two numbers on the vertical axis.

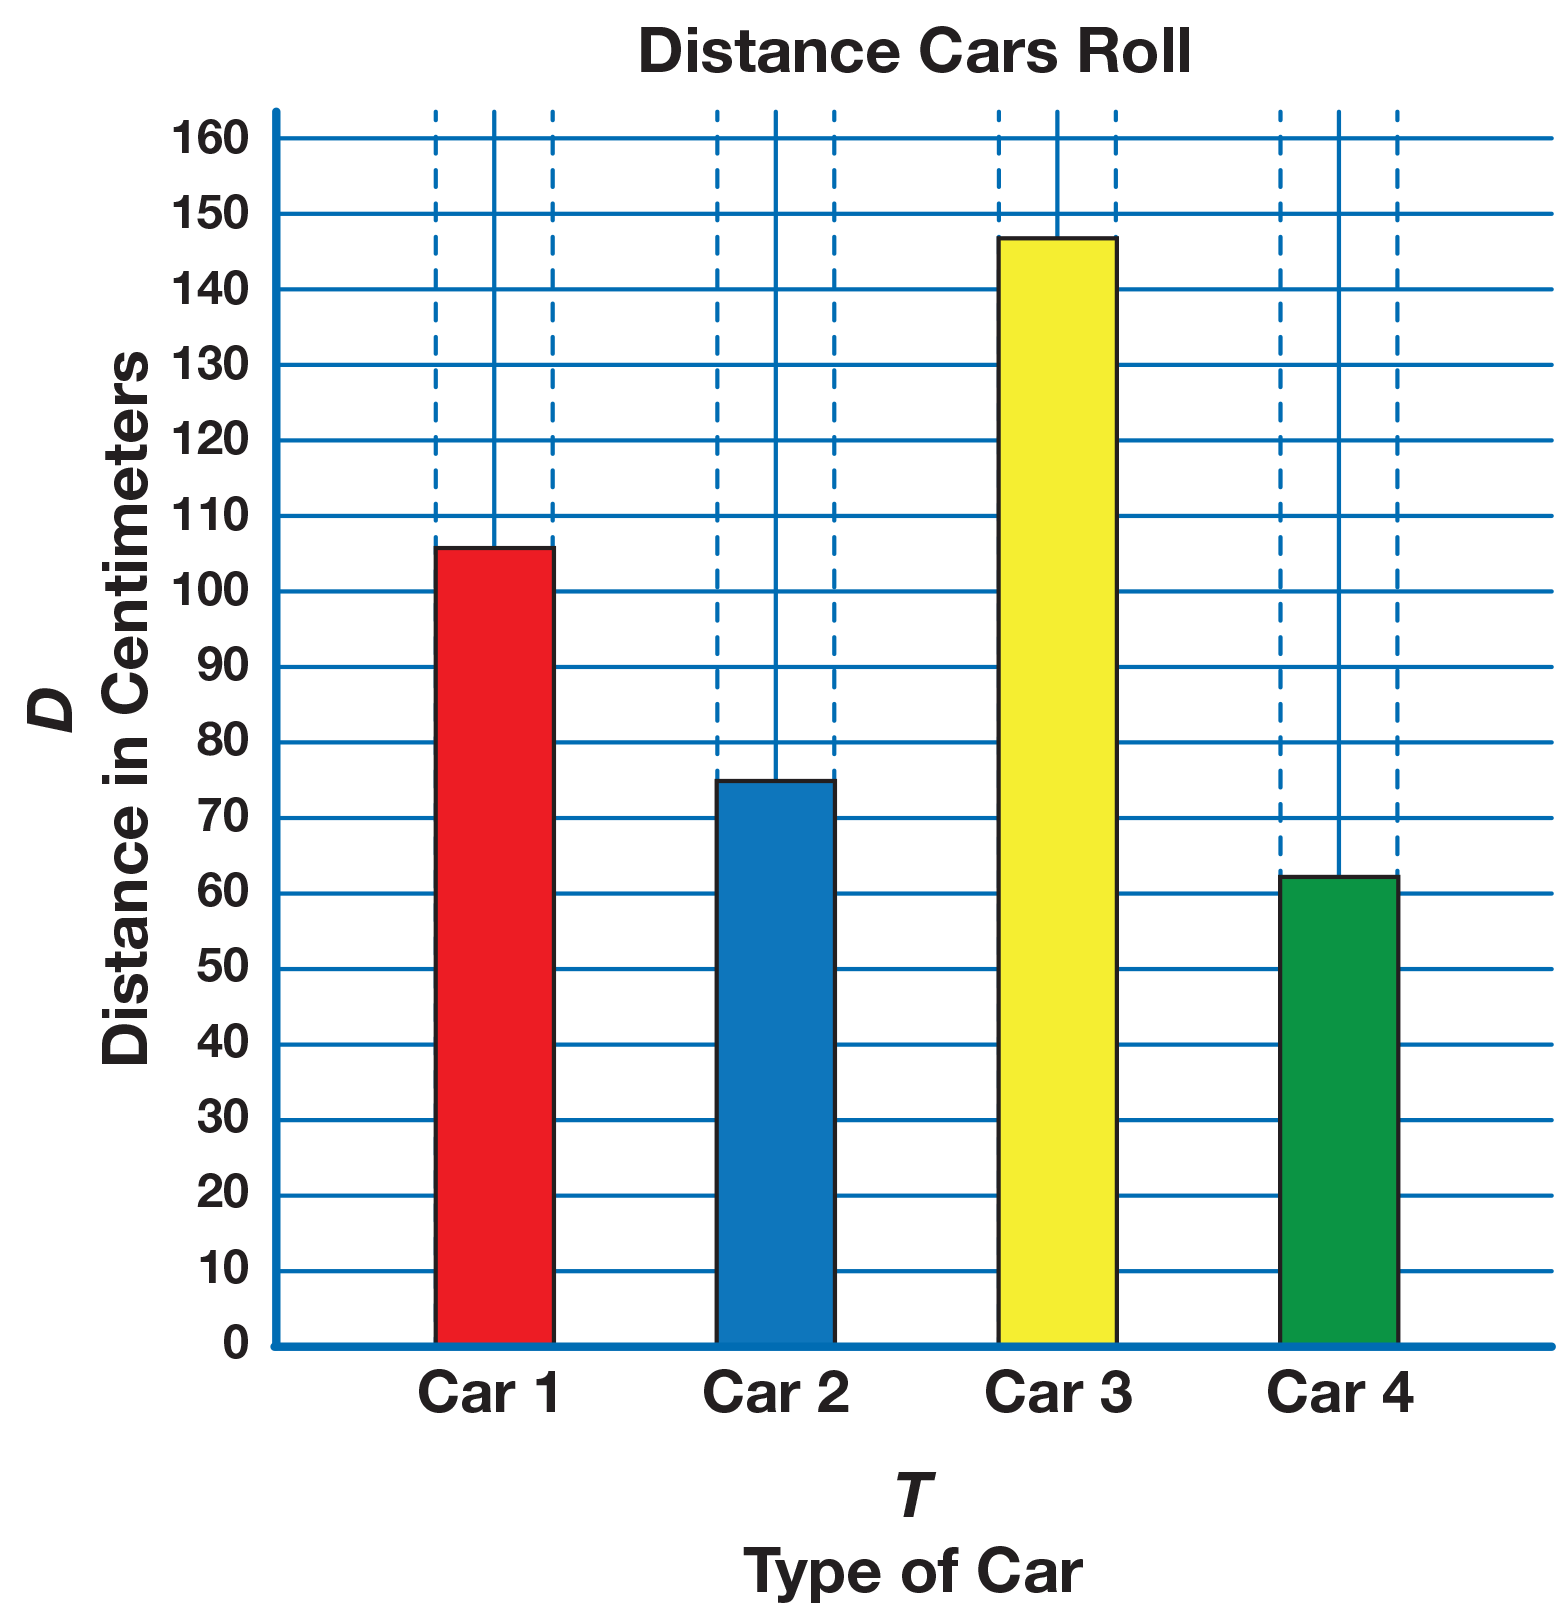
Have students work independently to complete their graphs then share their results with the class. See Figure 8.

If students need to review labeling a graph, ask a student volunteer to do his or her graph on a display prior to having students work individually.

Use Question 6 on the Rolling Along with Centimeters pages in the Student Activity Book to assess students' abilities to make bar graphs [E8]. Note whether students use appropriate labels in the correct places and scale bars to the correct height, including those that land between horizontal axes.

X
SG_Mini
+
Recording the median distance rolled
X
+
Sample data table
X
+
Sample Graph
X
+