


Measuring Volume
Est. Class Sessions: 3–4Developing the Lesson
Part 2: Measure Volume
Draw a Picture. Briefly summarize the procedure students will use to measure the volume:
- Fill a graduated cylinder to a water level of 80 cc.
- Place an object in the graduated cylinder.
- Read the meniscus.
- Determine the volume of the object.
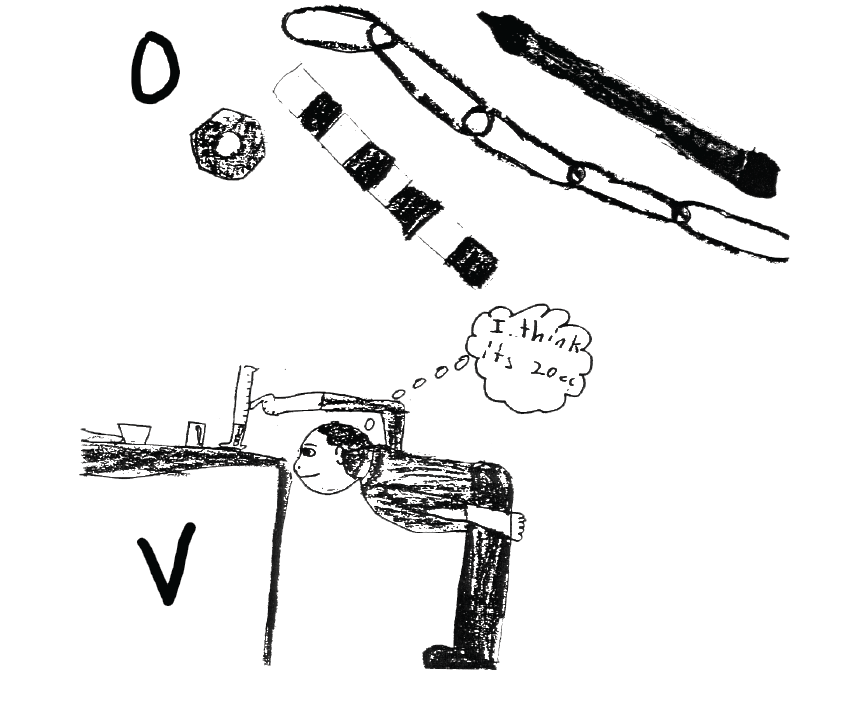
Display all the objects from a set of those you've gathered. Then instruct students to draw a picture communicating the important elements of the investigation on the Draw section of the Measuring Volume pages in the Student Activity Book. Students need to include the graduated cylinder, indicating measurements in "cc," as well as a labeled drawing of the objects they select for study. An example of a student's drawing is shown in Figure 2. Note that the student labeled the two main variables: O for Object and V for Volume.
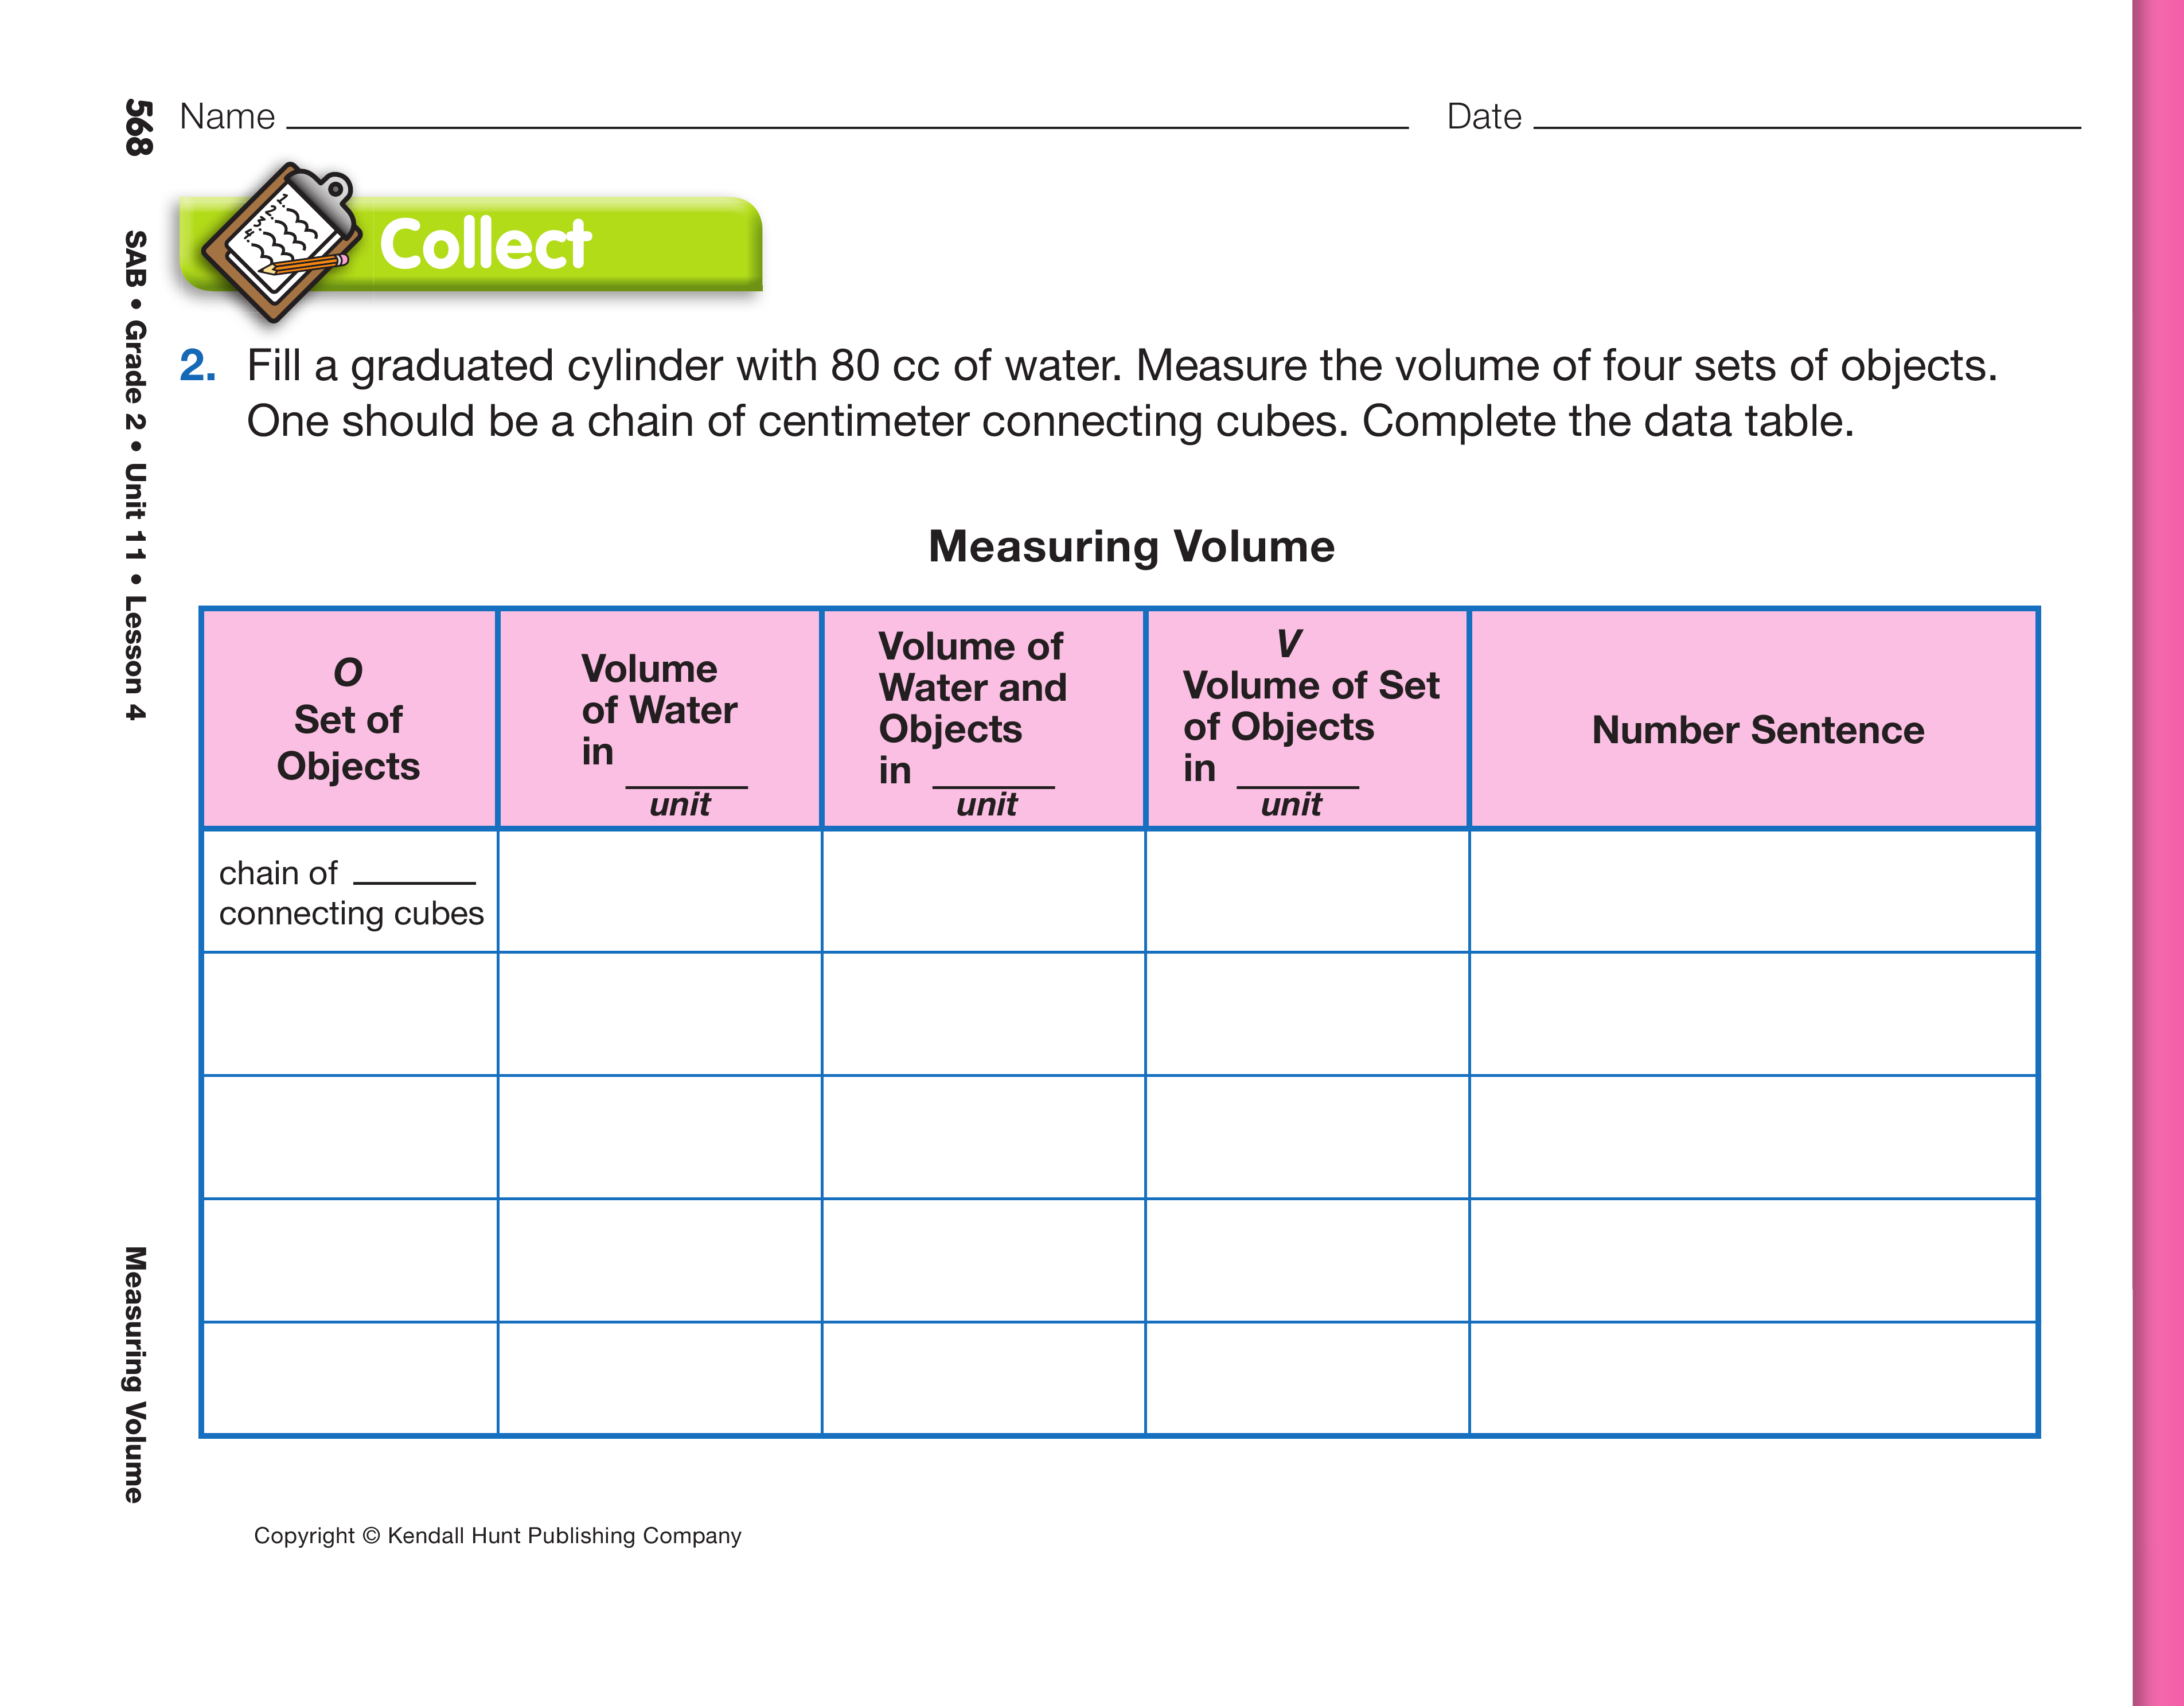
Collect the Data. After drawing the picture, student pairs are ready to begin the investigation. All students should measure a train of centimeter cubes because they can determine its volume before placing the object in the graduated cylinder. Use a display of the table in Question 2 and guide students to complete the data tables on their own pages.
Fill in information on the display where appropriate as you ask the following prompts:
Have students write "cc" for cubic centimeters on the appropriate lines in the top row of the data table:

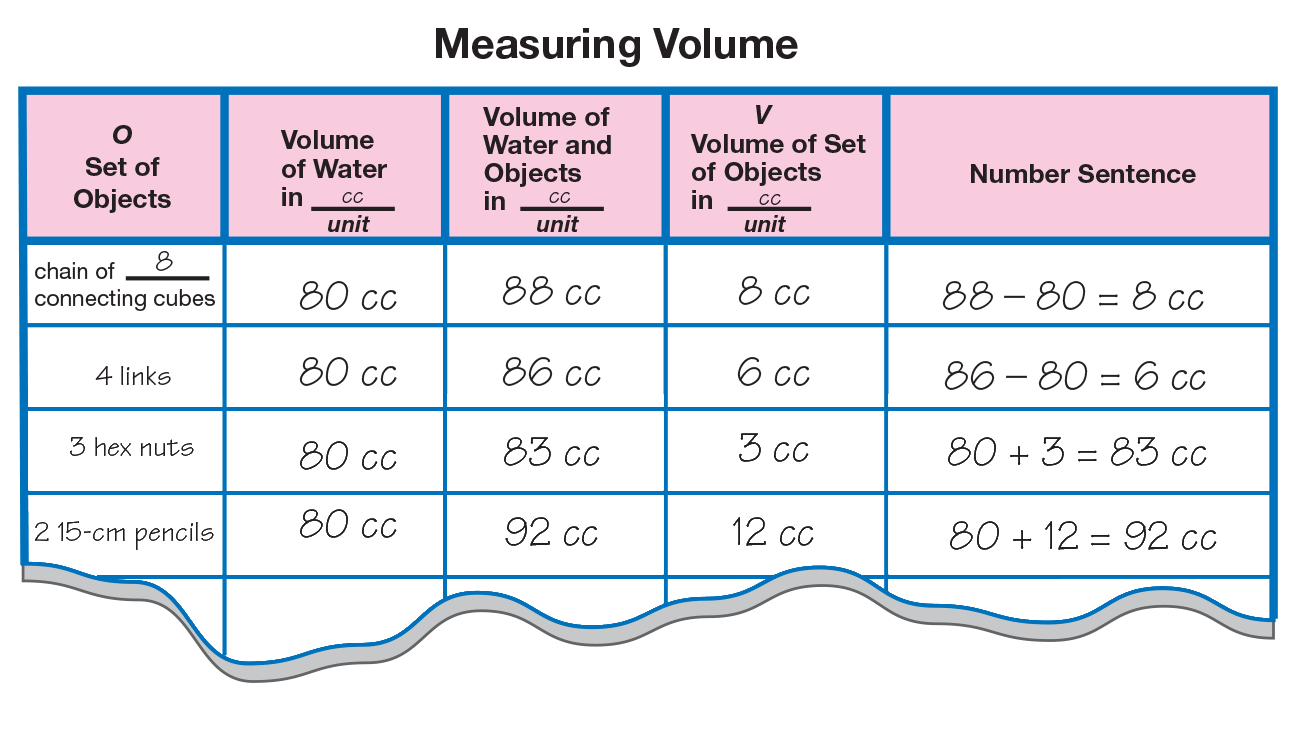
Next have student pairs measure the volume of the objects they chose and record their data in the Measuring Volume data table. Figure 3 shows a sample data table fully labeled and filled in with data. After students complete their data tables, check their work for accuracy by comparing values found by different pairs. Have several pairs explain how they found the volume of an object.
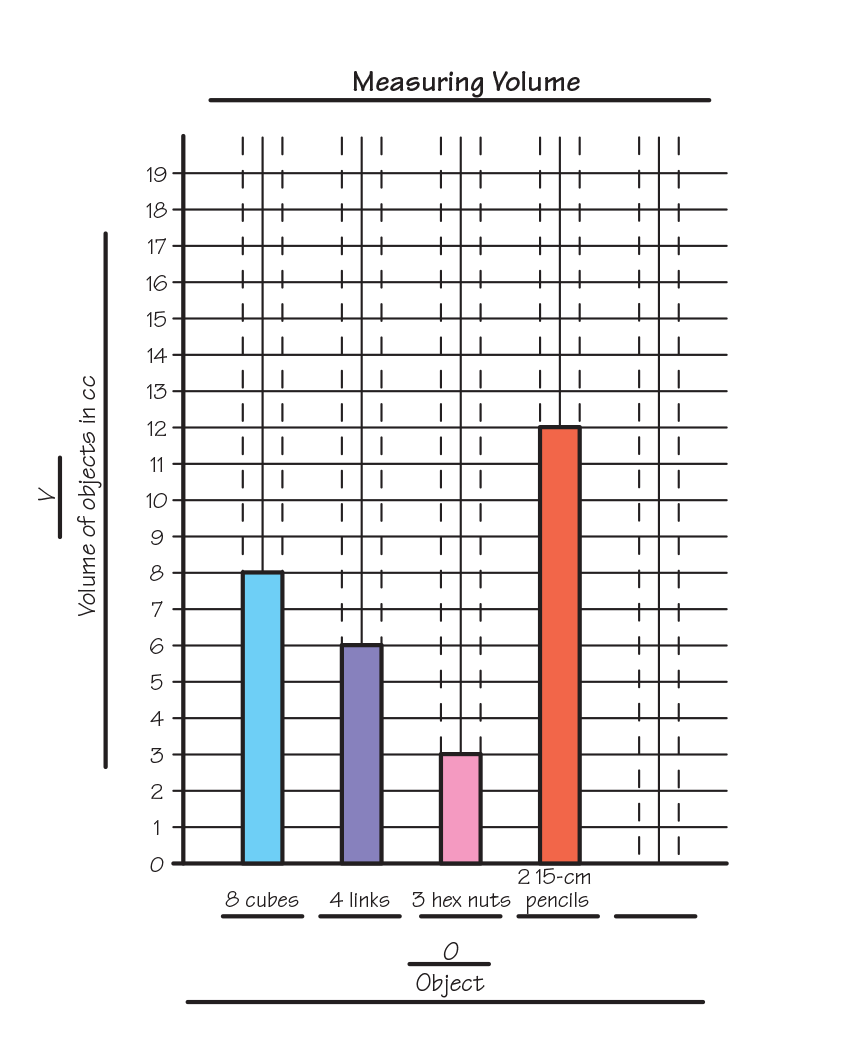
Graph the Data. Show the display of the Bar Graph Master as students refer to Question 3. Discuss what information from their data tables should be included on their graphs.
Ask questions similar to the following:
Students will need to decide how to scale the vertical axis. The scale will depend on the range of volumes found for the objects. Most likely they will scale the vertical axis by ones. Students can write the type of object or draw a picture of it in the appropriate spaces along the horizontal axis. Figure 4 shows a sample graph.