


Measuring Mass
Est. Class Sessions: 3Developing the Lesson
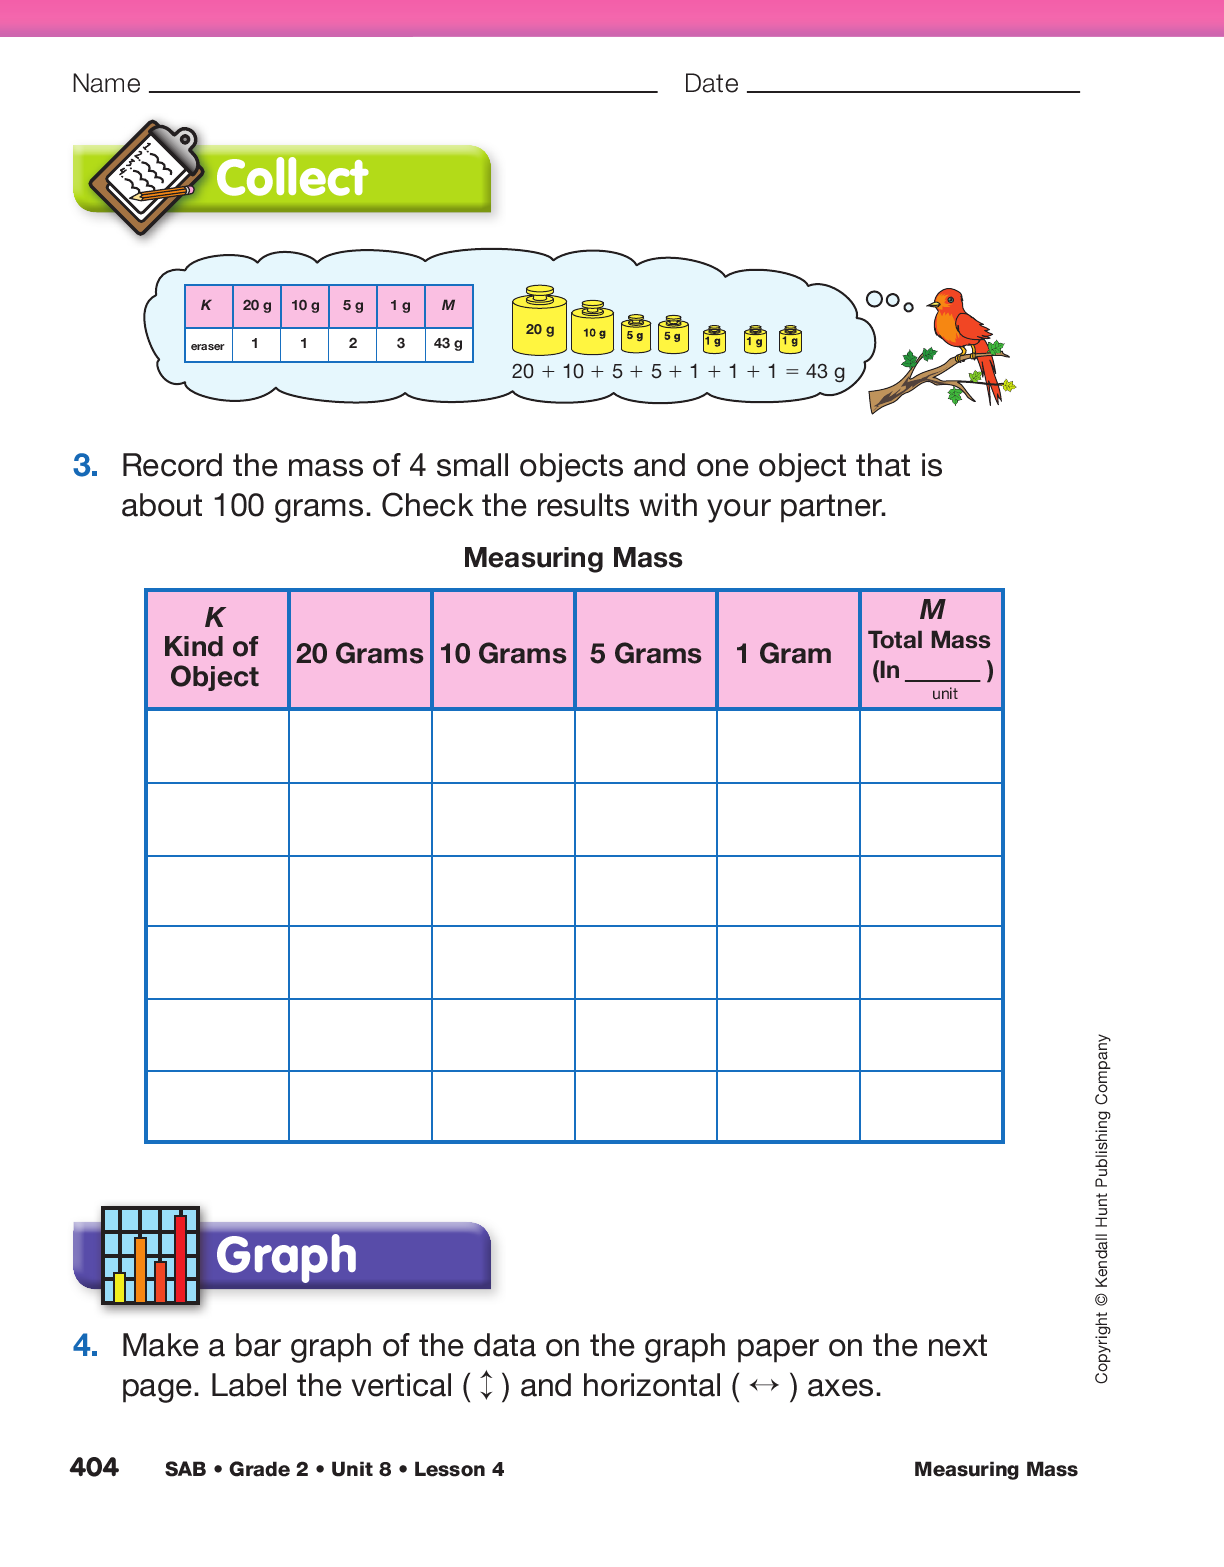
Part 2: Collect and Graph the Data
Demonstrate Adding the Gram Masses. Before students begin to collect data, have them check the two-pan balances to make sure they are still zeroed from previous lessons. Have students answer and then discuss Question 2 on the Measuring Mass pages.
Ask:
Instruct students if they are unclear about how to zero their balance.
Then display the data table on the Measuring Mass pages. Find the mass of two or three demonstration objects with the class. Discuss how to record the number of each of the standard masses used and the total mass of each object.
After balancing an object, display the gram masses and find the total mass with the class. For example, display one 20-gram, two 10-gram, one 5-gram, and three 1-gram masses. Have students share different ways of finding the total mass. Remind students to start by adding the largest gram masses first; for example, 20 + 10 + 10 + 5 + 1 + 1 + 1. Starting on 20, a student may count 30, 40, 45, 46, 47, 48. The 200 Chart or other tools may be helpful to students as they add up the masses.
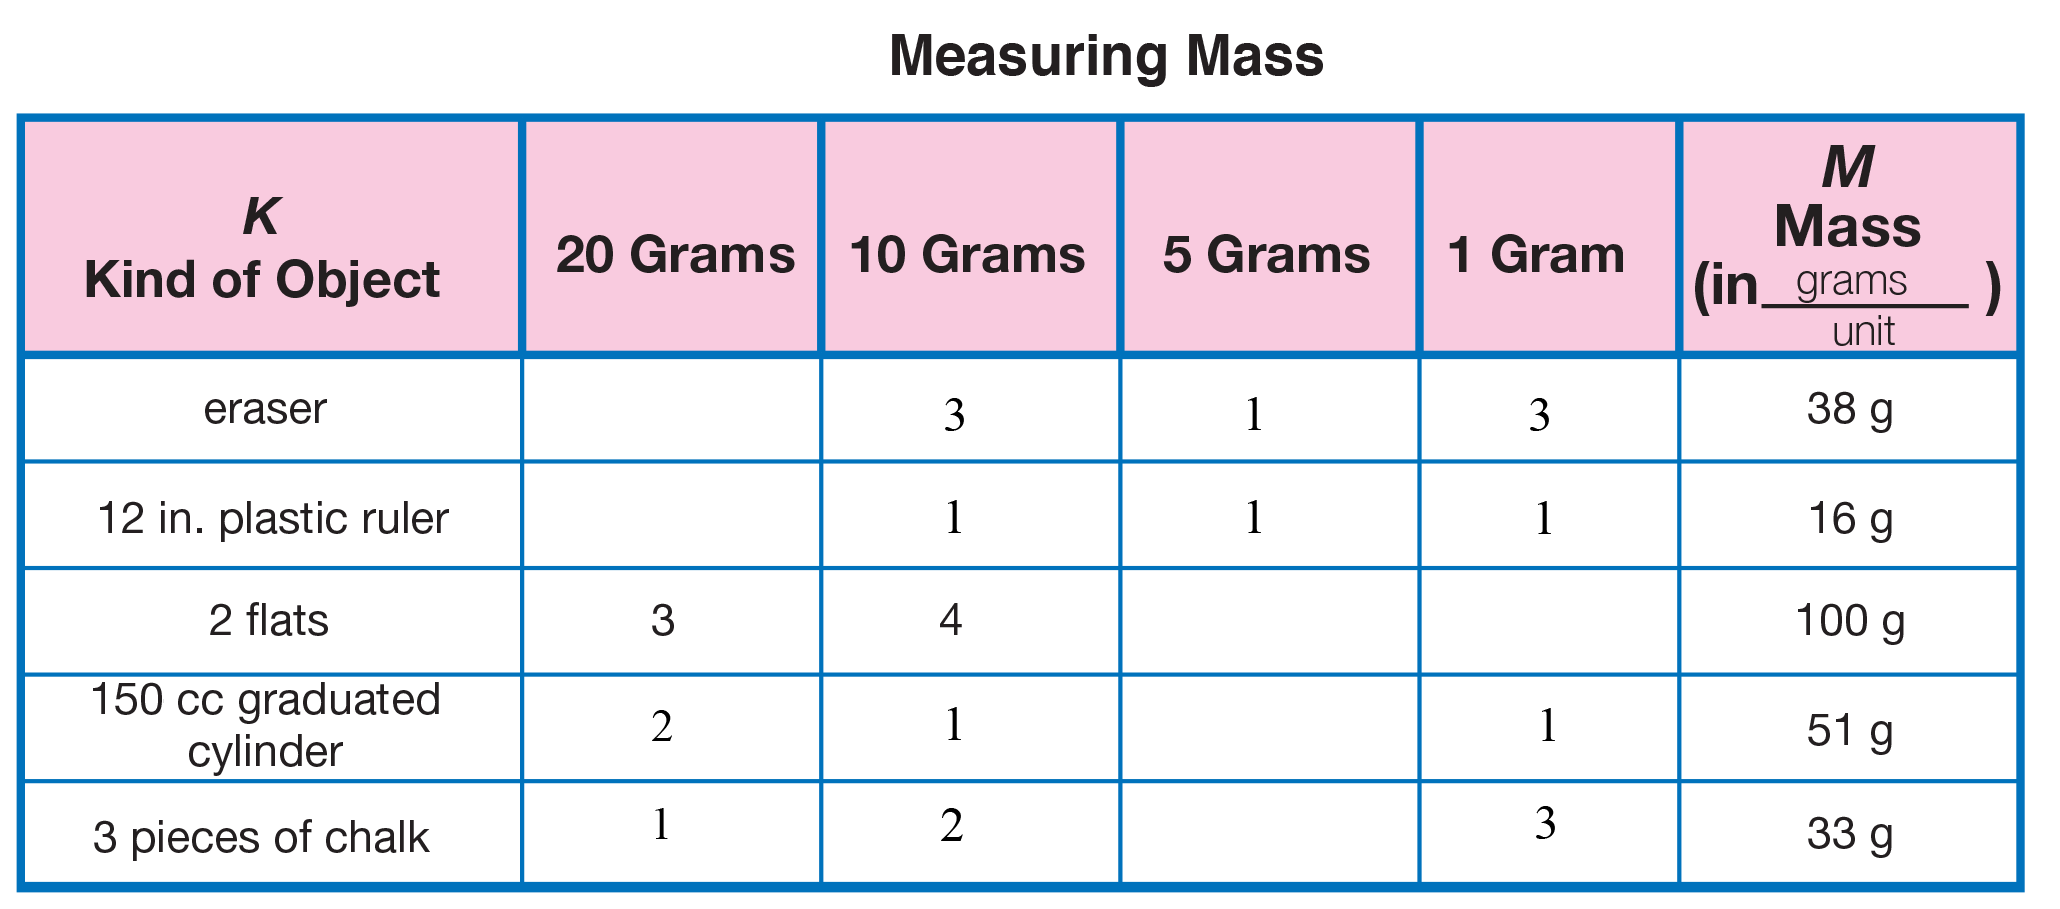
Choose and Mass Objects. Ask student pairs to choose at least five objects—one object from the group with the heavier objects (about 100 grams) and four objects from the group with the lighter objects (less than 100 grams). They can measure more than one of an identical object (e.g., 3 unused pieces of chalk) but should indicate this on the data table. Alternatively distribute items to be massed. Partners should find the mass of the same object, making sure the pans balance. Each student should independently count the masses and determine the total mass (M). Then, if there is a discrepancy, they can double-check their work and reach agreement on the mass of each object before recording it for Question 3 on the Measuring Mass Data Table. See Figure 4.
Assign Home Practice Parts 5–6 for homework. In addition, assign the Find a Pet Rock Homework Master. Students will need to find a rock that they estimate to be about 50 grams and bring it to school to participate in the Summarizing the Lesson activity. When giving the assignment, tell students that a base-ten flat is about 50 grams. Ask if they think a flat is heavy or light. Students may bring in more than one rock so that there are extras on hand.

Make a Bar Graph. After the data collection is complete, students are ready to make a graph. Using a display of the Measuring Mass Graph, have students discuss how the horizontal and vertical axes of their graphs should be labeled. See Figure 5.
Ask:
Graph the masses of the items that you measured earlier or simply several masses, similar to the data found in Figure 4. Include at least one number that is near 100 grams.
Assign Question 4 so that students can record their data on their Measuring Mass Graph in the Measuring Mass pages.