Introduce the First Names Investigation. The First Names pages in the Student Guide provide the setting for this investigation: finding the most common numbers of letters in students' names in order to write a letter to a computer game company.
This investigation can also be introduced by reading the book Tikki Tikki Tembo by Arlene Mosel, the story of a Chinese boy who has a very long name that causes several misadventures.
To start the discussion, ask:
- What data would help us decide how many letters the game company should allow children to type when they enter their first names? (the number of letters in students' first names)
The answers to the following discussion questions are based on the table on the First Names page in the Student Guide.
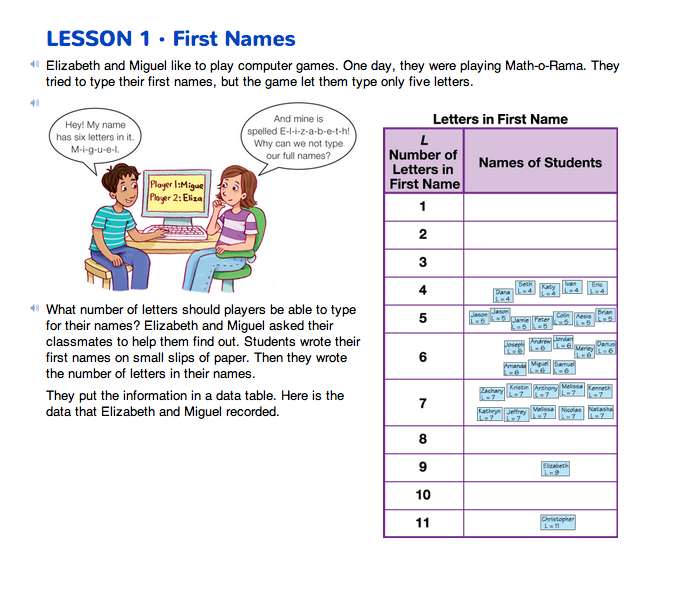
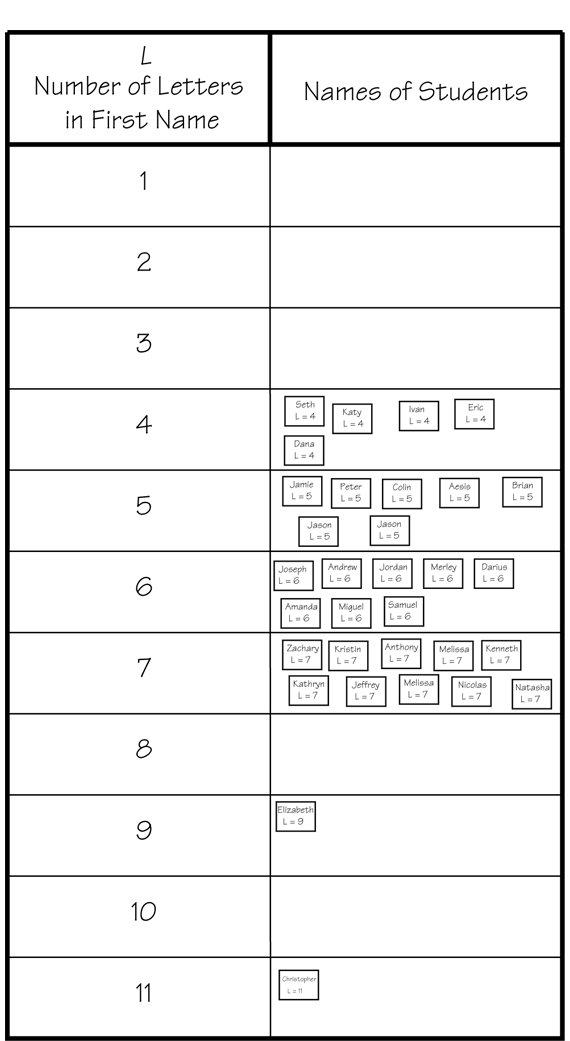
- Number of Letters in First Name will be one of the variables of the investigation. Who has the largest number of letters in their name in the class? (Christopher)
- Who has the smallest number of letters, the shortest name? (The shortest name in the class has 4 letters. Five students have 4 letters in their name: Dana, Seth, Katy, Ivan, and Eric.)
- What number of letters do you think is most common? (seven) Why? (There are more students in the class (10) that have 7 letters in their names than any other number of letters.)
- What might influence the length of a name? (Possible response: The length of a name might be different if you are using nicknames instead of names given at birth.)
Your students will probably give a variety of responses to the last question. It should become obvious that a definition of "length of name" must be agreed upon. While a study of first and last names is feasible, it is more straightforward to focus on the number of letters in a first name.
Define the Variables. Have the class discuss and choose a definition of the variable Number of Letters in First Name. It is important that the definition be explicit enough to handle all the names in the class, including two-part first names such as Mary Pat. Students should realize that agreeing on a definition is like agreeing on rules for a game. The rules themselves are less important than everyone agreeing on the same rules. The class may decide to allow nicknames or they may agree to use only the names given at birth as data. Either rule is valid as long as it is used consistently.
You must also establish a notation for the variable Number of Letters in First Name. Here again, agreeing is more important than what is agreed upon. We use L to stand for Number of Letters in First Name. The class can either follow our notation or make up their own.
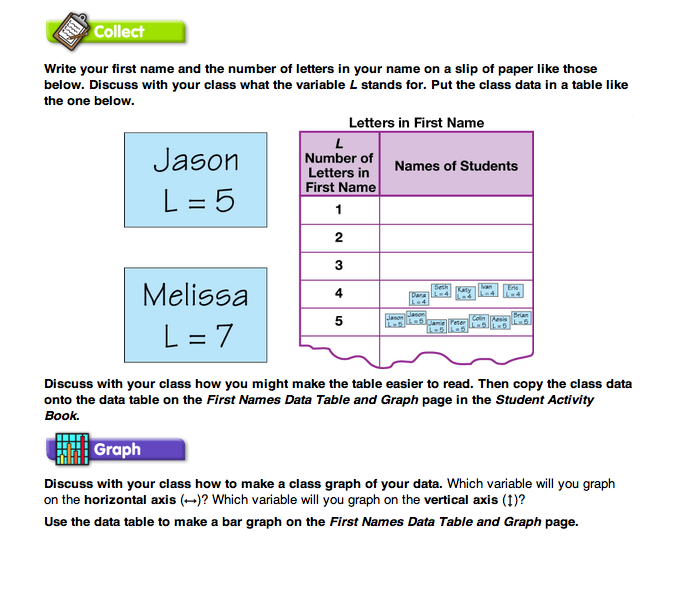
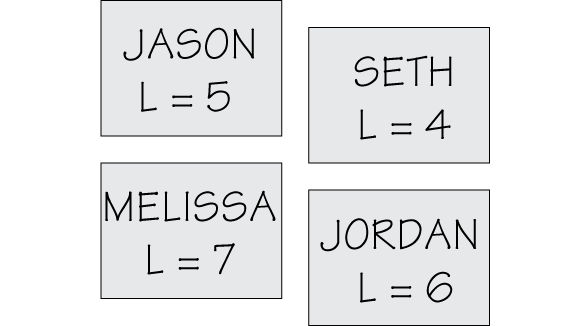
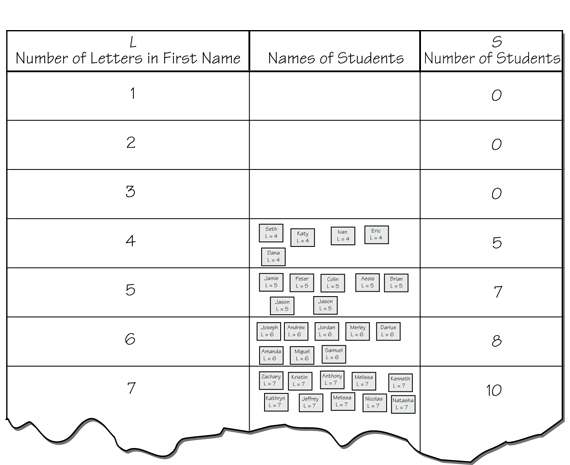
Collect the Data. The next step is to gather the data. To do this, students write their first names on self-adhesive notes, count the letters, and show L by writing "L =___ " below their names as shown in Figure 1.
An efficient way to collect this data is to draw a data table on chart paper and have students arrange their self-adhesive notes on it. See Figure 2.
A variable in an experiment is an attribute or quantity that changes or varies. Every experiment has at least two main variables. In this lab, the two main variables are the Number of Letters in First Name and the Number of Students. A second definition for the term is a symbol that can stand for a variable. In the Lesson Guide, we have chosen to use L to stand for Number of Letters in First Name and S for Number of Students. In this lesson, it is important to model the correct use of the term variable during class discussions while accepting students' language in discussions.
Since both variables are numerical (Number of Letters and Number of Students), it is best to avoid using N to stand for either variable.
Save the class graph for use in Unit 3 Lesson 1 T-Shirt Factory Problems. Students solve problems that involve the number of letters in their names.
Organize the Data.
Once you have the raw data, use the following prompt to begin a discussion:
- What do you notice about our data table? What patterns do you see? (Students may notice that no one has a first name with only one letter, that many people have first names that have five or six letters, or that there are few very long or very short names.)
After a general discussion, pose specific questions that can be answered directly from the raw data. In your questions, try to use “number of letters” to familiarize students with variable terminology.
- Who has the longest name? What is the number of letters in that name?
- Who has the shortest name? What is the number of letters in that name?
- Does anyone have a first name with eight letters?
- How many students have first names with six letters? five letters?
- What number of letters is most common in first names?
- Do more than half the students have names with either six or seven letters?
Adding a third column to the table with the total number of names in each row will clarify the data. See Figure 3. Review the titles of the first two columns and the information contained in them.
- What information will we put in the third column? (The number of students with each number of letters.)
- What title should we give it? Why? (Number of Students works best. Titling the column "Students" insufficiently describes how the information in that column differs from that in the second column.)
- Would N for Number of Students be a good choice to represent this variable? Why or why not? (N might seem logical because it is the first letter of the word number, but this would be confusing because N could also refer to "Number of Letters in First Name.")
When the data table is complete, ask students to work with a partner to answer the following questions using the added information:
- If you add all the numbers in the last column, what should they total? What does that number represent? (The sum should equal the number of students in the class. Finding the sum and comparing it to the class size is one way to check to see if the data gathering is accurate.)
- Do more than half the students have names with either five or six letters? (This is a multistep problem that can be solved different ways. Possible response: First I would add the number of students with either 5 or 6 letters, and then I would add the number of students for all the other number of letters. I can then compare my two answers to see if the number of students with 5 or 6 letters is more than half.)
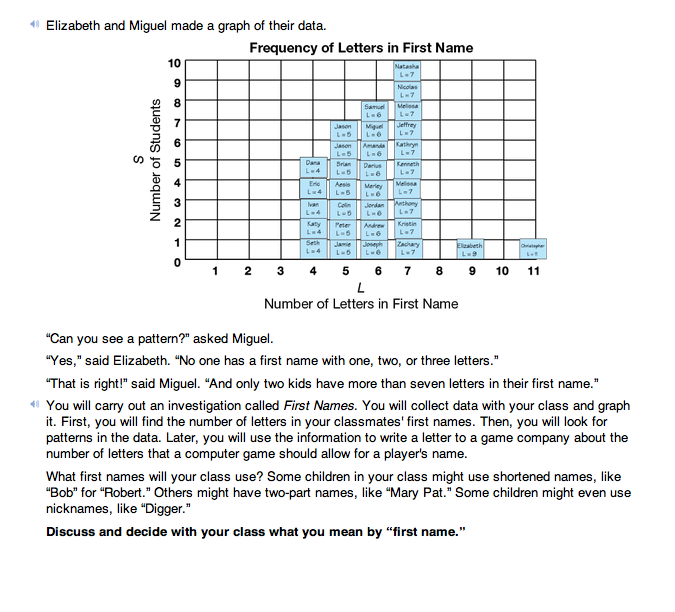
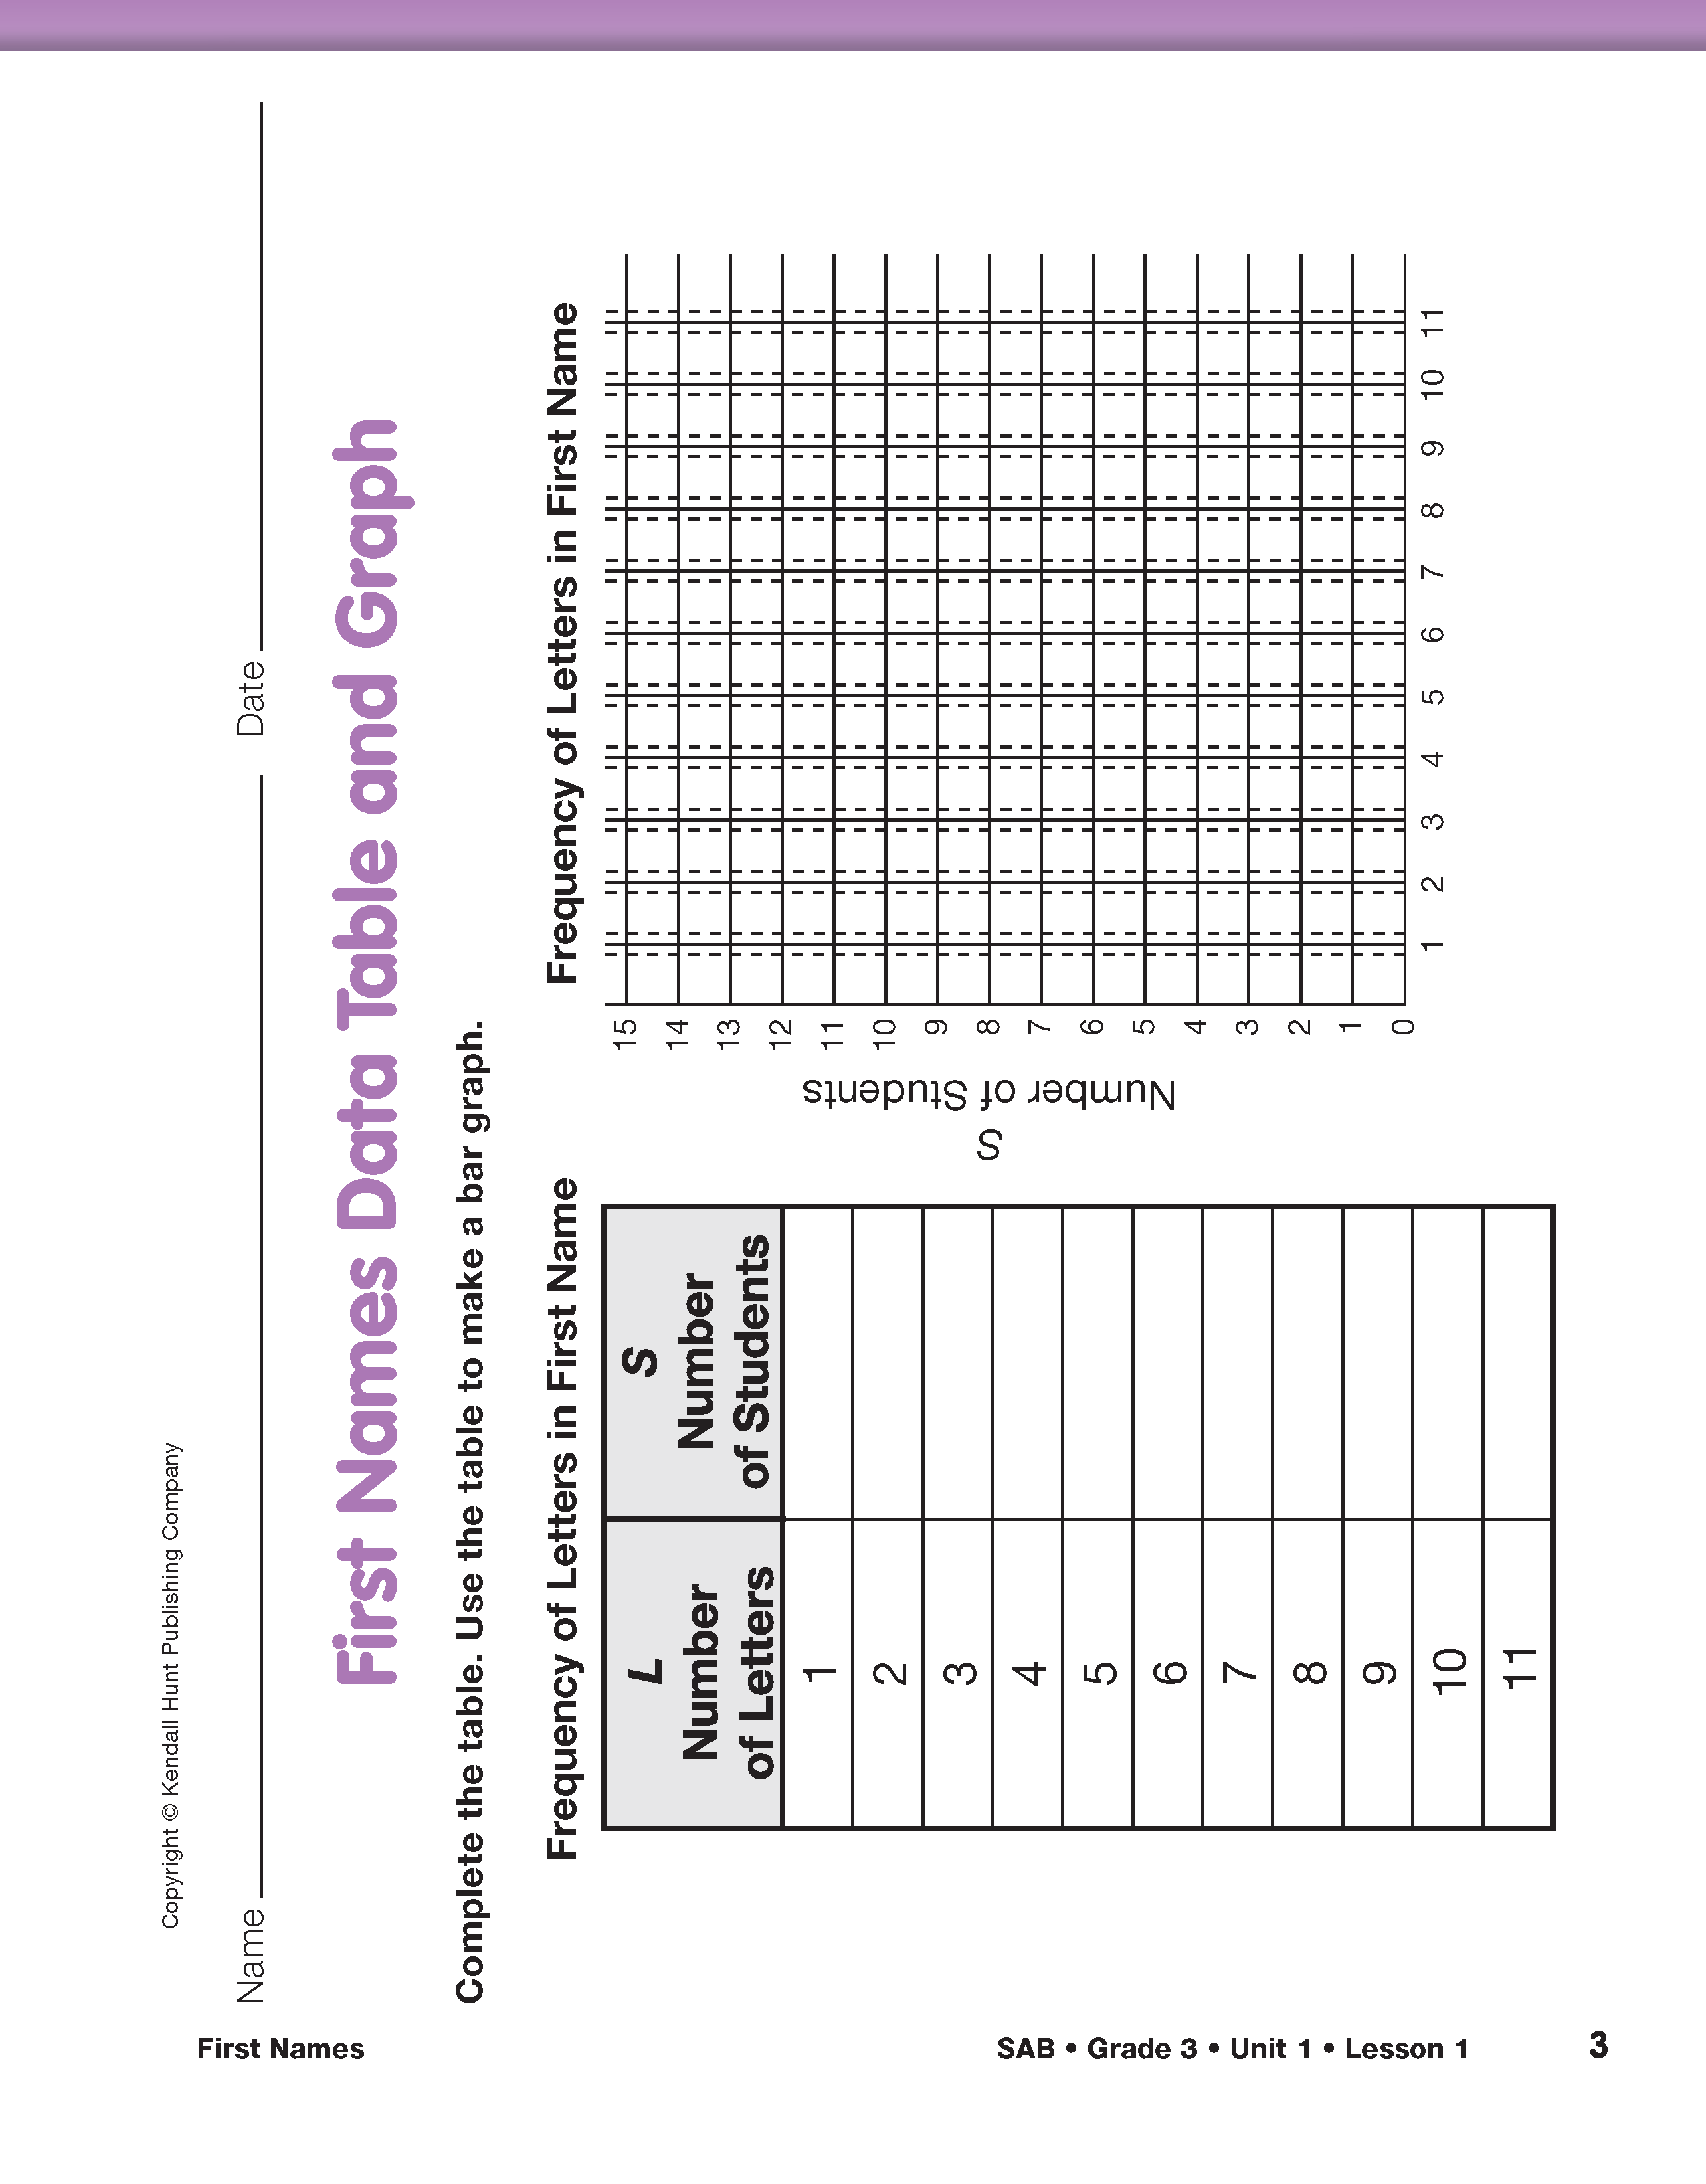
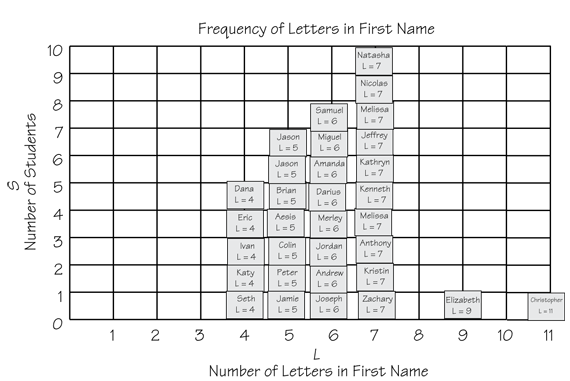
Graph the Data. Now that there are two variables, Number of Letters in First Name (L) and Number of Students (S), a graph can be made. The class makes one poster-size graph, and each student makes a graph using the First Names Data Table and Graph page in the Student Activity Book. Ask students to record the Number of Students (S) in the table. Introduce the graph by drawing attention to the elements of a graph, such as the vertical and horizontal axes and the labels for these axes using a display of the First Names Data Table and Graph page.
One way to make a class graph is simply to move the self-adhesive notes onto a labeled graph on a piece of chart paper. Place the self-adhesive notes on the vertical grid lines rather than in the spaces between them so there will be less confusion later when students make point graphs. Figure 4 shows a graph of the data presented in Figures 2 and 3.
Help students read the graph by asking:
- Which numbers show the number of letters in the names—those on the horizontal axis or those on the vertical axis? (horizontal axis)
- What do the numbers on the vertical axis show? (Number of Students)

Interpreting data in tables and graphs. Students often have problems distinguishing between variables in an investigation, especially when both of the main variables are numerical. Discussing the Explore questions will help students learn to interpret the graph and data table correctly. Students need to understand when they are talking about Number of Letters and when they are talking about Number of Students. The following sample dialog of a class discussing Questions 1–4 is based on the data in Figures 3 and 4. Student responses are adapted from a video of a classroom discussion.
Teacher: How many letters are in the longest name?
Maya: There are 11.
Teacher: Eleven what?
Maya: 11 letters.
Teacher: How do you know? Where did you look to find that answer?
Maya: I looked at the numbers at the bottom of the graph and went across and saw that the last one that went up to a line was 11.
Teacher: What do the numbers that go along the bottom of the graph tell you? [Maya looks confused.] Are they the Number of Letters or Number of Students?
Jackie: Number of Letters in our names.
Teacher: How many letters are in the shortest name? Where
can you look to find the answer?
Jacob: Four letters. I looked at the numbers at the bottom of
the graph.
Teacher: How did you know it was the shortest?
Jacob: Because you look on the graph or the table. Nobody
has one, two, or three letters in their names. Then
five people have four letters.
Teacher: What is the most common number of letters in our
names? What is the most common name length?
Linda: The number seven.
Teacher: Seven what?
Linda: Seven letters.
Teacher: How do you know?
Linda: Because I picked seven and went across and because I
looked and seven was the tallest bar.
Teacher: How many students have seven letters in their
names? How do you know? Where do you look to find
out? Come and show us.
Linda: Ten students. You look at the data table and look for the
most number of students, and you see it's ten, and you go
over here, and you see that it is seven letters.
Teacher: How many students have names with six letters in
their names? How do you know?
Keenya: You look at the graph where it says Letters and go to
where the 6 bar stops, then go up to see the number is 8.
Teacher: Where do you go to see the number 8? What does
it tell you?
Keenya: You go to the left where it says Number of Students.
Explore the Data. At this point, you have two representations of the same data: a data table and a graph. Questions 1–5 of the Explore section in the Student Guide can be answered by reading either the data table or graph. Encouraging multiple solutions lets every student access the problem in different ways and using different representations. Point out that solutions by different methods should agree. If a graph shows that ten people have names with seven letters and a data table shows that there are only nine such names, something is wrong. Ask groups to show how they used each tool to answer Questions 1–5.
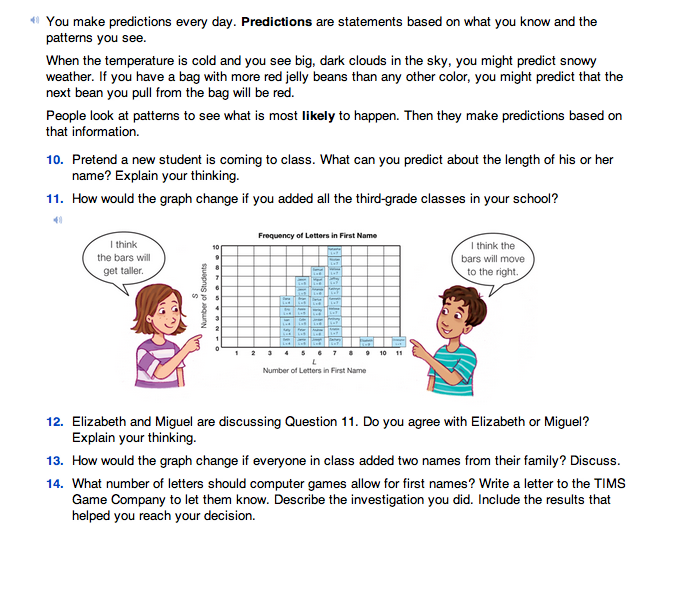
Assign Questions 6–13 in the Student Guide. These questions ask students to extend their interpretation of the data and to make predictions. Ask small groups of students to prepare to share their solutions to one or more problems with the whole class.
Question 6 asks students to compare the graph and the data table. The graph and the data table contain the same information in different forms. Both show the number of students who have a given number of letters in their first names. The data table shows the Number of Letters in First Name in the first column and the Number of Students with those numbers of letters in the second column. The graph shows the Number of Letters in First Name on the horizontal axis and the Number of Students on the vertical axis. The height of each bar shows the number of students for a given number of letters.
Here are some sample student responses to this question taken from a video of students working in groups:
Group A
“They are alike because they give the same information. They are different because one has rows of numbers and one has bars with numbers and letters.”
Group B
“They are alike because the graph and the data table have the same data. They have the same stuff in them. They are different because of the different ways of showing the data.”
Question 7 asks students to discuss the shape of the graph. While students may describe the shape as stair steps or as a mountain, it is more important to recognize why the bars form that shape. The bars represent the number of students with very short names on the left and very long names on the right. These names are not as common as names with five, six, or seven letters. The tall bars in the middle represent the length of the most common names. Possible answers for Questions 8–13 are in the answer key.