Lesson 3

Kind of Bean

Est. Class Sessions: 3
X

Mathematical Standards

3.MD.B
Represent and interpret data. (3.MD.B.3)
3.NBT.A
Use place value understanding and properties of operations to perform multi-digit arithmetic. (3.NBT.A.2)

Standards for Mathematical Practice

MP1.
Make sense of problems and persevere in solving them.
MP2.
Reason quantitatively.
MP3.
Construct viable arguments and critique the reasoning of others.
MP4.
Model with mathematics.
MP7.
Look for and make sense of structure.

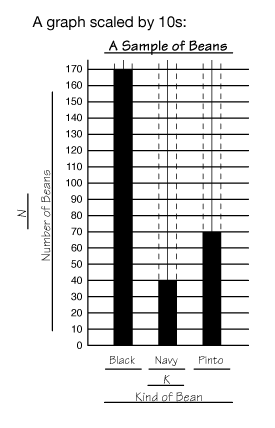
Students make predictions and generalizations about a population by studying a sample. In the Kind of Bean Lab, students take a scoopful of dry beans from a population of beans. After students gather and count the beans, they record, organize, graph, and analyze their data.

Content in this Lesson

  • Representing and using variables of an investigation [E1].
  • Drawing scaled bar graphs from a table [E2].
  • Reading a table or scaled graph to find information about a data set [E3].
  • Making predictions and generalizations about a population from a sample using data tables and graphs [E4].
  • Communicating reasoning and solutions verbally and in writing [MPE5].
  • Representing whole number sums on number lines [E6].
X

Materials for Students

Daily Practice and Problems Lesson Homework Assessment

Student Books

Student Guide
Student Activity Book

Teacher Resources

Teacher Guide - digital

Supplies for Student Groups

  • small container such as a margarine tub or yogurt cup

Materials for the Teacher

  • Display of the Kind of Bean Lab Graph (Student Activity Book) Page 14
  • large container of mixed beans
  • 1/4-cup scoop or 4-oz. paper cup
  • 3 kinds of beans. See Materials Preparation.
  • self-adhesive notes
  • Unit 1 Assessment Record

Materials Preparation

Create a Bean Population. Create a bean population by selecting three different types of beans. Label a large container “bean population.” Fill a large container with the three types of beans and mix them thoroughly. Students should not be told this recipe. Each type of bean should be approximately the same size, and each type should be easily distinguishable from the others. It is important that the mixture have one type of bean that is most common, e.g., 1 pound of red beans, 2 pounds of navy beans, and 4 pounds of pinto beans.

Assessment in this Lesson

Assessment Expectation Assessed Math Practices Expectation Assessed
Kind of Bean Lab Picture
Student Activity Book
Page 13
E1.
Represent the variables and procedures of an investigation in a drawing.
Kind of Bean Lab Graph
Student Activity Book
Page 14
E2.
Draw scaled bar and picture graphs from a table.
Kind of Bean Lab
Check-In: Questions 7–11 with Feedback Boxes
Student Activity Book
Pages 16–19
E2.
Draw scaled bar and picture graphs from a table.
E3.
Read a table or scaled graph to find information about a data set.
E4.
Make predictions and generalizations about a populations from a sample using data tables and graphs.
MPE5.
Show my work. I show or tell how I arrived at my answer so someone else can understand my thinking.
DPP Item L
Playing Number Line Target
Teacher Guide - digital
E6.
Represent whole number sums on number lines.