Lesson 5

Using Picture Graphs

Est. Class Sessions: 1–2
X

Mathematical Standards

3.MD.B
Represent and interpret data. (3.MD.B.3)

Standards for Mathematical Practice

MP1.
Make sense of problems and persevere in solving them.
MP2.
Reason quantitatively.
MP3.
Construct viable arguments and critique the reasoning of others.
MP5.
Use appropriate tools strategically.
MP6.
Attend to precision.
MP8.
Look for and express regularity in repeated reasoning.

Students solve one- and two-step word problems using sample data represented in scaled picture graphs and tables.

Content in this Lesson

  • Using picture graphs to solve problems and make predictions [E4, E5].
  • Drawing scaled picture graphs from a table [E2].
  • Reading a table or scaled graph to find out information about a data set [E3].
  • Making predictions and generalizations about a population from a sample using data tables and graphs [E4].
  • Solving one- and two-step problems involving addition and subtraction [E5].
  • Demonstrating fluency with addition facts [E7].
  • Communicating reasoning and solutions verbally and in writing [MPE5].
X

Materials for Students

Daily Practice and Problems Lesson Assessment

Student Books

Student Guide
Student Activity Book

Teacher Resources

Teacher Guide - digital

Materials for the Teacher

Display of first Picture Graphs page (Student Activity Book) Page 23, optional
Unit 1 Assessment Record
Math Facts Class Record
Individual Assessment Record

Assessment in this Lesson

Assessment Expectation Assessed

Picture Graphs
Check-In: Questions 5–10 with
Feedback Box
Student Activity Book
Pages 24–26

E2.
Draw scaled bar and picture graphs from a table.
E3.
Read a table or scaled graph to find information about a data set.
E4.
Make predictions and generalizations about a population from a sample using data tables and graphs.
E5.
Solve one- and two-step problems using data in scaled bar and picture graphs.

DPP Item Q
Addition Facts Quiz: More
Addition Facts

Teacher Guide - digital

E7.
Demonstrate fluency with the addition facts.

DPP Item R
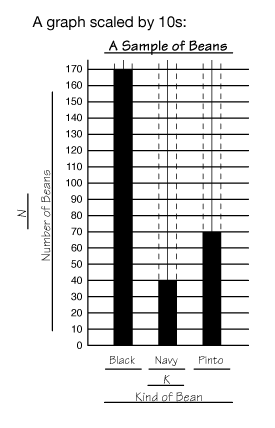
Sample of Beans
Teacher Guide - digital

E2.
Draw scaled bar and picture graphs from a table.
E3.
Read a table or scaled graph to find information about a data set.
E5.
Solve one- and two-step problems using data in scaled bar and picture graphs.

Vocabulary in this Lesson