


Kind of Bean
Est. Class Sessions: 3Developing the Lesson
Part 2: Kind of Bean Lab
Identify the Variables. Distribute a small container to each pair of students. One student from each pair should take a 1/4-cup scoop of beans from the large container you prepared and put it in their small container. Tell students that this is their sample of the population of beans. Relate the bean sample population in their container to the animal sample population in the rain forest. Tell students they are going to study their population of beans the same way the Robinsons studied the animals in the rain forest.
The following questions can help guide the discussion:
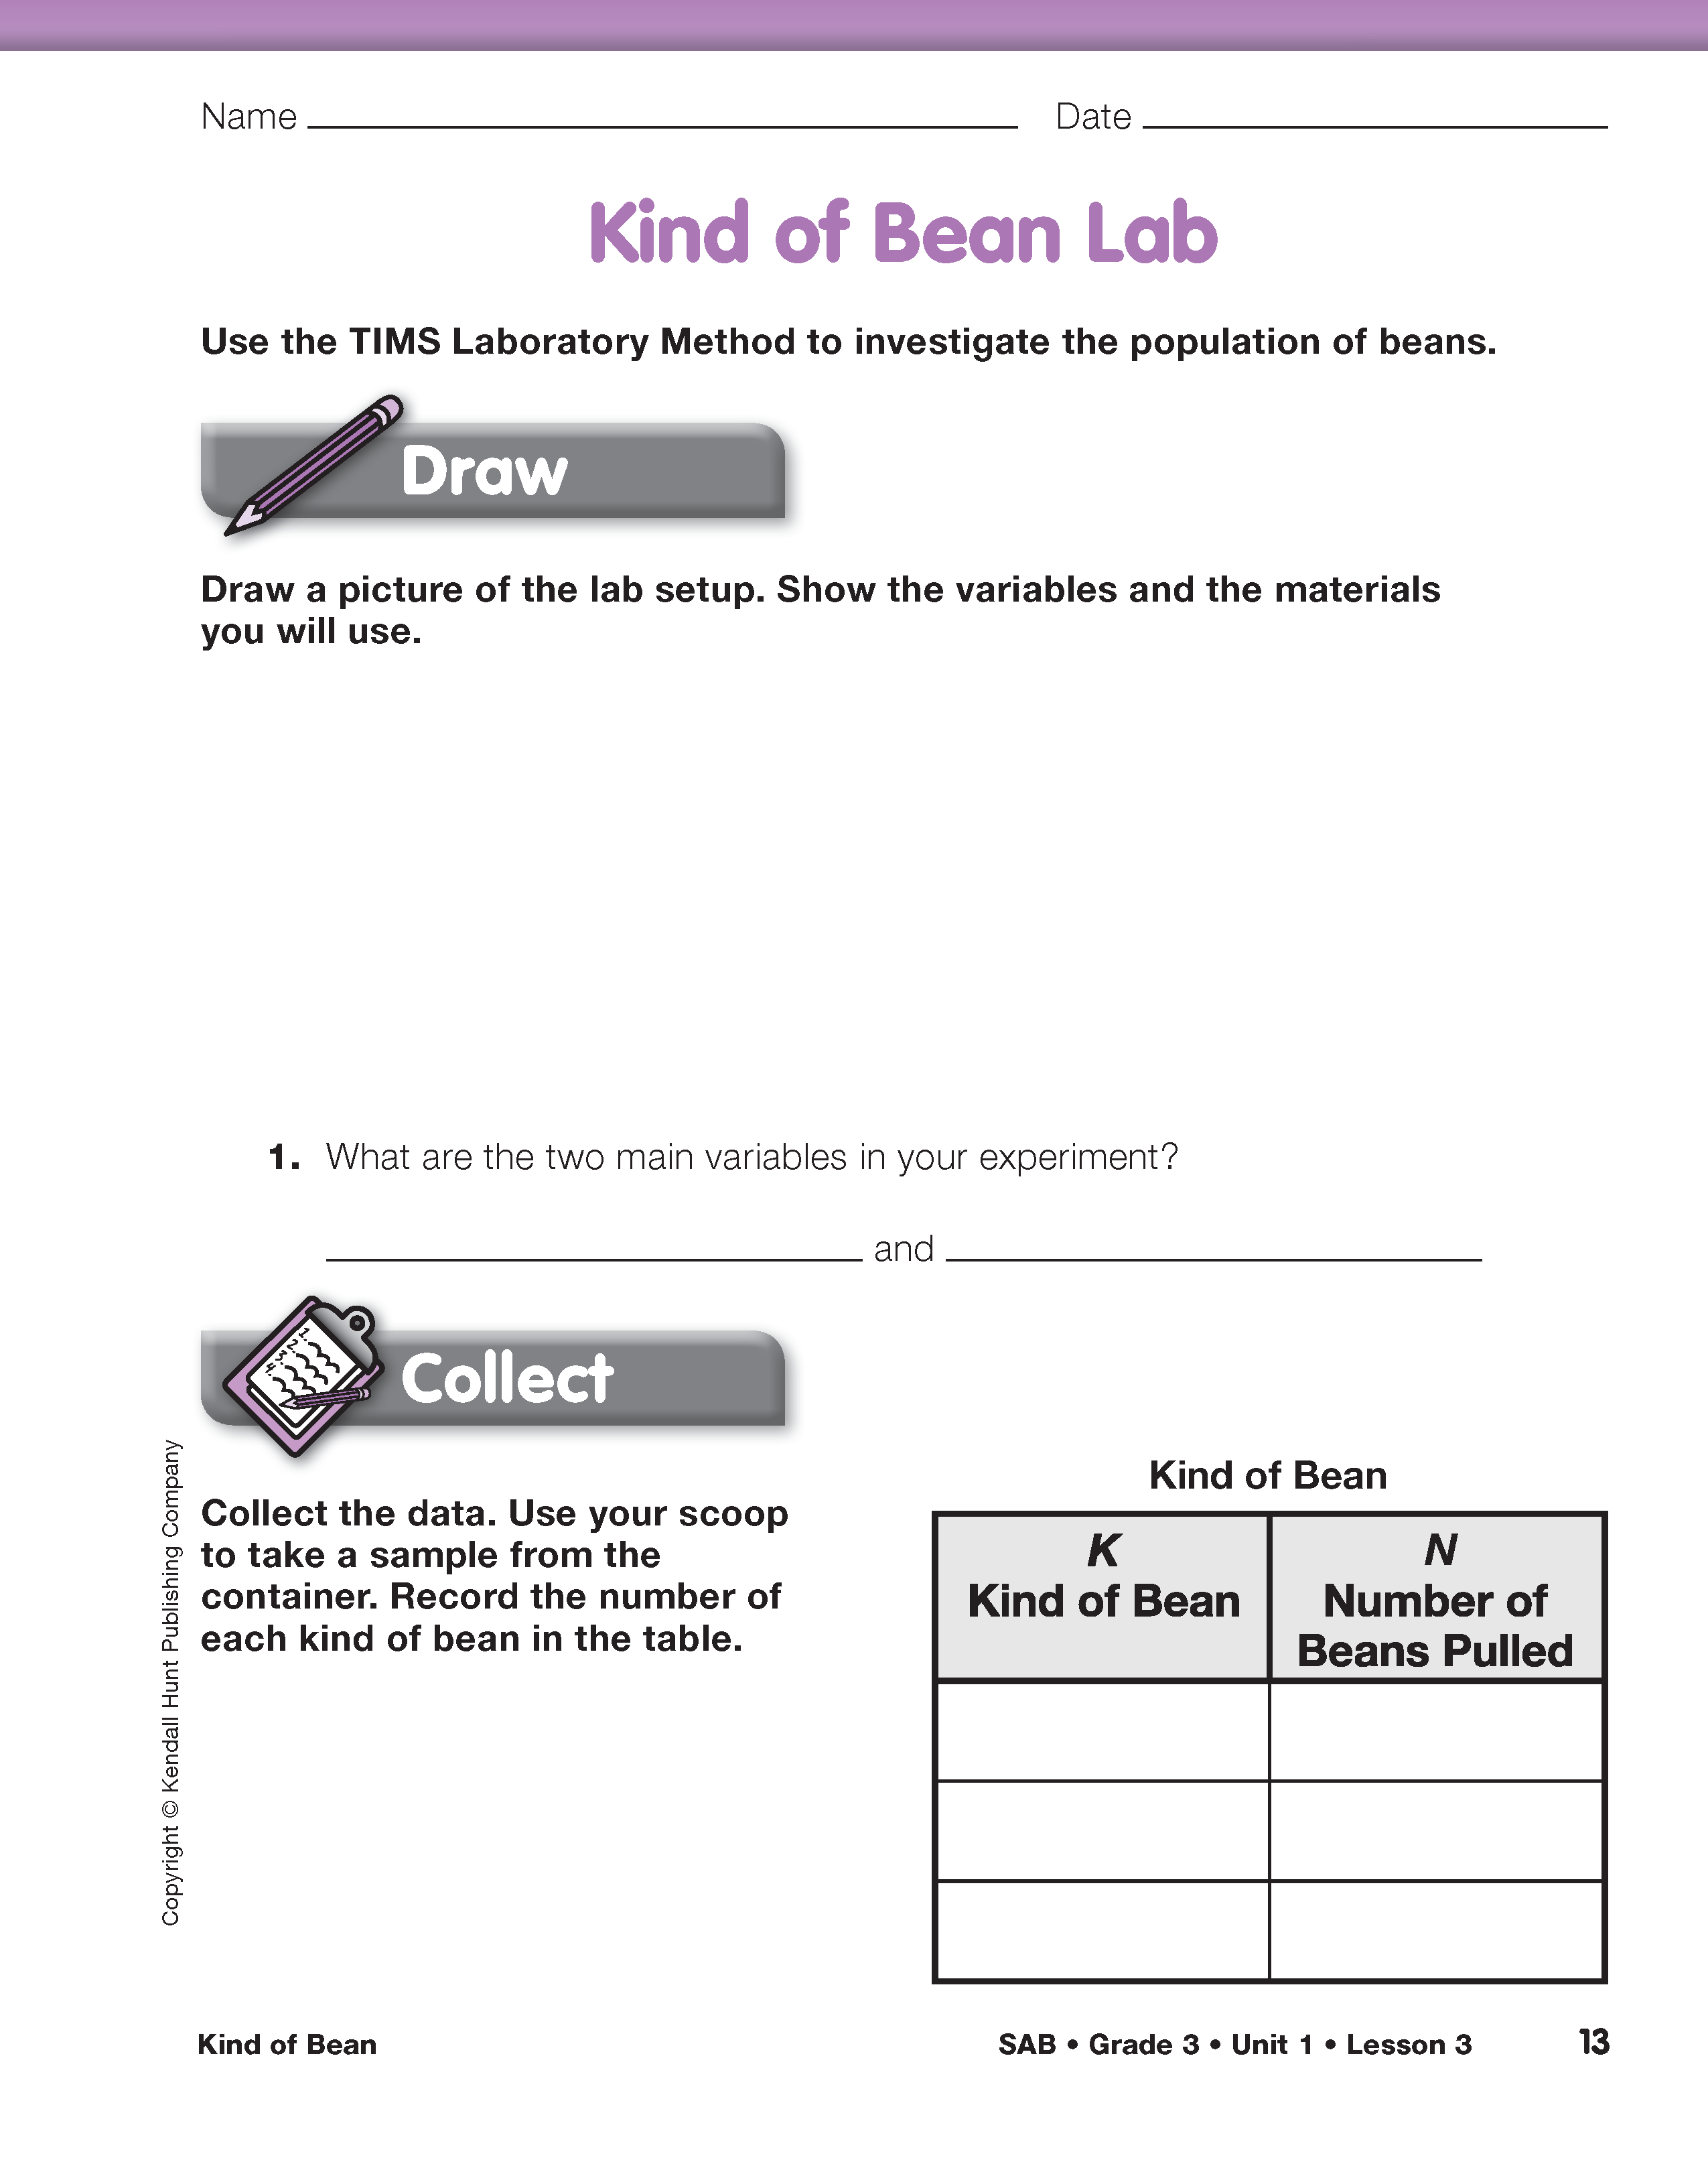
Draw the Picture. Refer students to the Kind of Bean Lab pages in the Student Activity Book. To begin, explain to students that they will draw a picture of the experiment that shows the variables and what they will do to collect their data. This is the first step in the TIMS Laboratory Method.
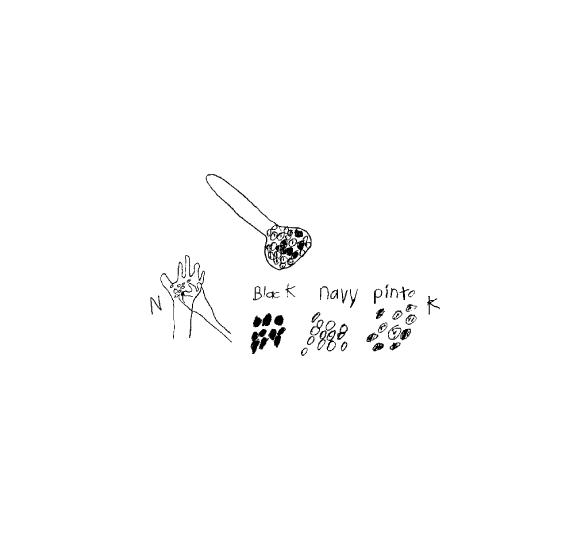
Discuss what makes a good picture. Although aesthetics is part of what makes a good picture, it is more important scientifically to communicate procedures, show equipment, identify variables, and establish notation. See Figure 1. Note that this student showed the three kinds of beans, the procedure of filling the scoop with beans, and sorting them by kind. He also labeled the variables with “K” for Kind of Bean and “N” for Number of Beans. Direct students to each complete a drawing in the Draw section on the Kind of Bean Lab page.
Collect the Data. Collecting the data is step two of the TIMS Laboratory Method. Begin by having students fill out the first column of the data table with the names of the kinds of beans. Since students have already taken a sample of the population, the pair should sort and count them and complete the data table in the Collect section in the Student Activity Book.

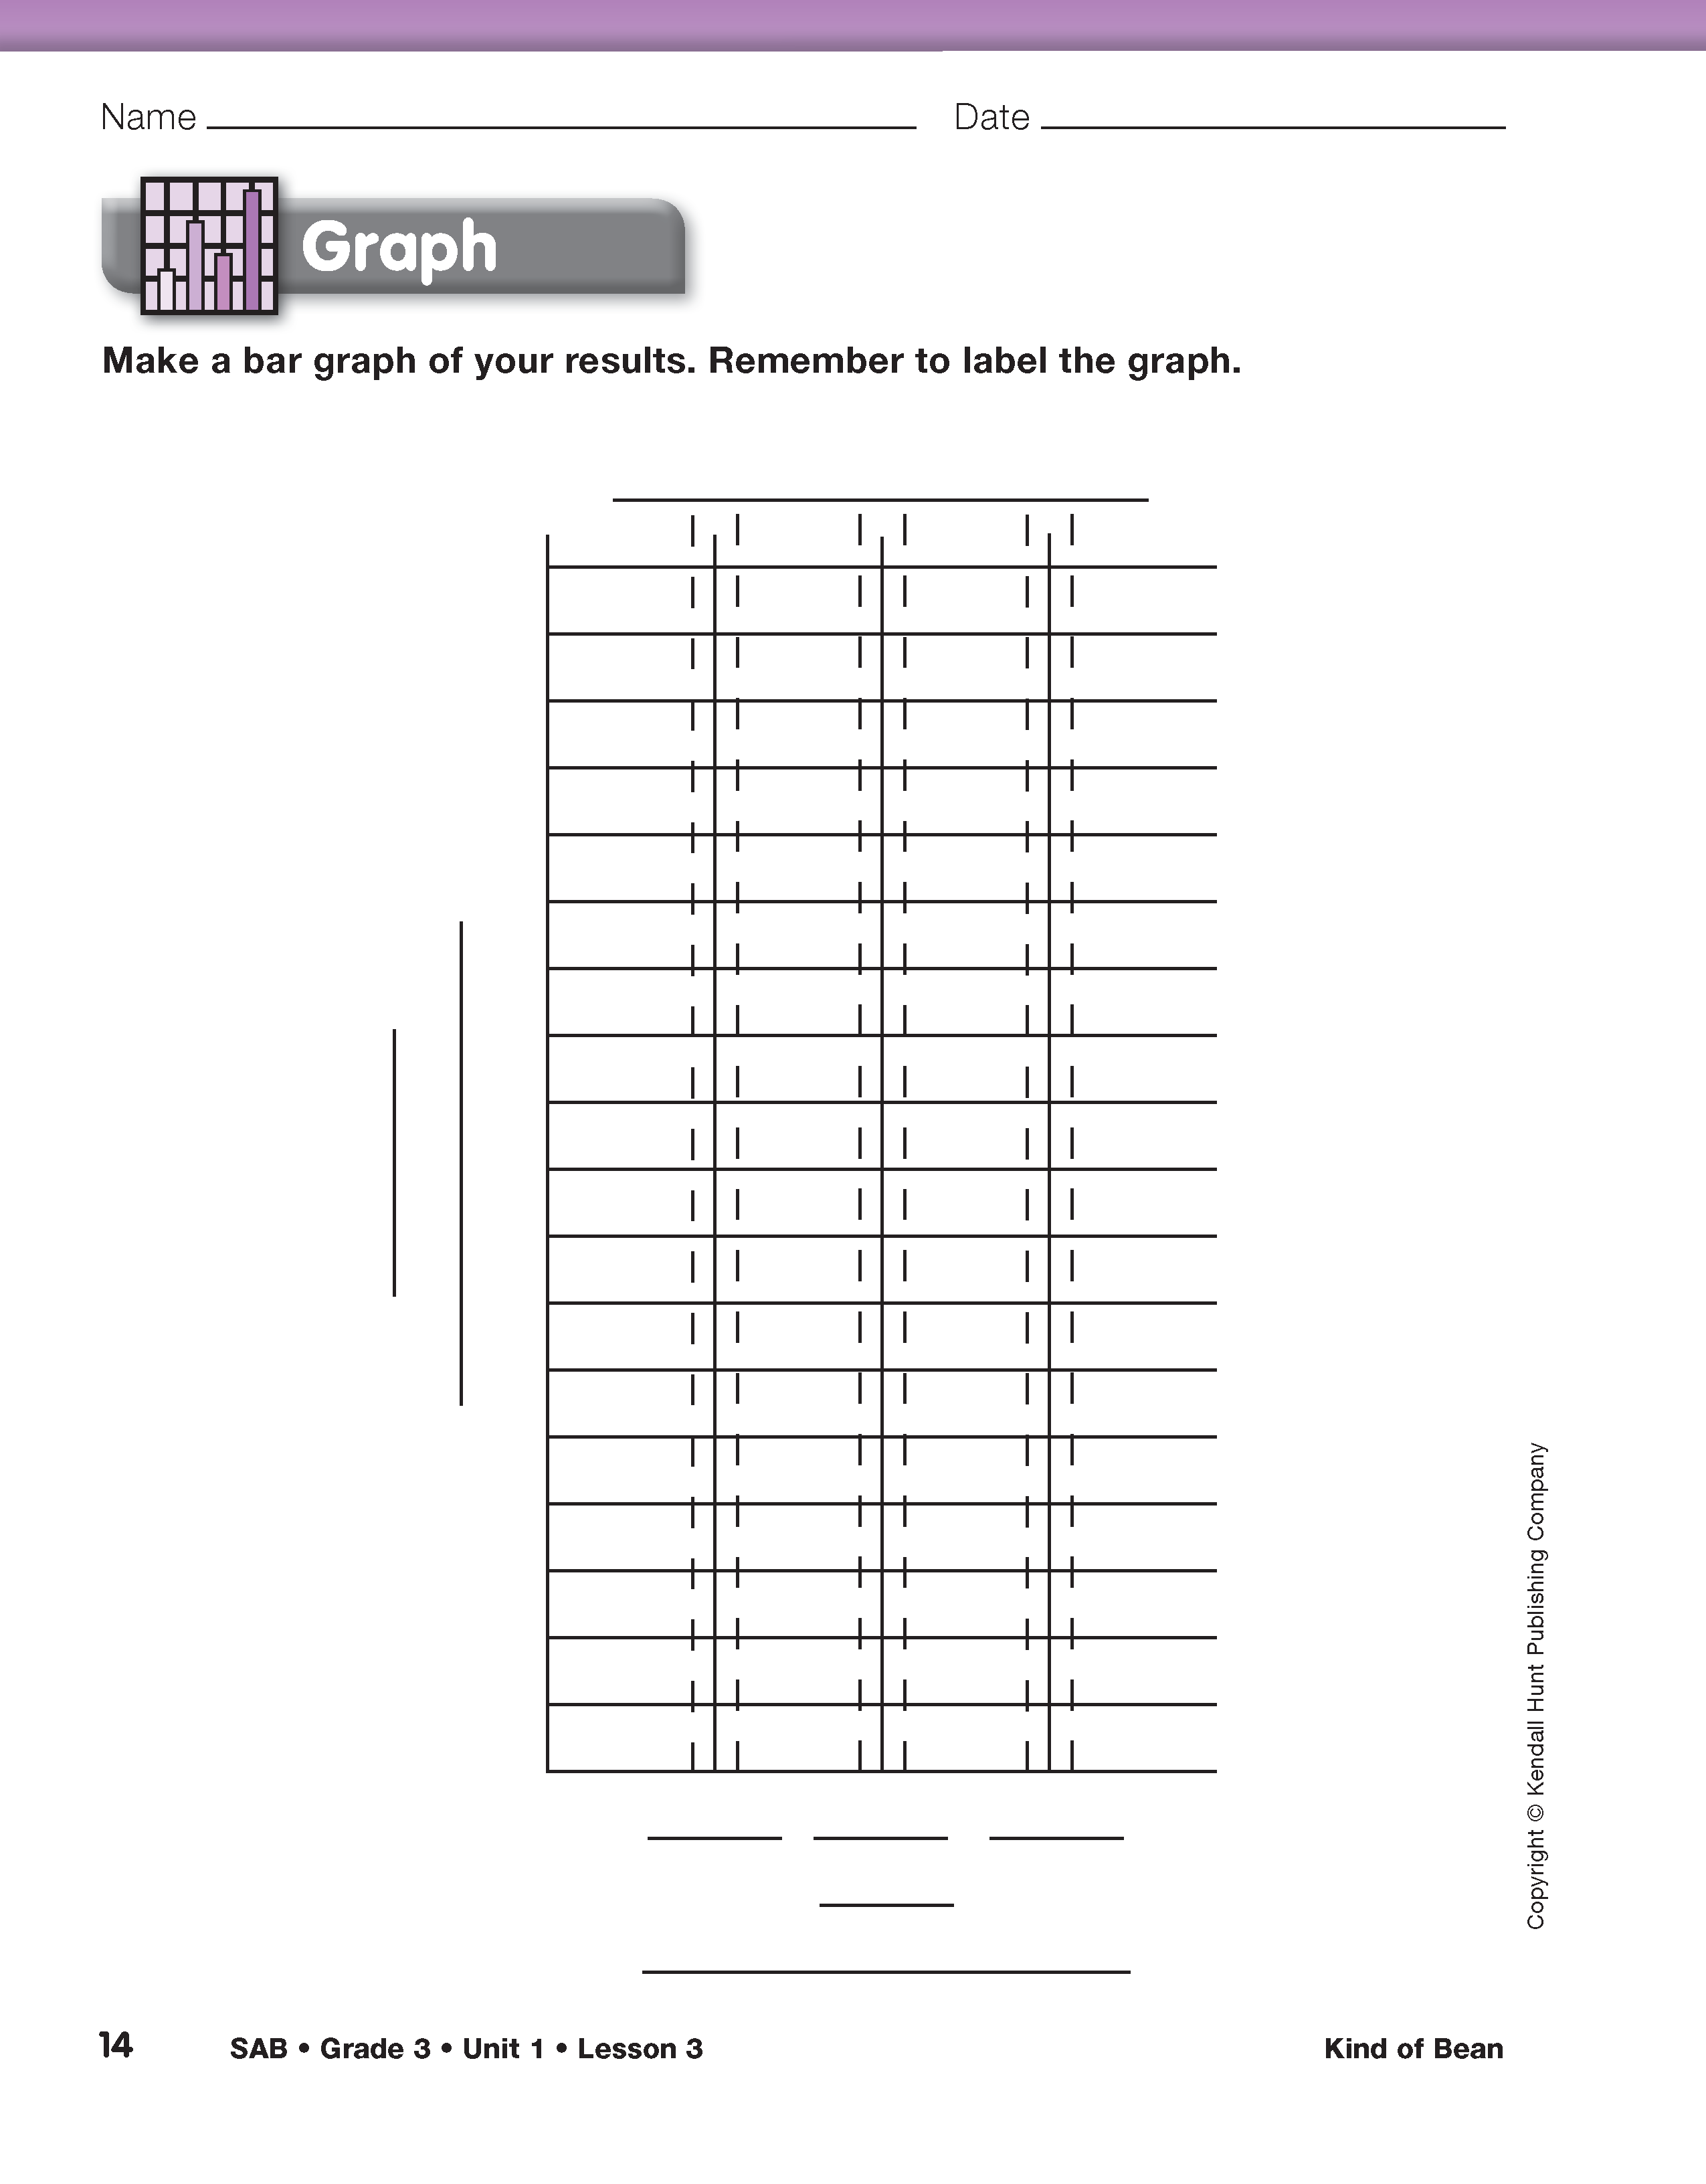
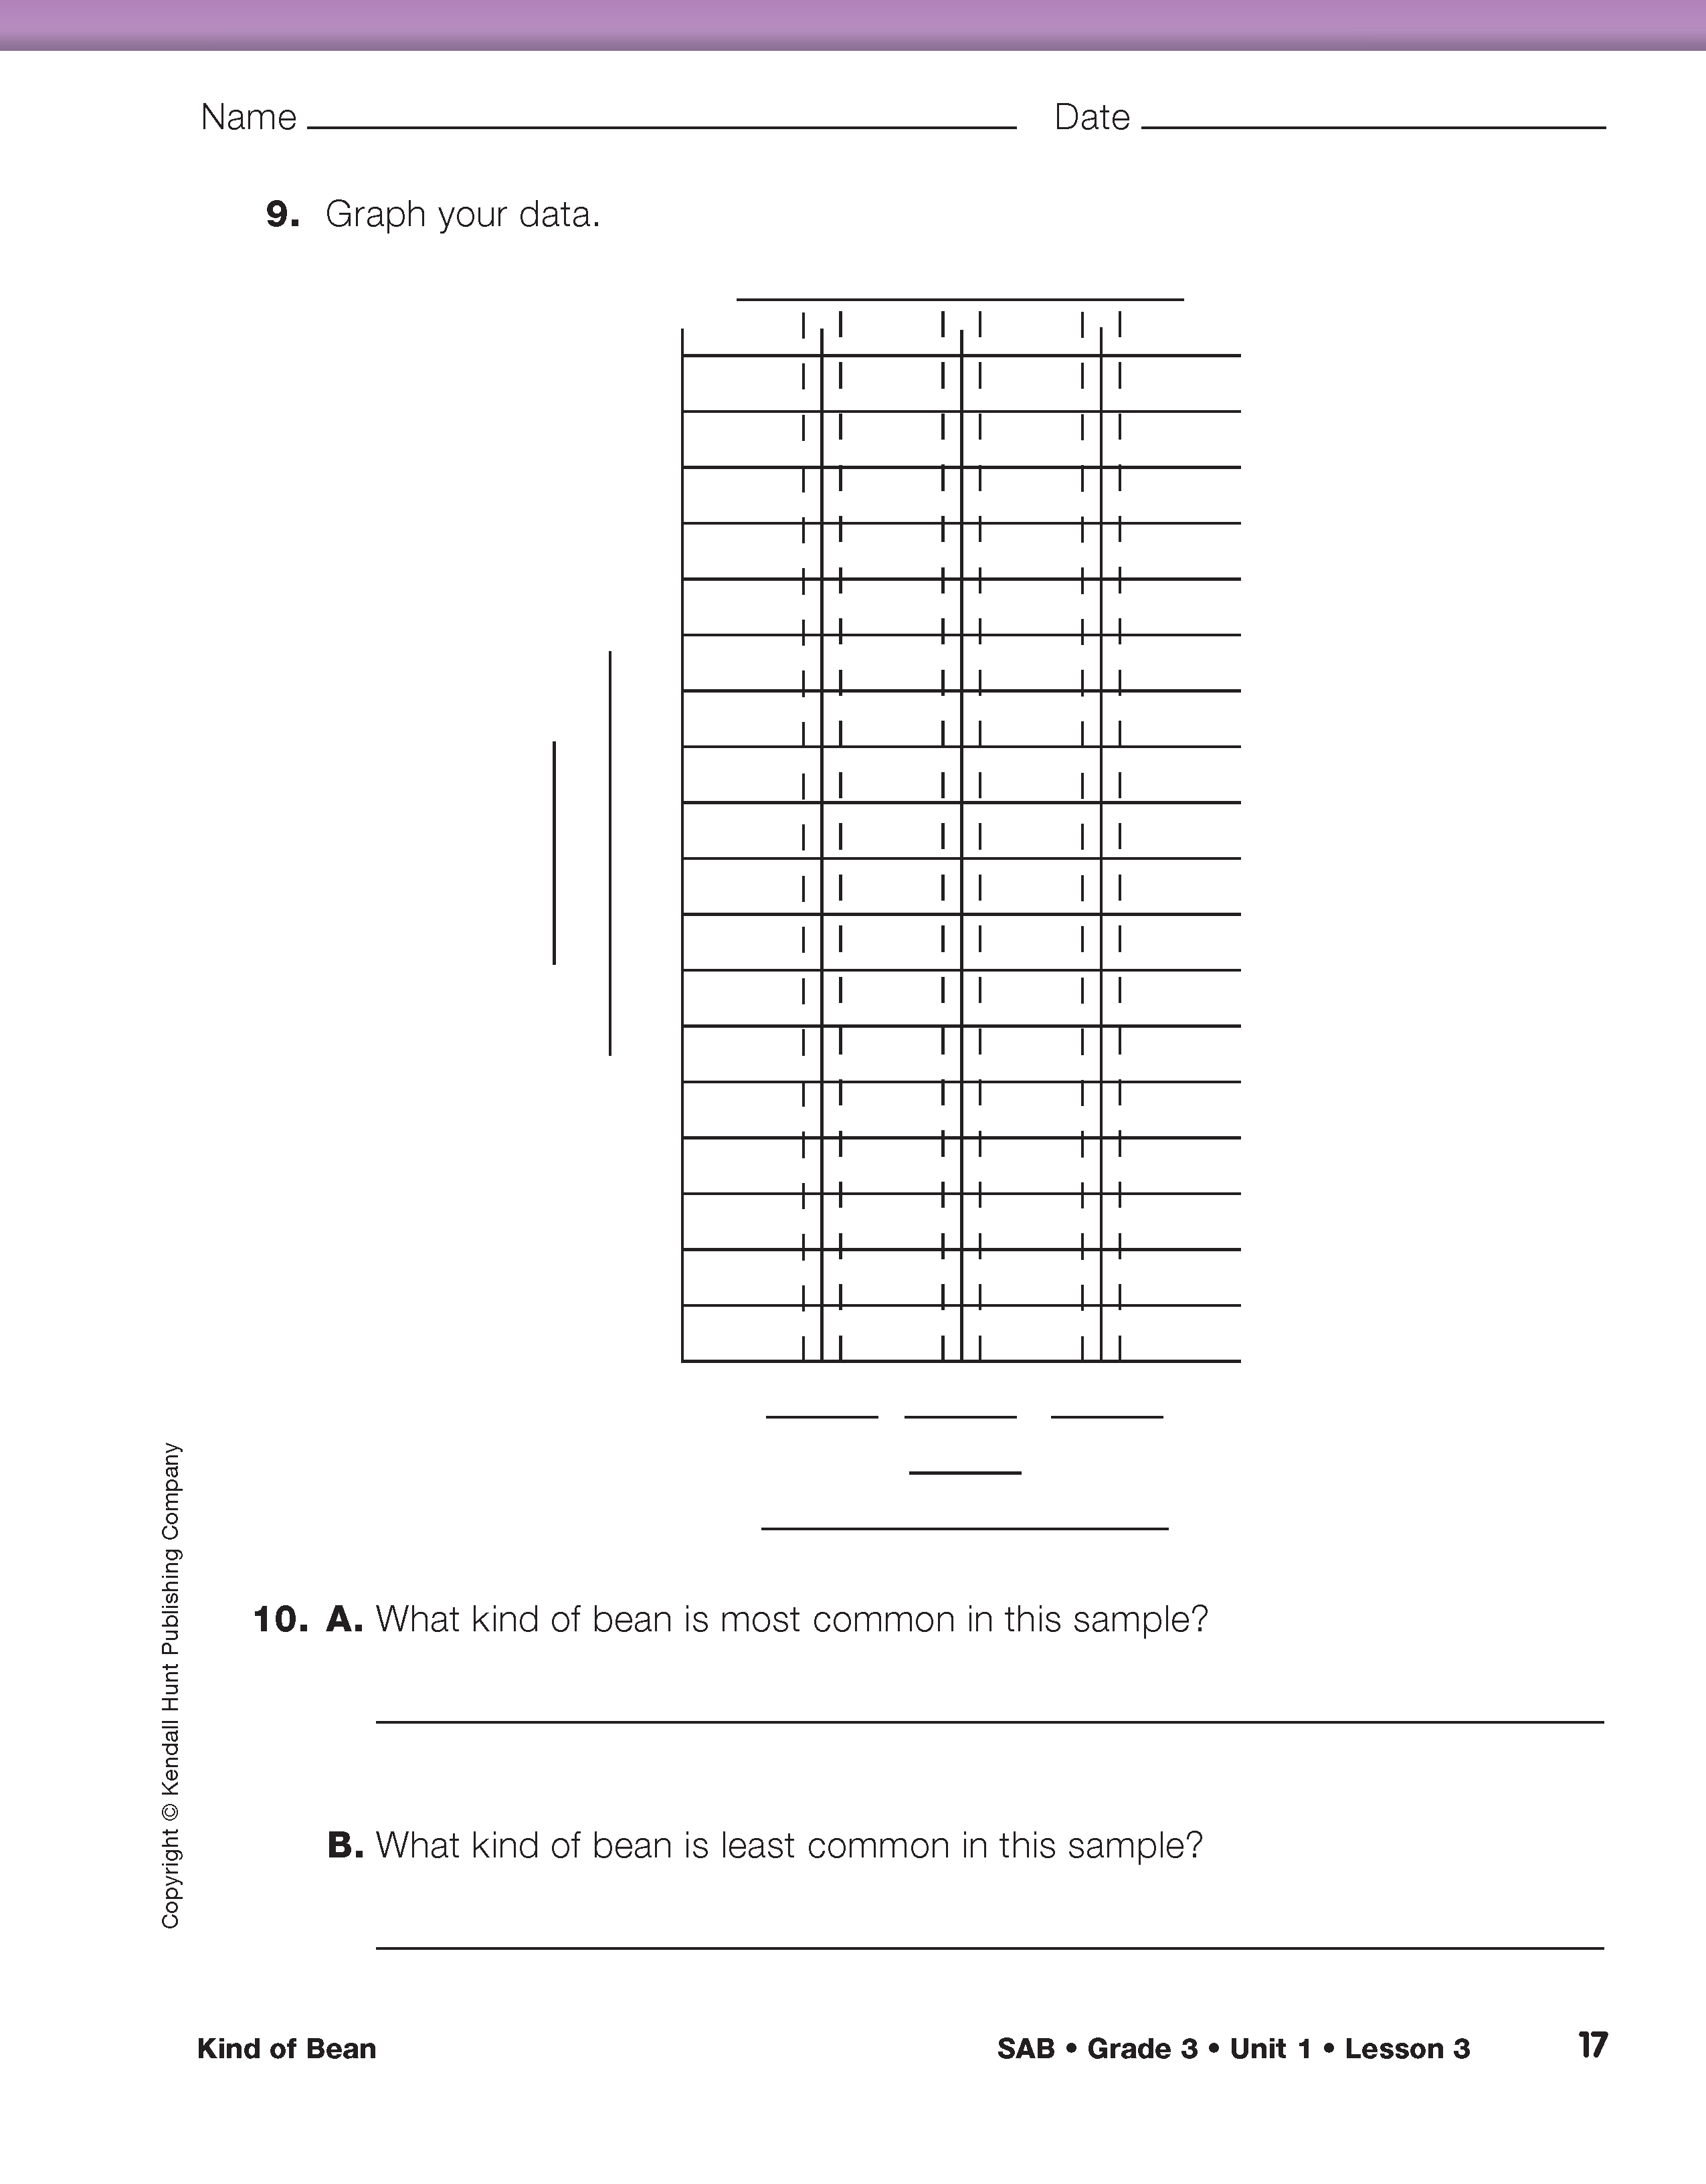
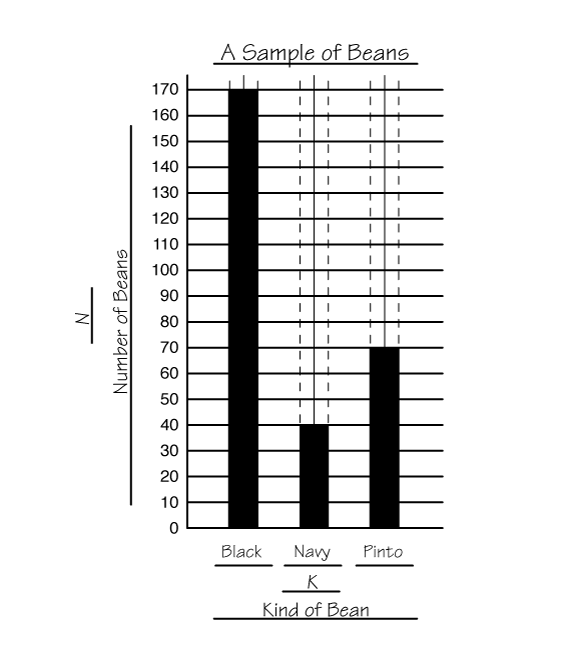
Graph the Data. The third step of the TIMS Laboratory Method is graphing the data. Many relationships between variables become more evident on a graph. Remind students to label their graph with an appropriate title and to label each axis with the name of the variable and a letter to stand for the variable. Students should label the horizontal axis with the names of the three types of beans in their population. Remind students that because the range of data for the Number of Beans is so large the vertical axis will need to be scaled by something other than one. Ask students to discuss how the vertical axis could be scaled so that all of their data can be accurately shown on their graphs. Students should use the dotted lines as guides and the bars should accurately reflect the data in the table. See Figure 2.
Ask the class to compare students' graphs.
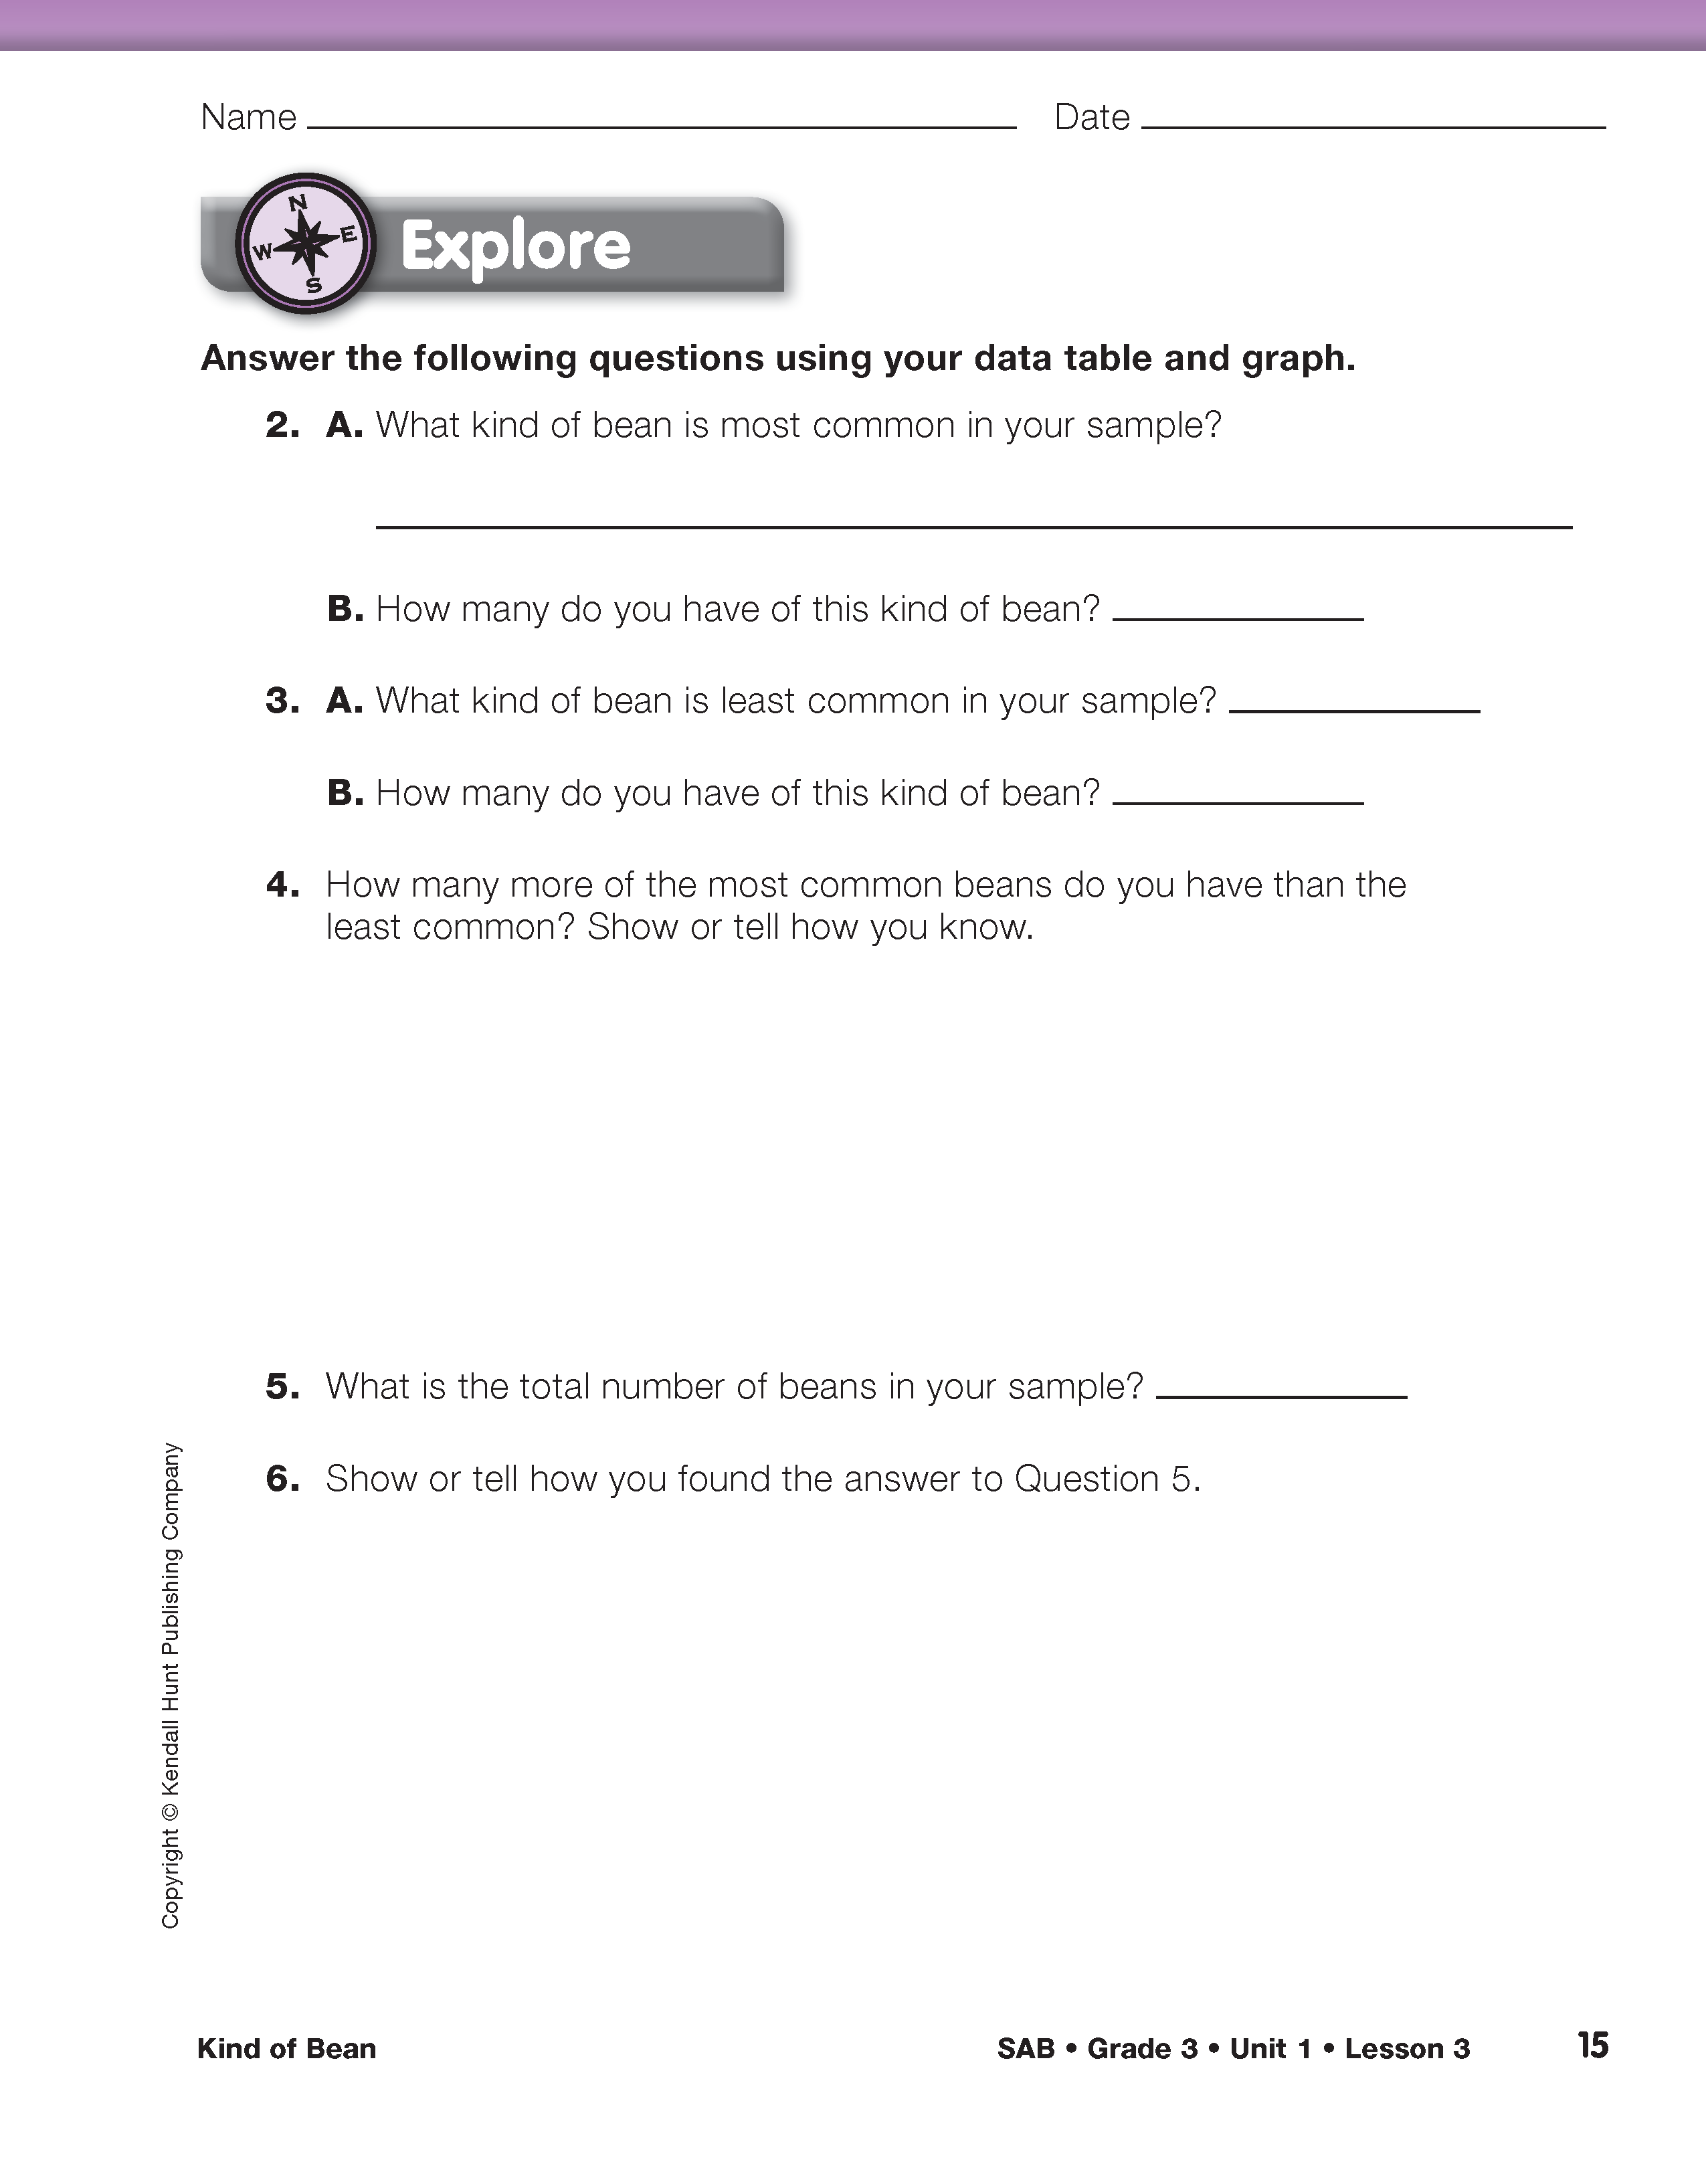
Explore the Data. The fourth step in the TIMS Laboratory Method is exploring the data through a series of questions. Questions 2–6 in the Student Activity Book ask students to interpret the data literally. The answers can be found either in the data table or the graph. Since student groups will have different data, their answers will differ.
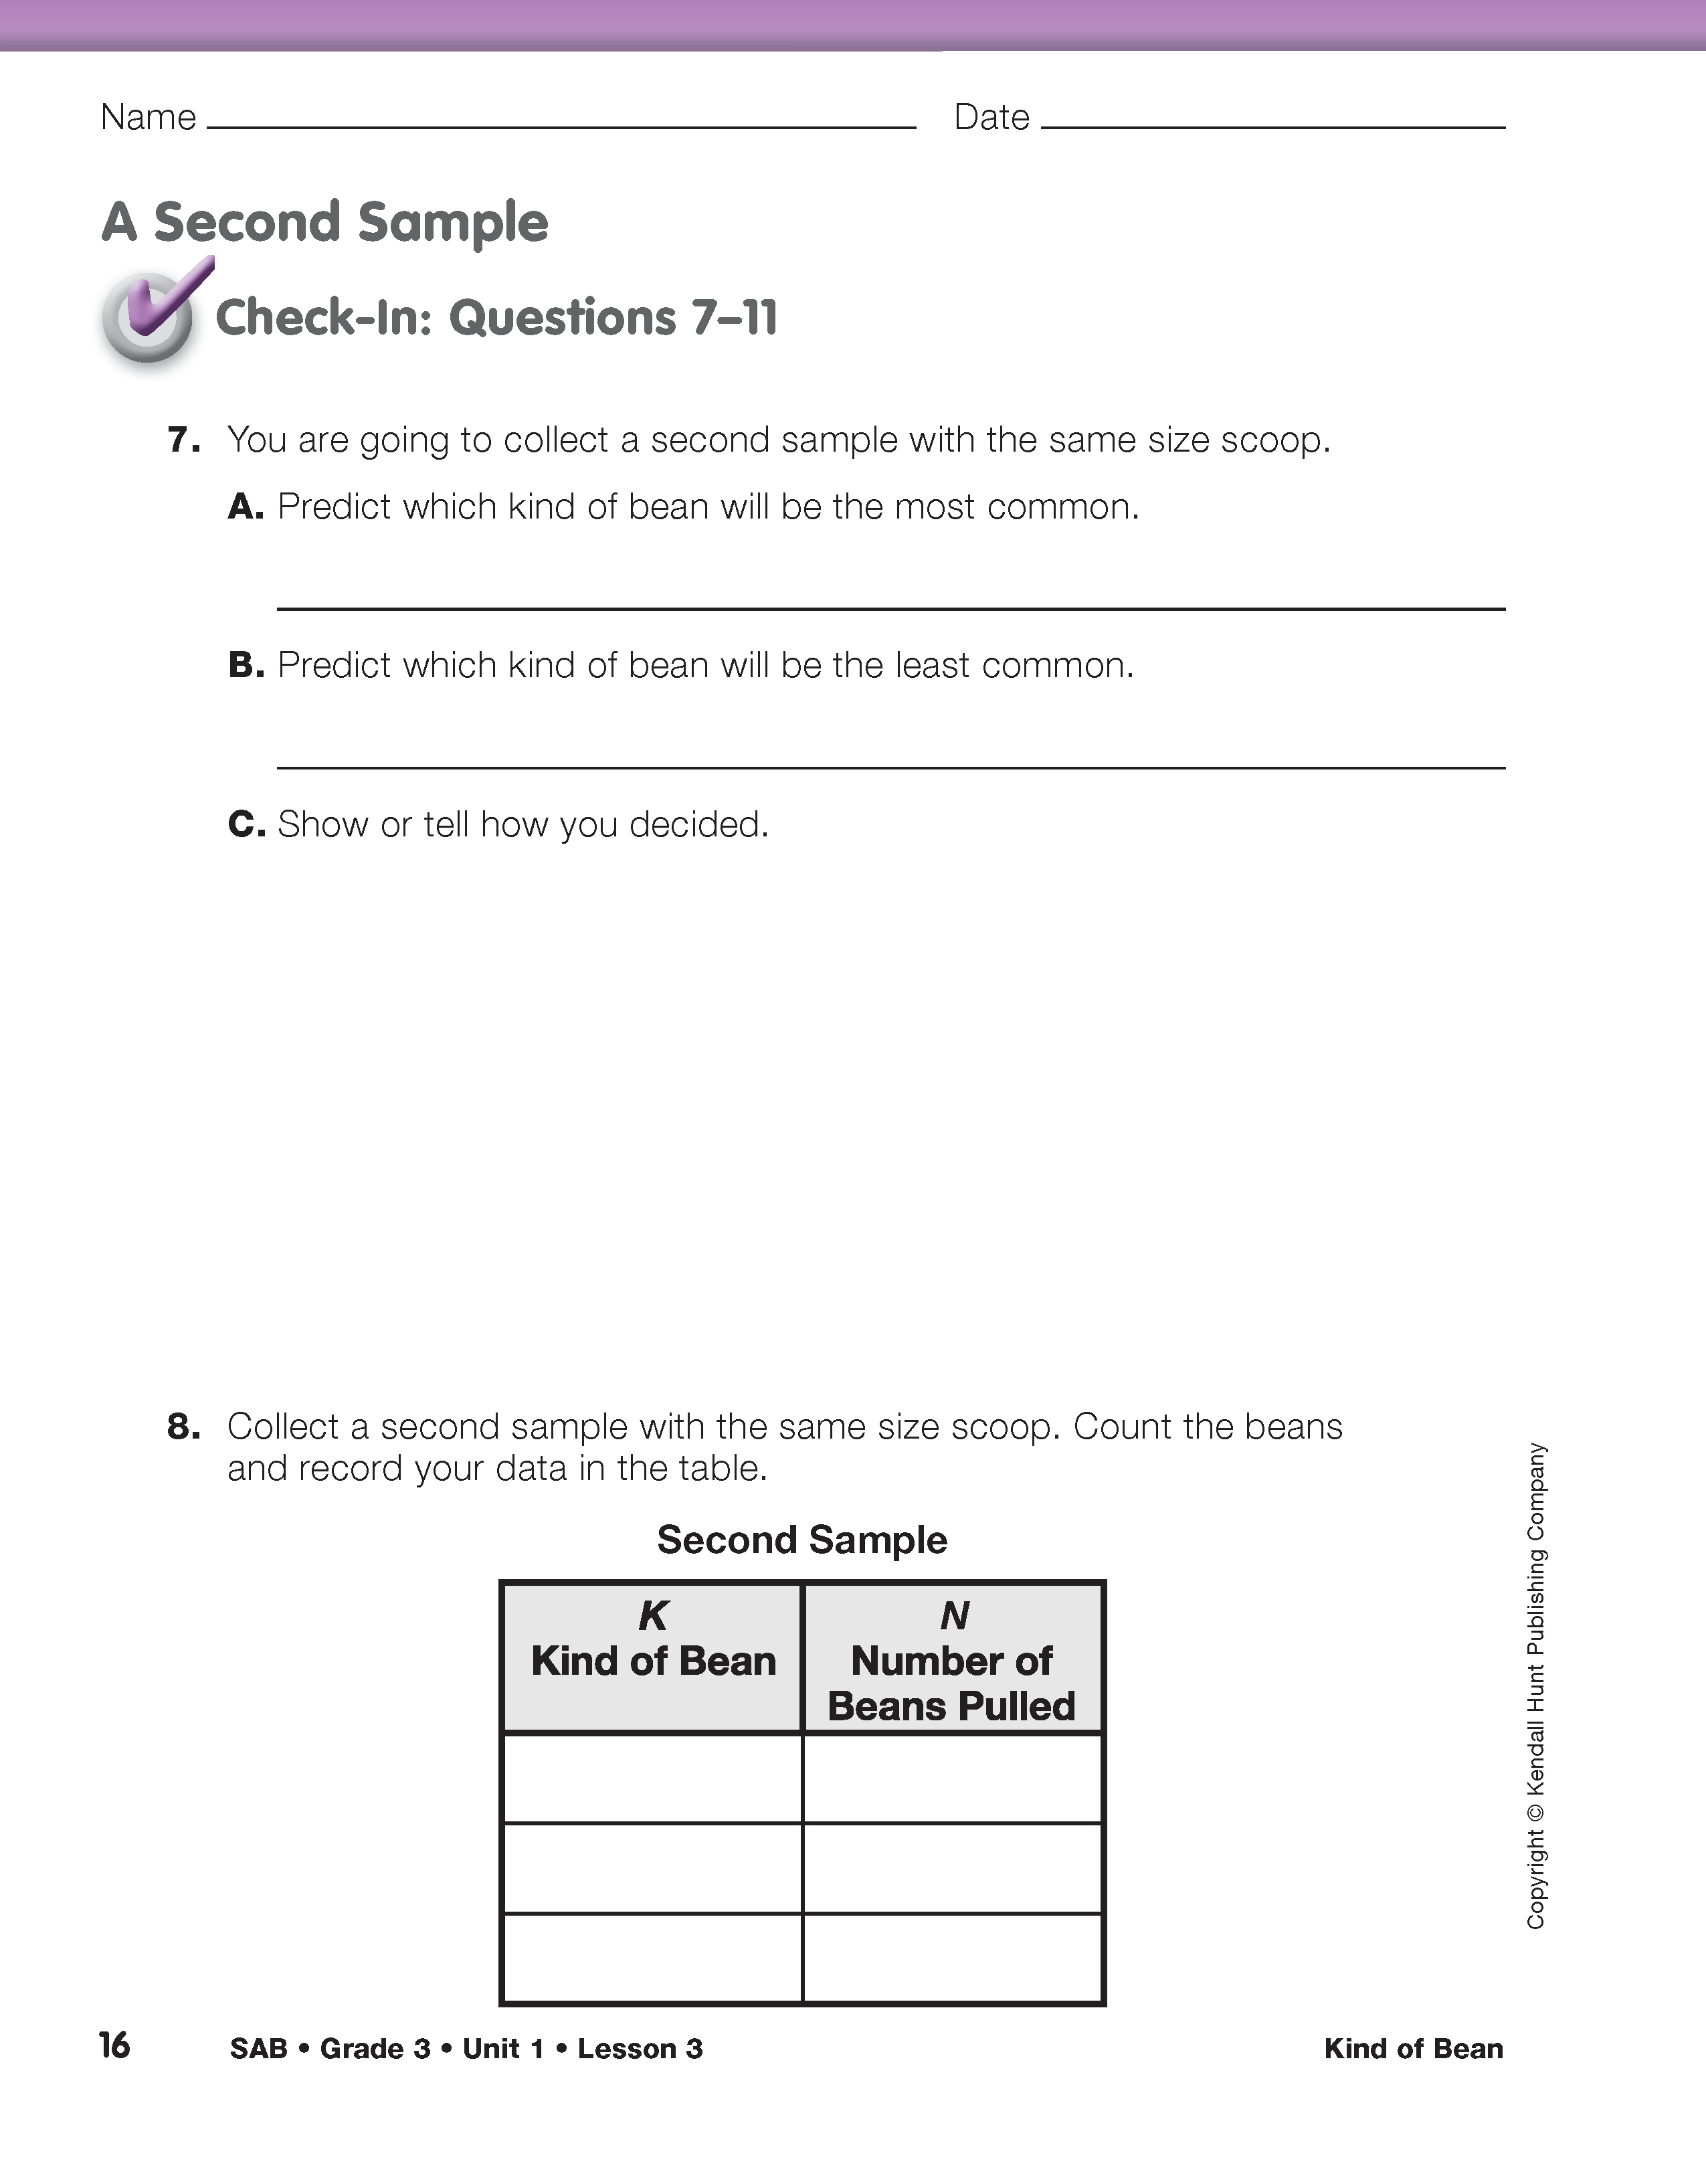
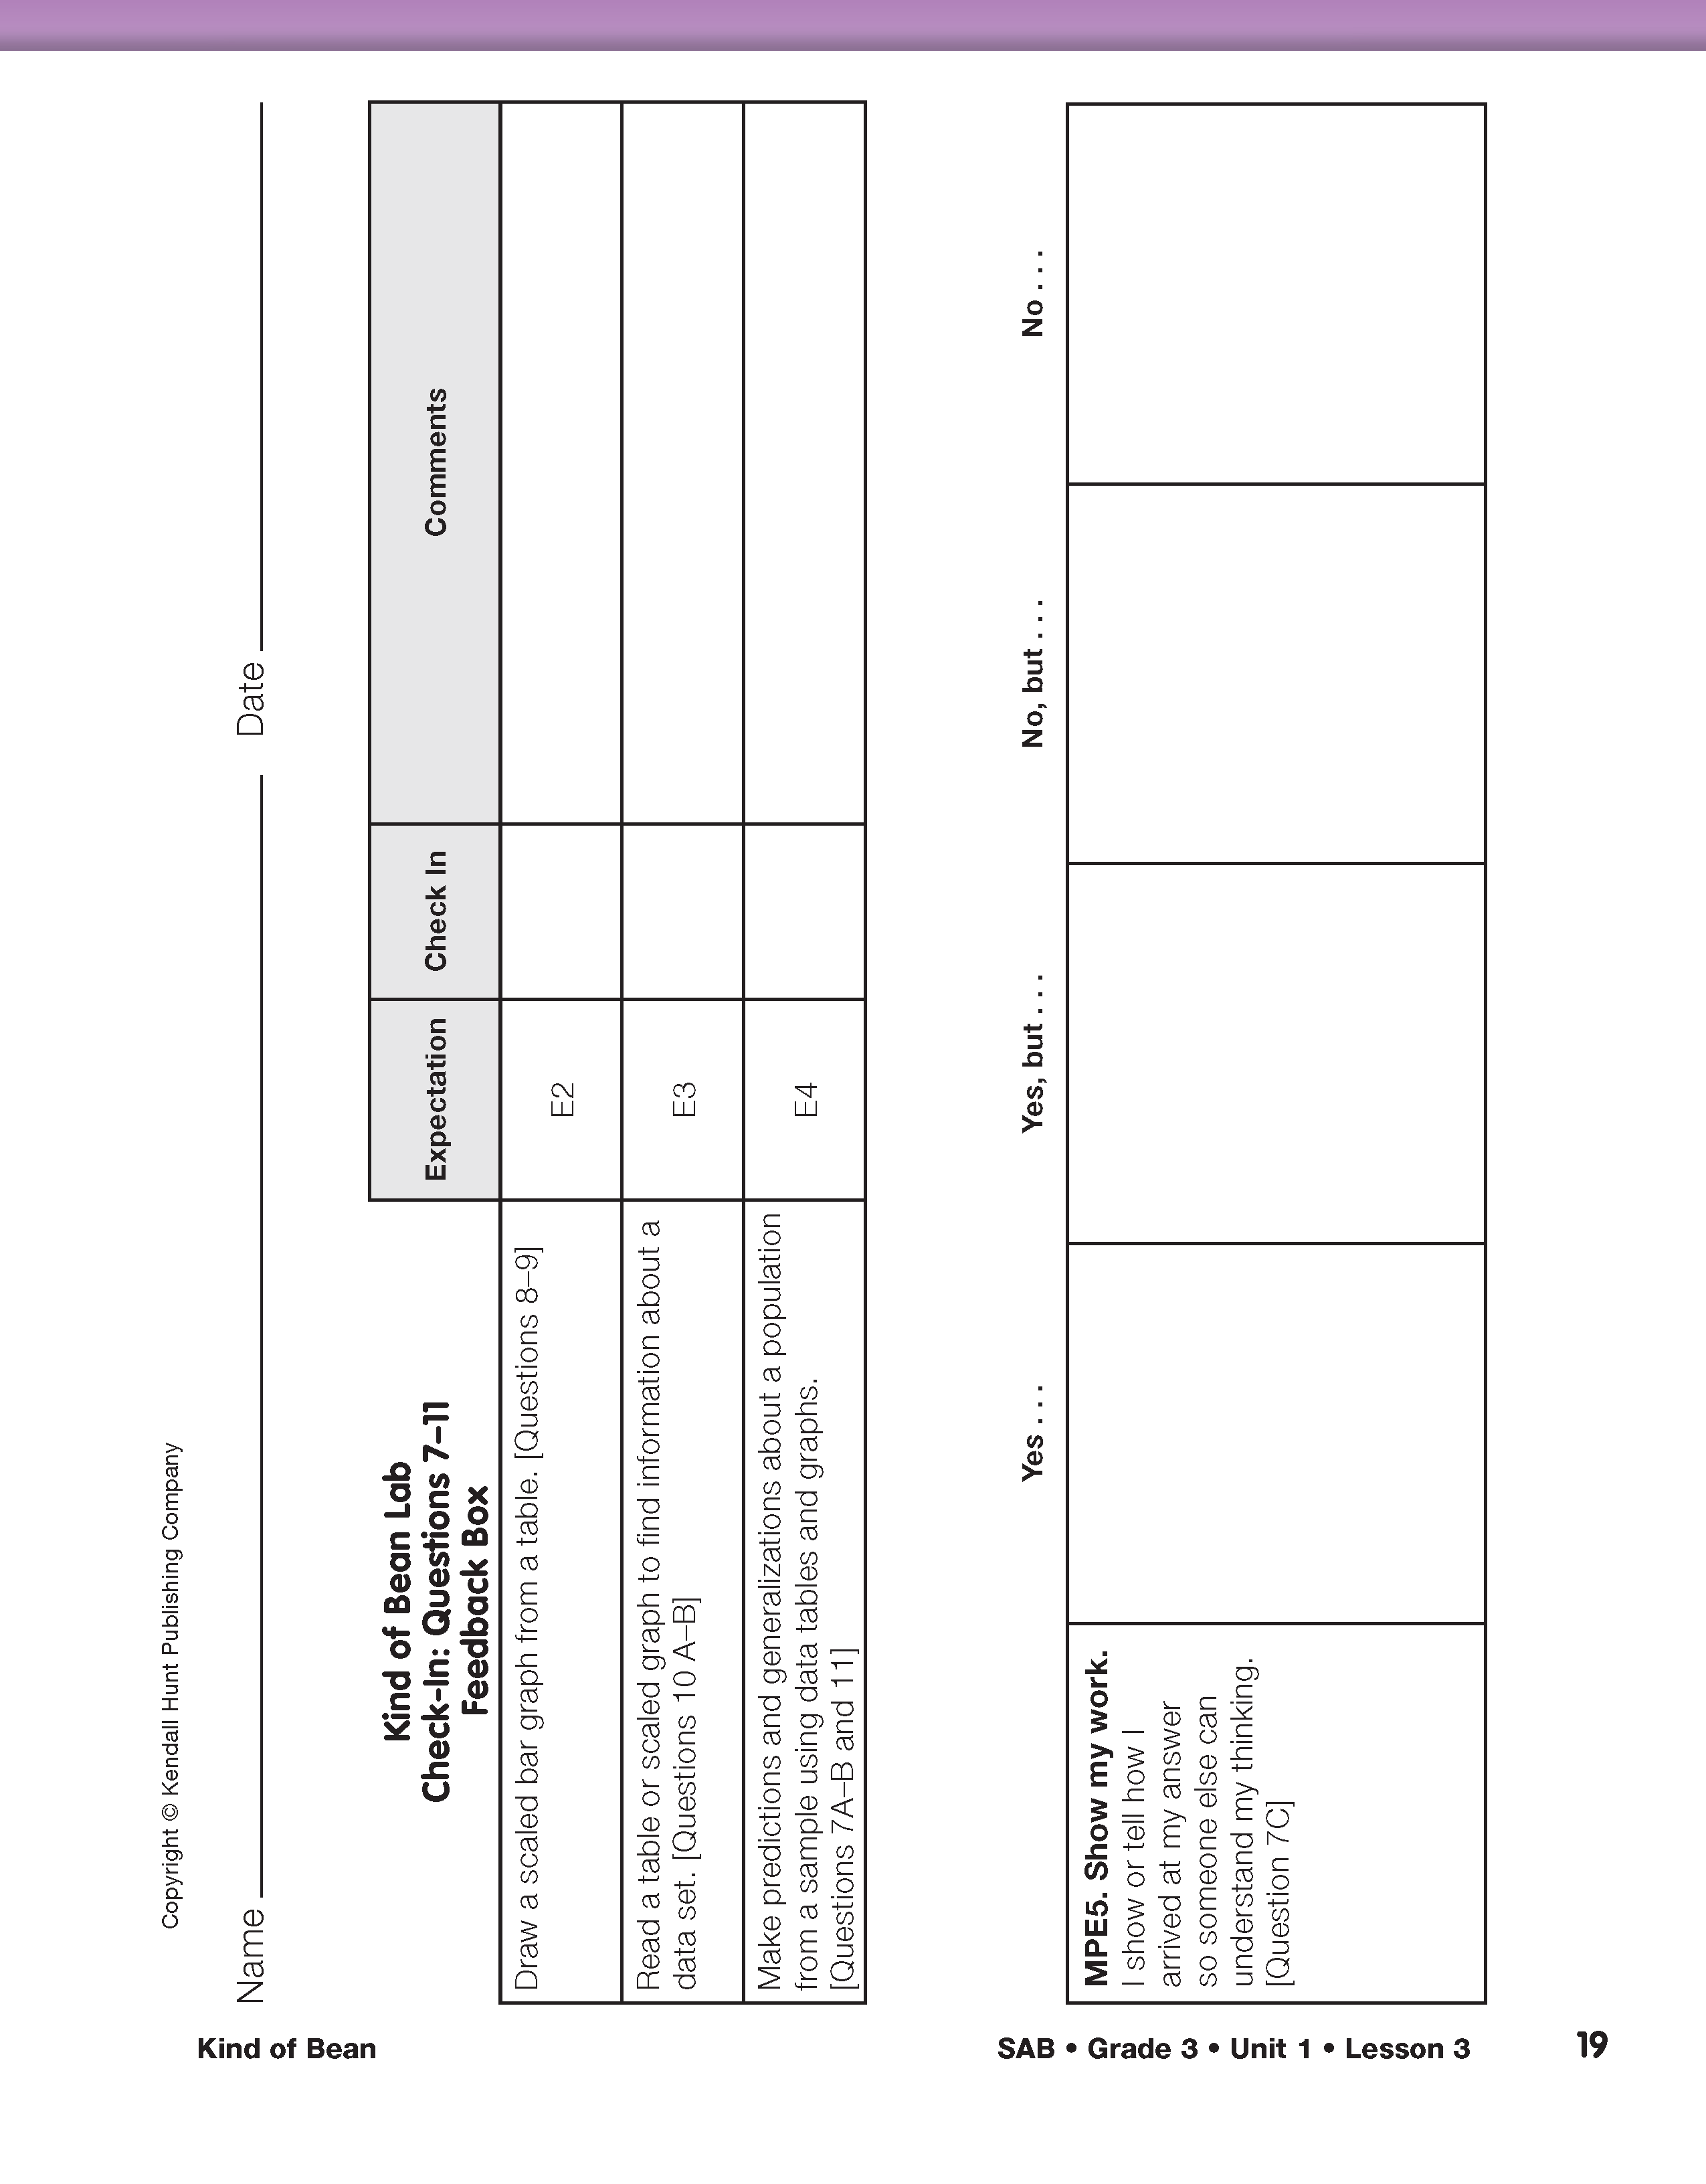
A Second Sample. In Check-In: Questions 7–10, students are asked to make predictions about the beans represented in a second sample using the same scoop.
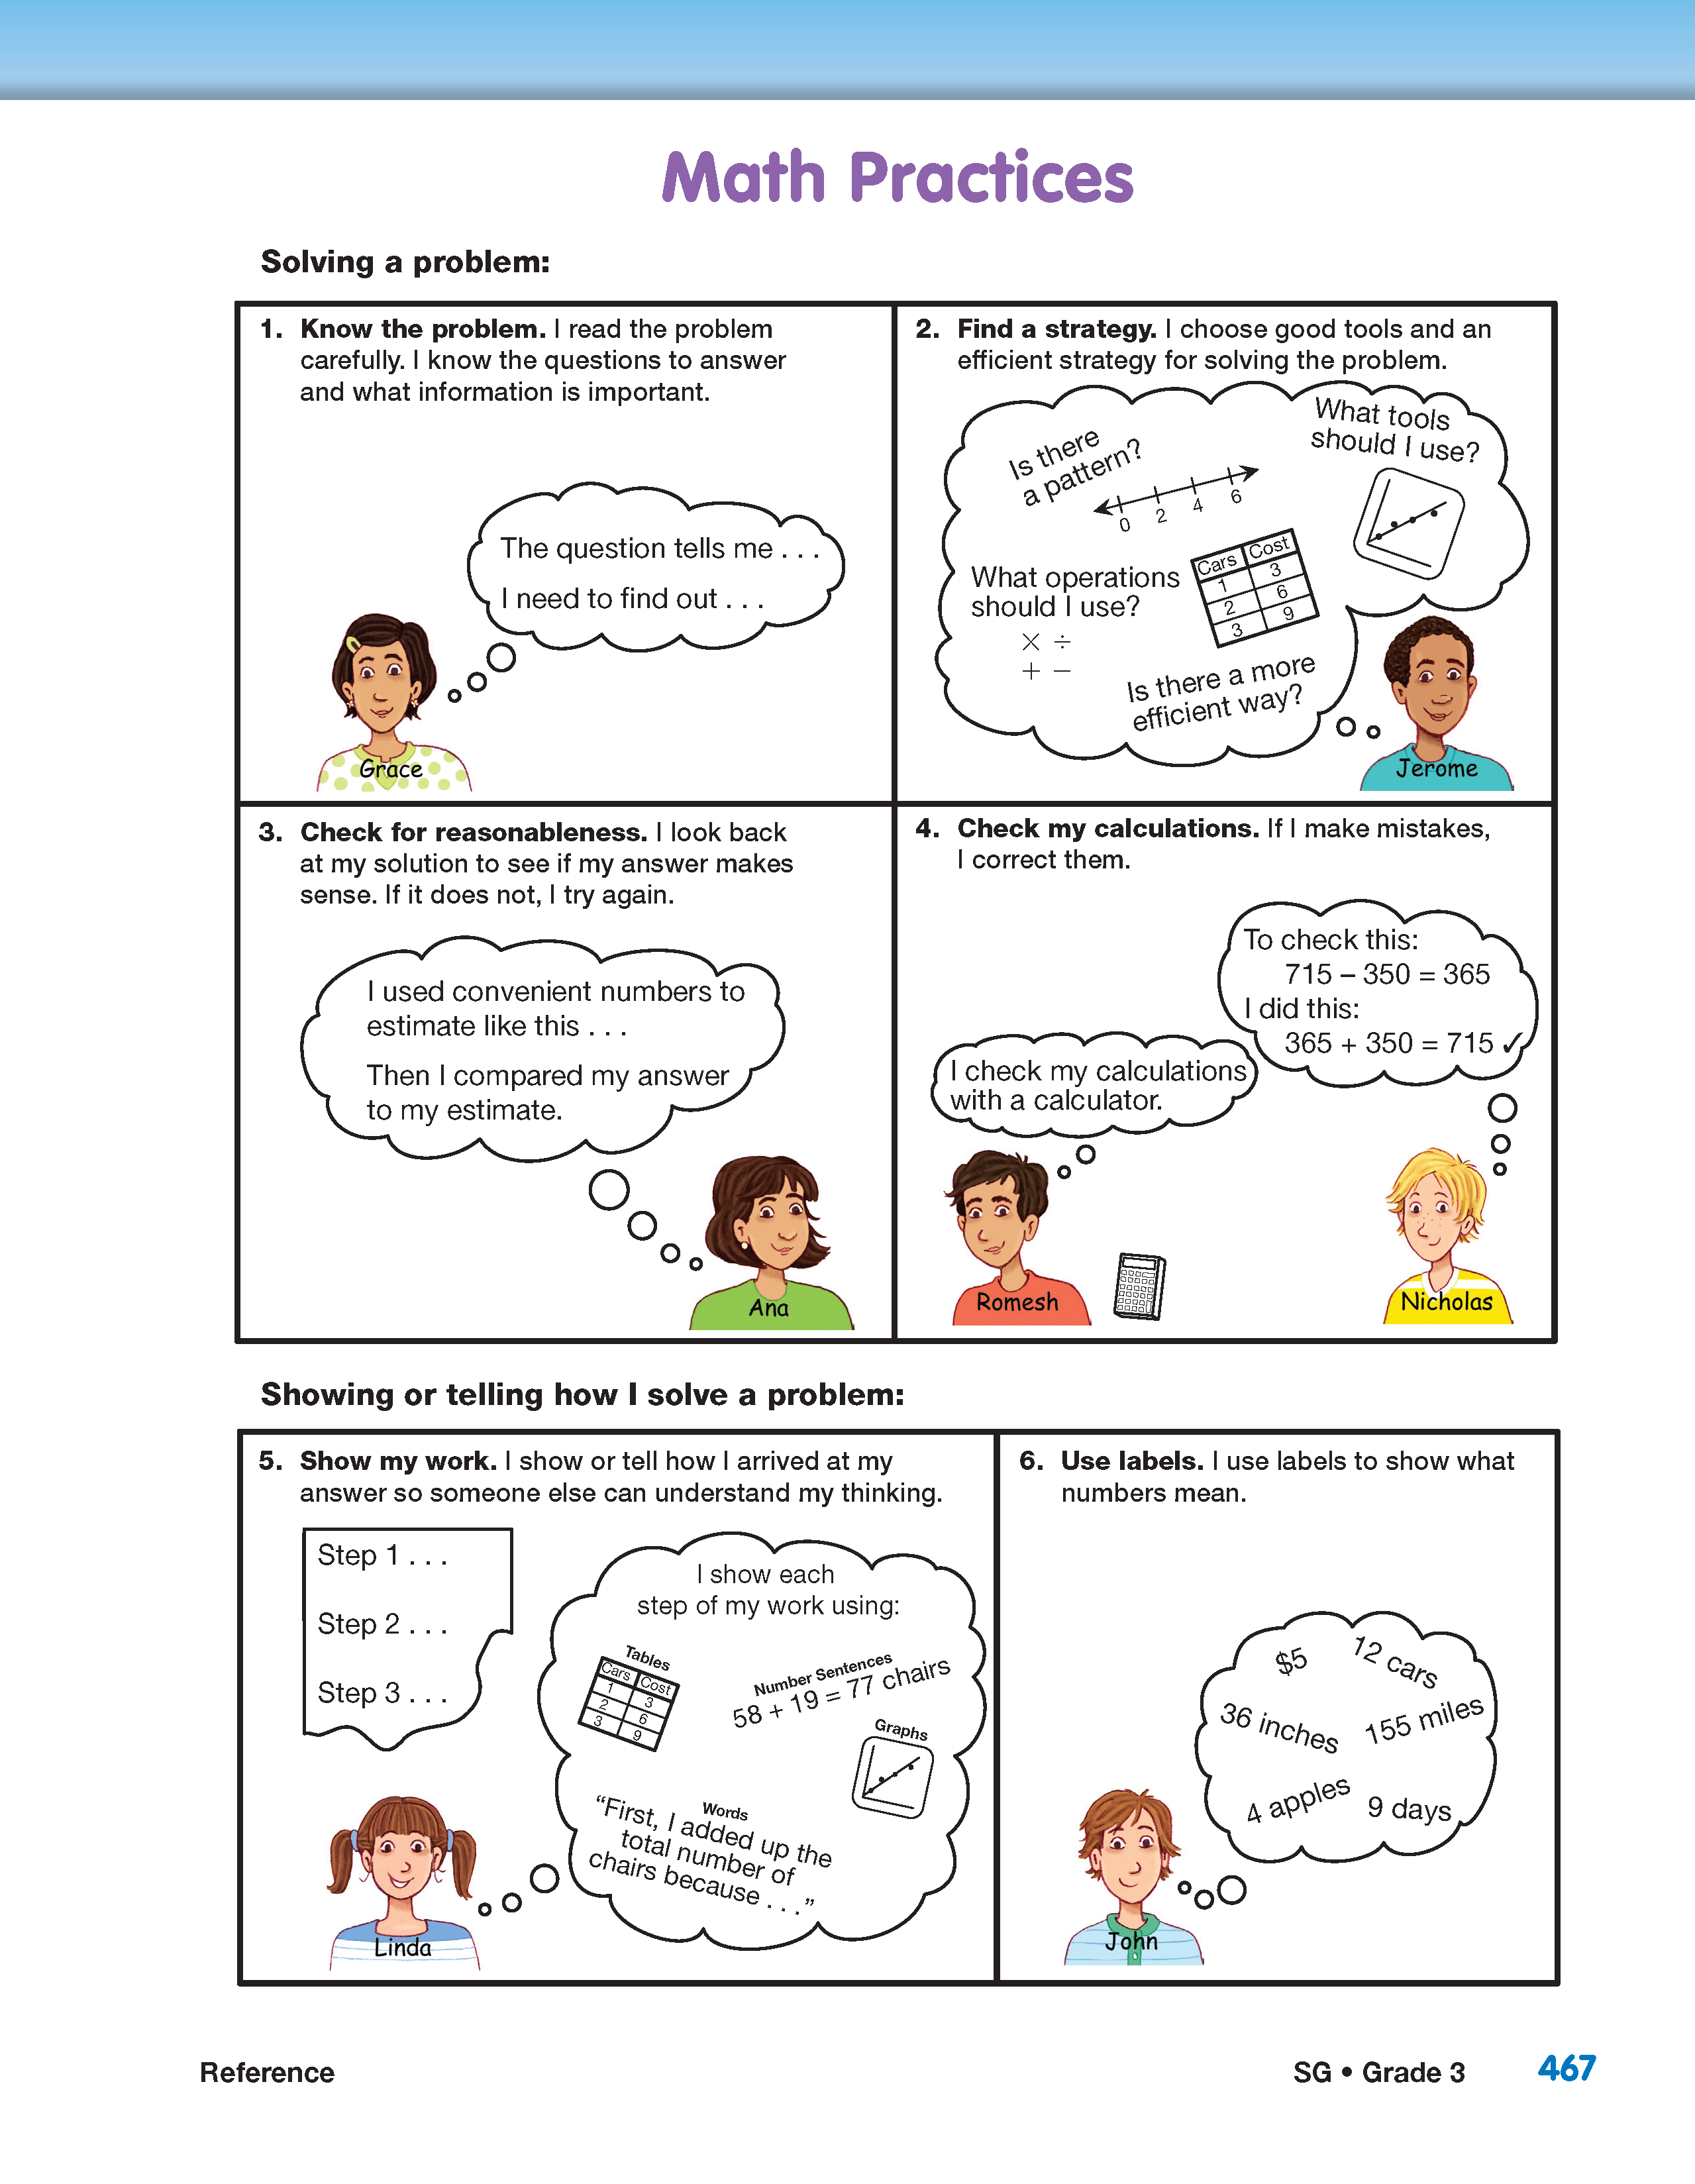
Before asking students to work on Question 7, use the Math Practices page in the Reference section of the Student Guide and the following prompts to guide discussion about the math practices:
Ask students to answer Questions 7A–C independently. While students are working, prepare for groups to take a second sample by putting their first samples back into the large population container.
Student responses for Question 7C should be straightforward and include using their data table and/or their graph of the first sample to make their predictions. A possible prediction:
“I used my graph to make my predictions. The tallest bar on my graph showed the most common bean was the Black Bean and the shortest bar was for the Navy Bean. Since the second sample will come from the same container, I think the same thing will happen.”
Question 8 directs students to take a second sample using the same scoop. Ask one student from each pair to take a second sample of beans from the large container holding the bean population. After sorting and counting the beans in their sample bean population, students are asked to represent their sample population data in a table (Question 8) and a graph (Question 9) and to describe the most common kind of bean in the sample (Question 10).
In Question 11, students are asked to tell if their predictions for their second sample were correct and to explain why or why not. A scientist would expect another pull from the same bean sample to be similar to the first pull. However, it is possible that a second sample could yield different results. Even if this does happen, it is the reasoning behind the prediction that is important. The following paragraph shows a sample student response for a student whose prediction was not accurate.
“I predicted that I would have the most Black Beans and the least Navy Beans. When I took the second scoop I did have the most Black Beans but this time my least was Pinto Beans. I think this happened because the beans weren't mixed up all the way.”
Population Predictions. In Questions 12–13, students use their sample data to make predictions about the bean population. Students can work with their groups to discuss their thinking before completing the questions.
In Question 13, students are asked to think about how the data in their data table and graph will change if they used a larger scoop to pull their sample. Students should articulate that while the number of beans pulled will be larger, the most and least common type of bean would likely remain the same for this sample. This will be reflected in both the data table and the graph.