Ask students to look back at Who Is Right? in the Student Guide.
- Tara and Kim's data was different from Mark and Jason's data, but both of their data tables were correct. How can that be? (Possible response: Each of the pairs took their own sample, so the numbers will not be exactly the same, just close.)
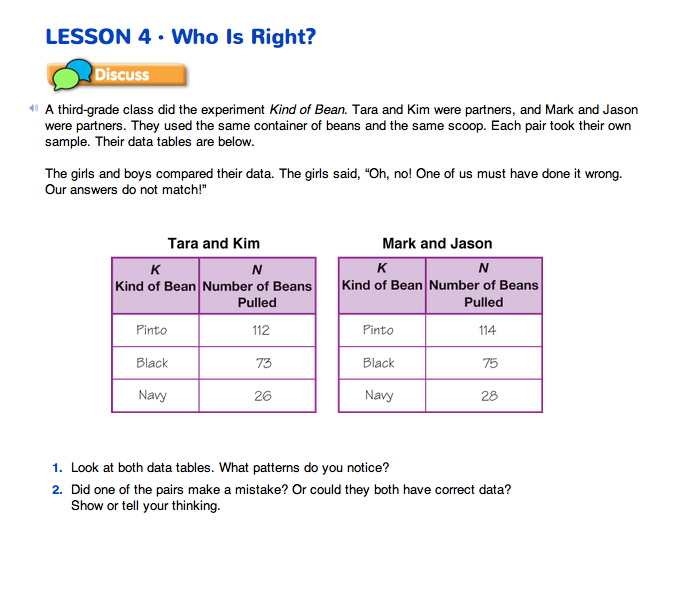
- What are some of the patterns in the data table that help you know that both data tables are correct? (Possible response: Both groups pulled about the same amount of beans for their samples. In both samples, Pinto beans were the most and Navy beans were the least. The numbers for all three kinds of beans were similar in both samples.)
- How can a graph help you decide which tub of beans was used? (Possible response: The tallest bar on the graph was for Pinto beans and it was 112. The data table for the Second Tub had Pinto beans as the largest number and it was 115. That is close to 112. The smallest bar on the graph was for Navy beans and it was 26. The data table for the Second Tub also had Navy beans as the smallest number and it was 24. That is close to 26. Both the graph and the data table for the Second Tub had Black beans in the middle, and the numbers 70 and 73 for Black beans were close. The data table for the First Tub was totally different because it had Black beans as the most.)