Lesson 1

First Names

Est. Class Sessions: 3
X

Mathematical Standards

3.MD.B
Represent and interpret data.
(3.MD.B.3)

Standards for Mathematical Practice

MP1.
Make sense of problems and persevere in solving them.
MP2.
Reason quantitatively.
MP4.
Model with mathematics.
MP5.
Use appropriate tools strategically.

This teacher-guided lab is an exploration of the lengths of students' first names. The class collects and organizes data in a table and graph so students can make predictions and generalizations about a population; specifically, the length of first names.

Content in this Lesson

  • Identifying variables of an investigation.
  • Collecting, organizing, and graphing data.
  • Reading a table or bar graph to find information about a data set [E3].
  • Making predictions and generalizations about a population from a sample using data tables and graphs [E4].
X

Materials for Students

Daily Practice and Problems Lesson Homework Assessment

Student Books

Student Guide
Student Activity Book

Teacher Resources

Teacher Guide - digital

Supplies for Students

  • self-adhesive note

Materials for the Teacher

Materials Preparation

  • Create a Class Data Table. Create a table on chart paper to collect student data. See Figures 2 and 3.
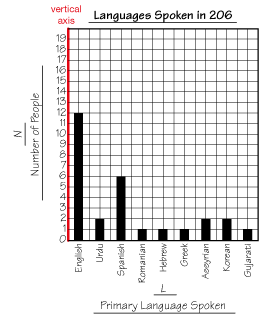
  • Create a Class Graph. Prepare to make a large class graph on chart paper. See Figure 4.
  • Professor Peabody's Broken Clock. Use the Clock Master to make Professor Peabody's broken clock for DPP item E. Cut out and attach only the hour hand with a brad.

Assessment in this Lesson

Assessment Expectation Assessed
Lisa's Class Graph with
Feedback Box
Teacher Guide - digital
E3.
Read a table or scaled graph to find information about a data set.
E4.
Make predictions and generalizations about a population from a sample using data tables and graphs.