


Kind of Bean
Est. Class Sessions: 3Developing the Lesson
Part 1: Analyze Population Problems
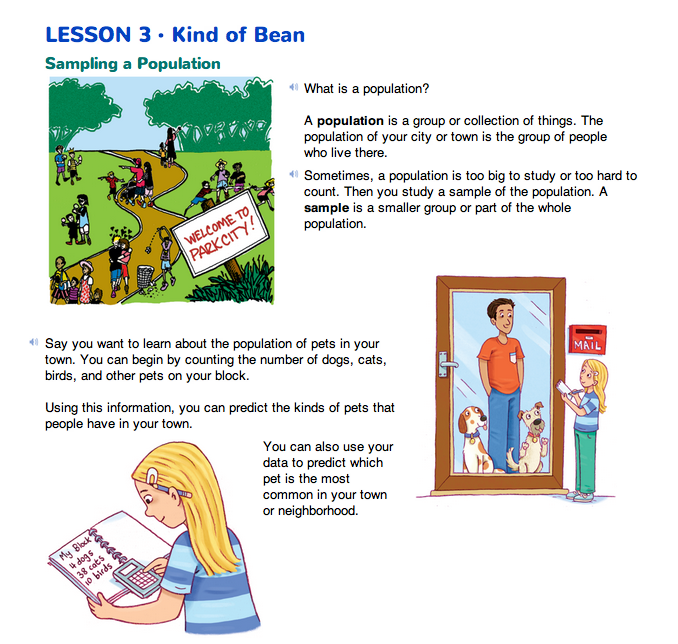
Use Sampling and the TIMS Laboratory Method to Study Populations. This lab involves learning about a population through sampling. Students will sample a collection of three types of beans to model sampling an animal population. Begin by discussing important applications such as estimating wildlife populations. Explain that sampling may be applied to situations closer to students' lives. For example, they can estimate the number of squirrels, pigeons, cats, or dogs in their neighborhoods.
Use the Kind of Bean pages in the Student Guide to depict the use of the sampling process and the four steps of the lab method to investigate a population. These pages illustrate an important point: Even when a population cannot be directly studied, we can still draw some conclusions about that population by sampling it and doing some clever thinking.

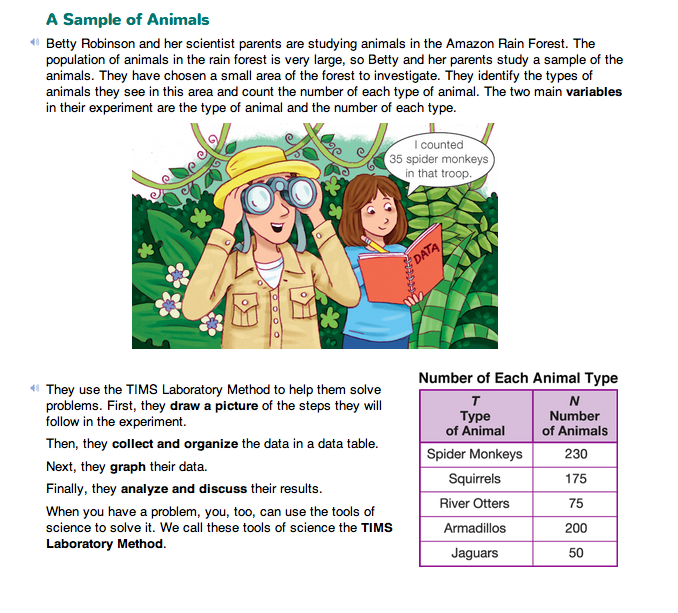
Represent Sample Population Data. Questions 1–3 discuss the variables in the scientists' investigation of animals in the rain forest. Identifying the variables is an important part of any experiment. Questions 4–5 help students distinguish between the variables and the values of those variables. In the Robinsons' experiment, the values of the variable Type of Animal are the names of the animals they chose to study: spider monkeys, squirrels, river otters, armadillos, and jaguars. The values of the variable Number of Animals are the numbers of the animals they counted while conducting the experiment. These are recorded in the second column of the data table.
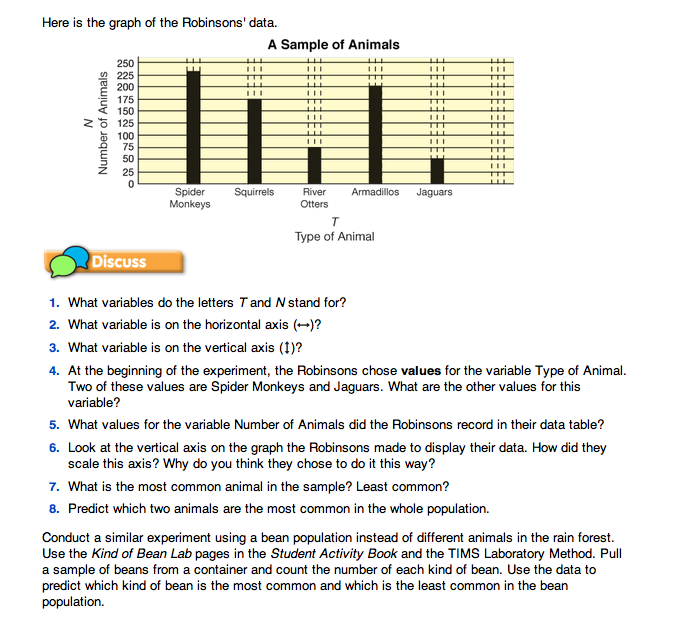
Question 6 asks students to examine the vertical axis and the way it is scaled. Make sure students understand that there are values between each of the points on the vertical axis. For example, the bar representing 230 Spider Monkeys stops slightly above the value of 225.
Make Predictions about the Population.
Question 7 provides practice in reading a bar graph similar to the one students will make and read later in the lesson.
Question 8 asks them to make a prediction about the population from the sample data.
Draw attention to the features of the data table and graph:
- column headings in the data table indicate the variables—type of animal and number of animals
- the symbols N and T are used to stand for the variables
- the labels on the horizontal axis and vertical axis indicate the variables being studied
- the values for type of animal on the horizontal axis
- the scaling for the values on the vertical axis
- bars that accurately reflect the data
- title of the graph