


Using Picture Graphs
Est. Class Sessions: 1–2Developing the Lesson
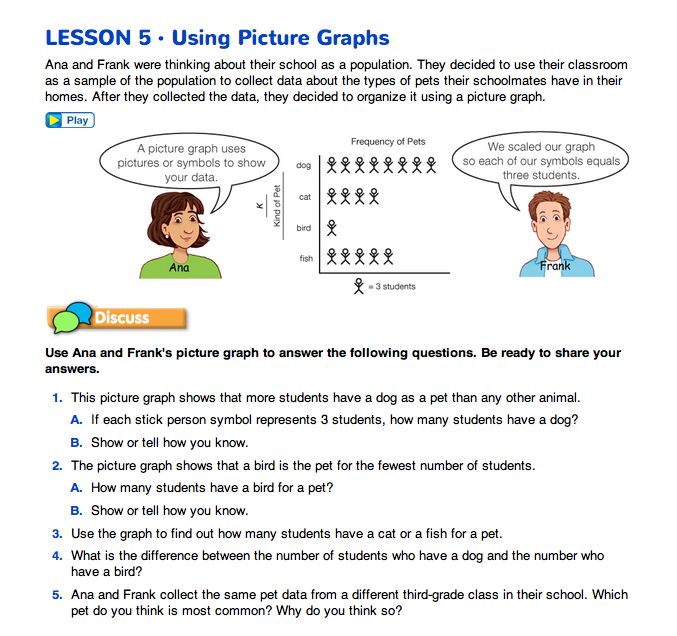
Introduce Picture Graphs. Have students open their Student Guide to the Using Picture Graphs pages. Use the following questions to begin a discussion about using picture graphs (graphs that use pictures to display data).
Ask:

Students work with a partner or in a small group to discuss Questions 1–5. After they have had an opportunity to discuss the problems, use the questions to guide a class discussion.
Read and Use Picture Graphs. To answer Questions 1–3, students need to understand that each symbol on the graph is equal to 3 students. Students can skip count by 3s or use addition to solve each of these questions.
In Question 4, students compare the number of students who have a dog as a pet with the number who have a bird. Some students will find the total number of students who have a dog and the total number of students who have a bird and then use subtraction to find this answer. Others will realize that there are 5 more symbols for dogs than there are for birds and will skip count by 3s or use repeated addition to find their answer.
Students are asked to predict the results of a second sample in Question 5. Since both of the third-grade classrooms are part of the total population of the school, it would be reasonable to expect that the largest number of students will have a dog as a pet and the fewest number of students will have a bird.
Practice with Picture Graphs. The Picture Graph pages in the Student Activity Book provide additional practice with picture graphs. Students work with a partner or in a small group to complete Questions 1–4. Ask individuals to share their answers. Use this discussion to check for understanding before assigning Check-In: Questions 5–10.
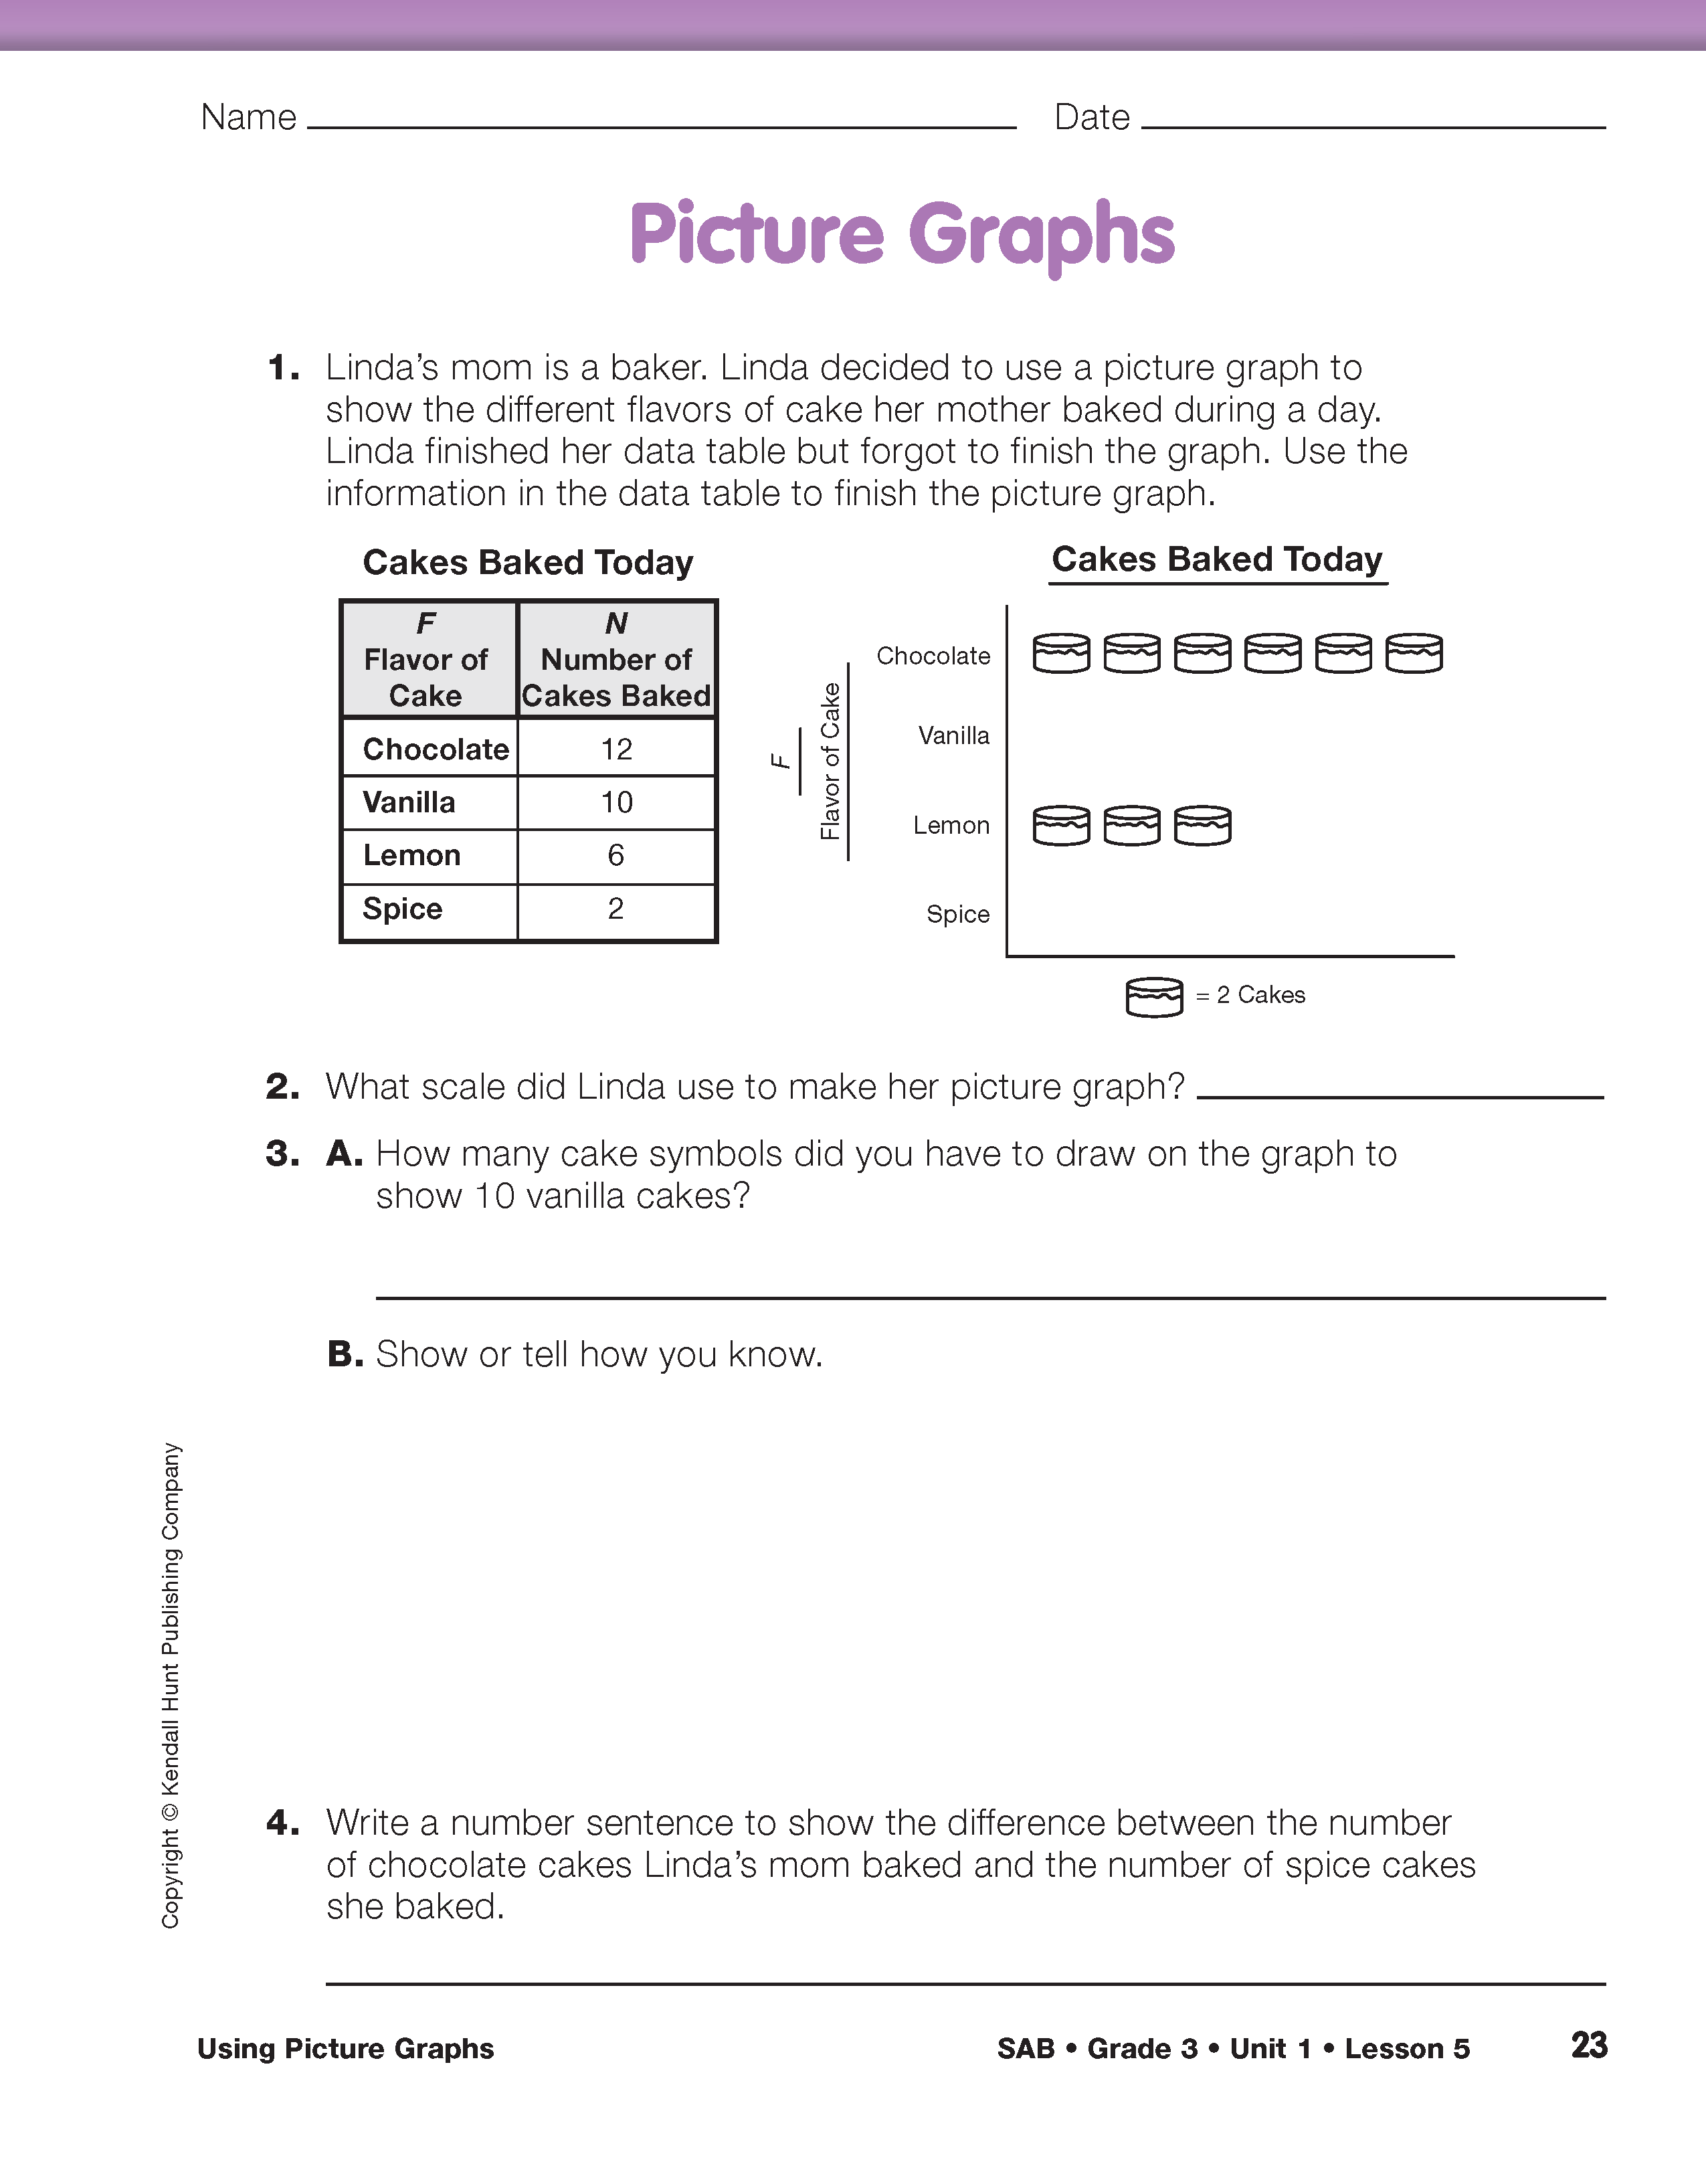
For Question 1, draw the incomplete picture graph on the board or display a copy of the page. Ask students to use the information in the data table to complete the picture graph.
In Questions 2–3, the scale used on this graph is one cake symbol equals 2 cakes. This means that students will draw 5 cake symbols to show that ten vanilla cakes were baked.
Students write a number sentence to show the difference between the number of spice cakes baked and the number of chocolate cakes baked in Question 4.
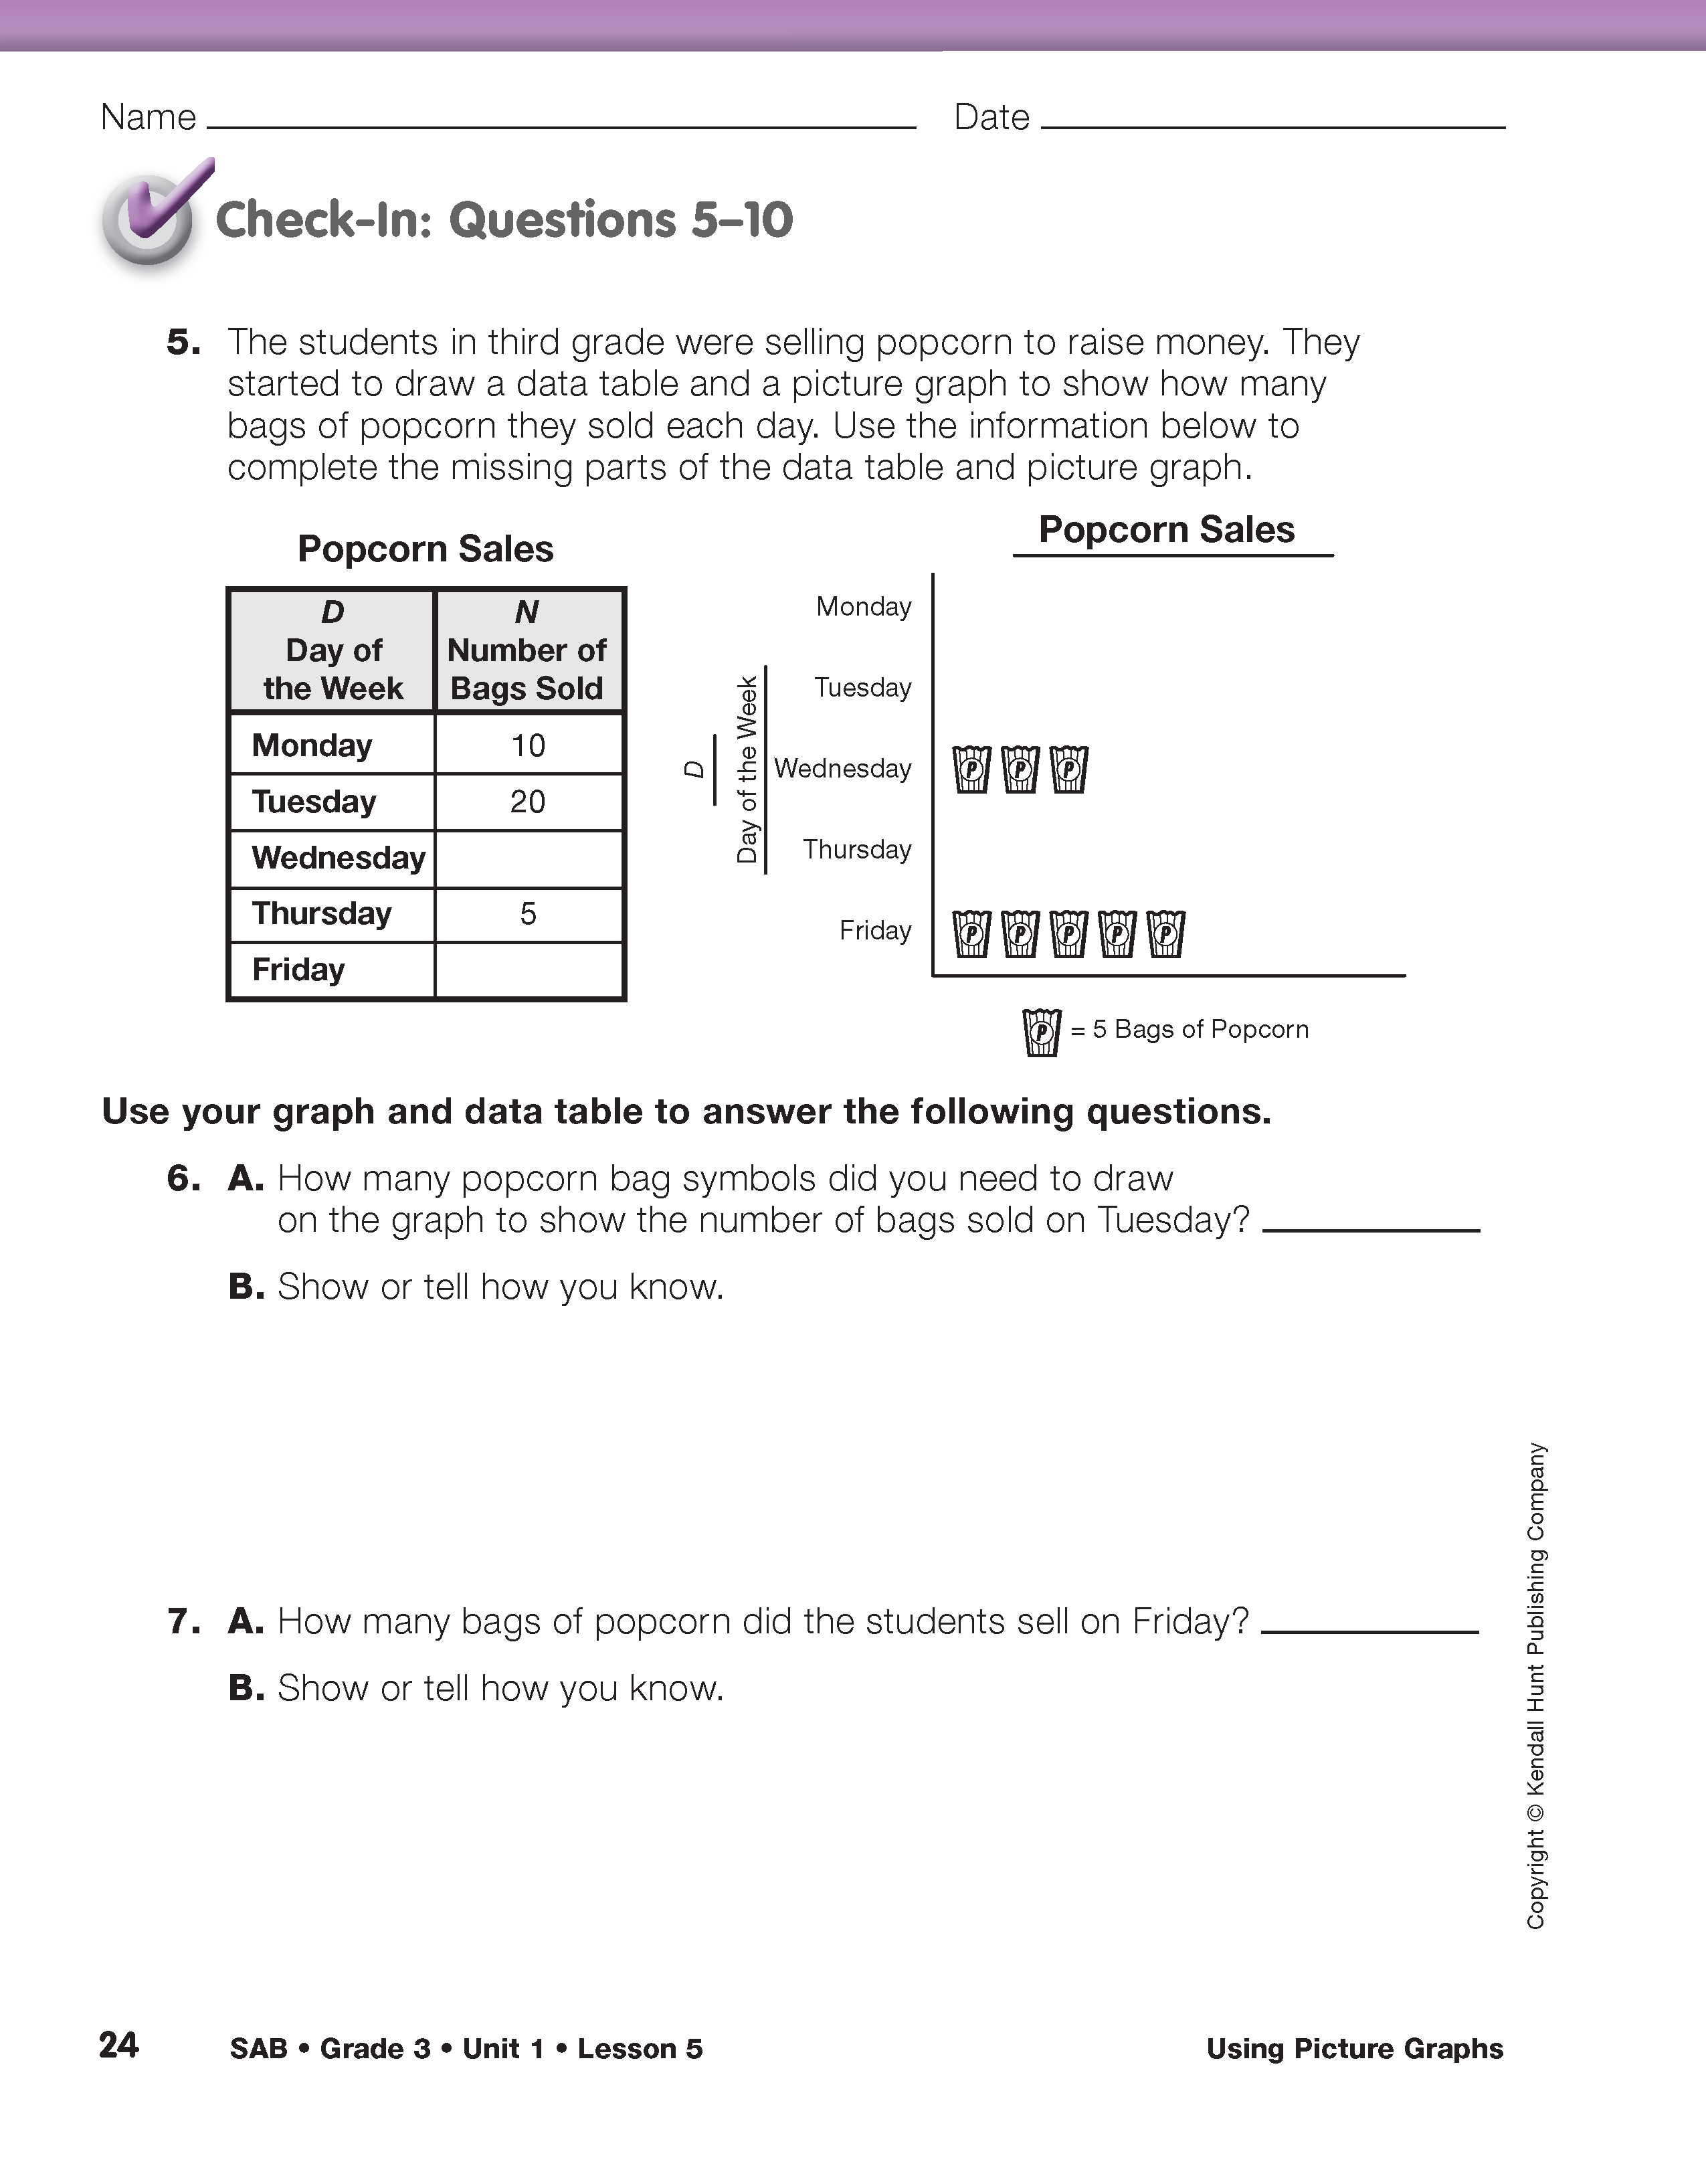
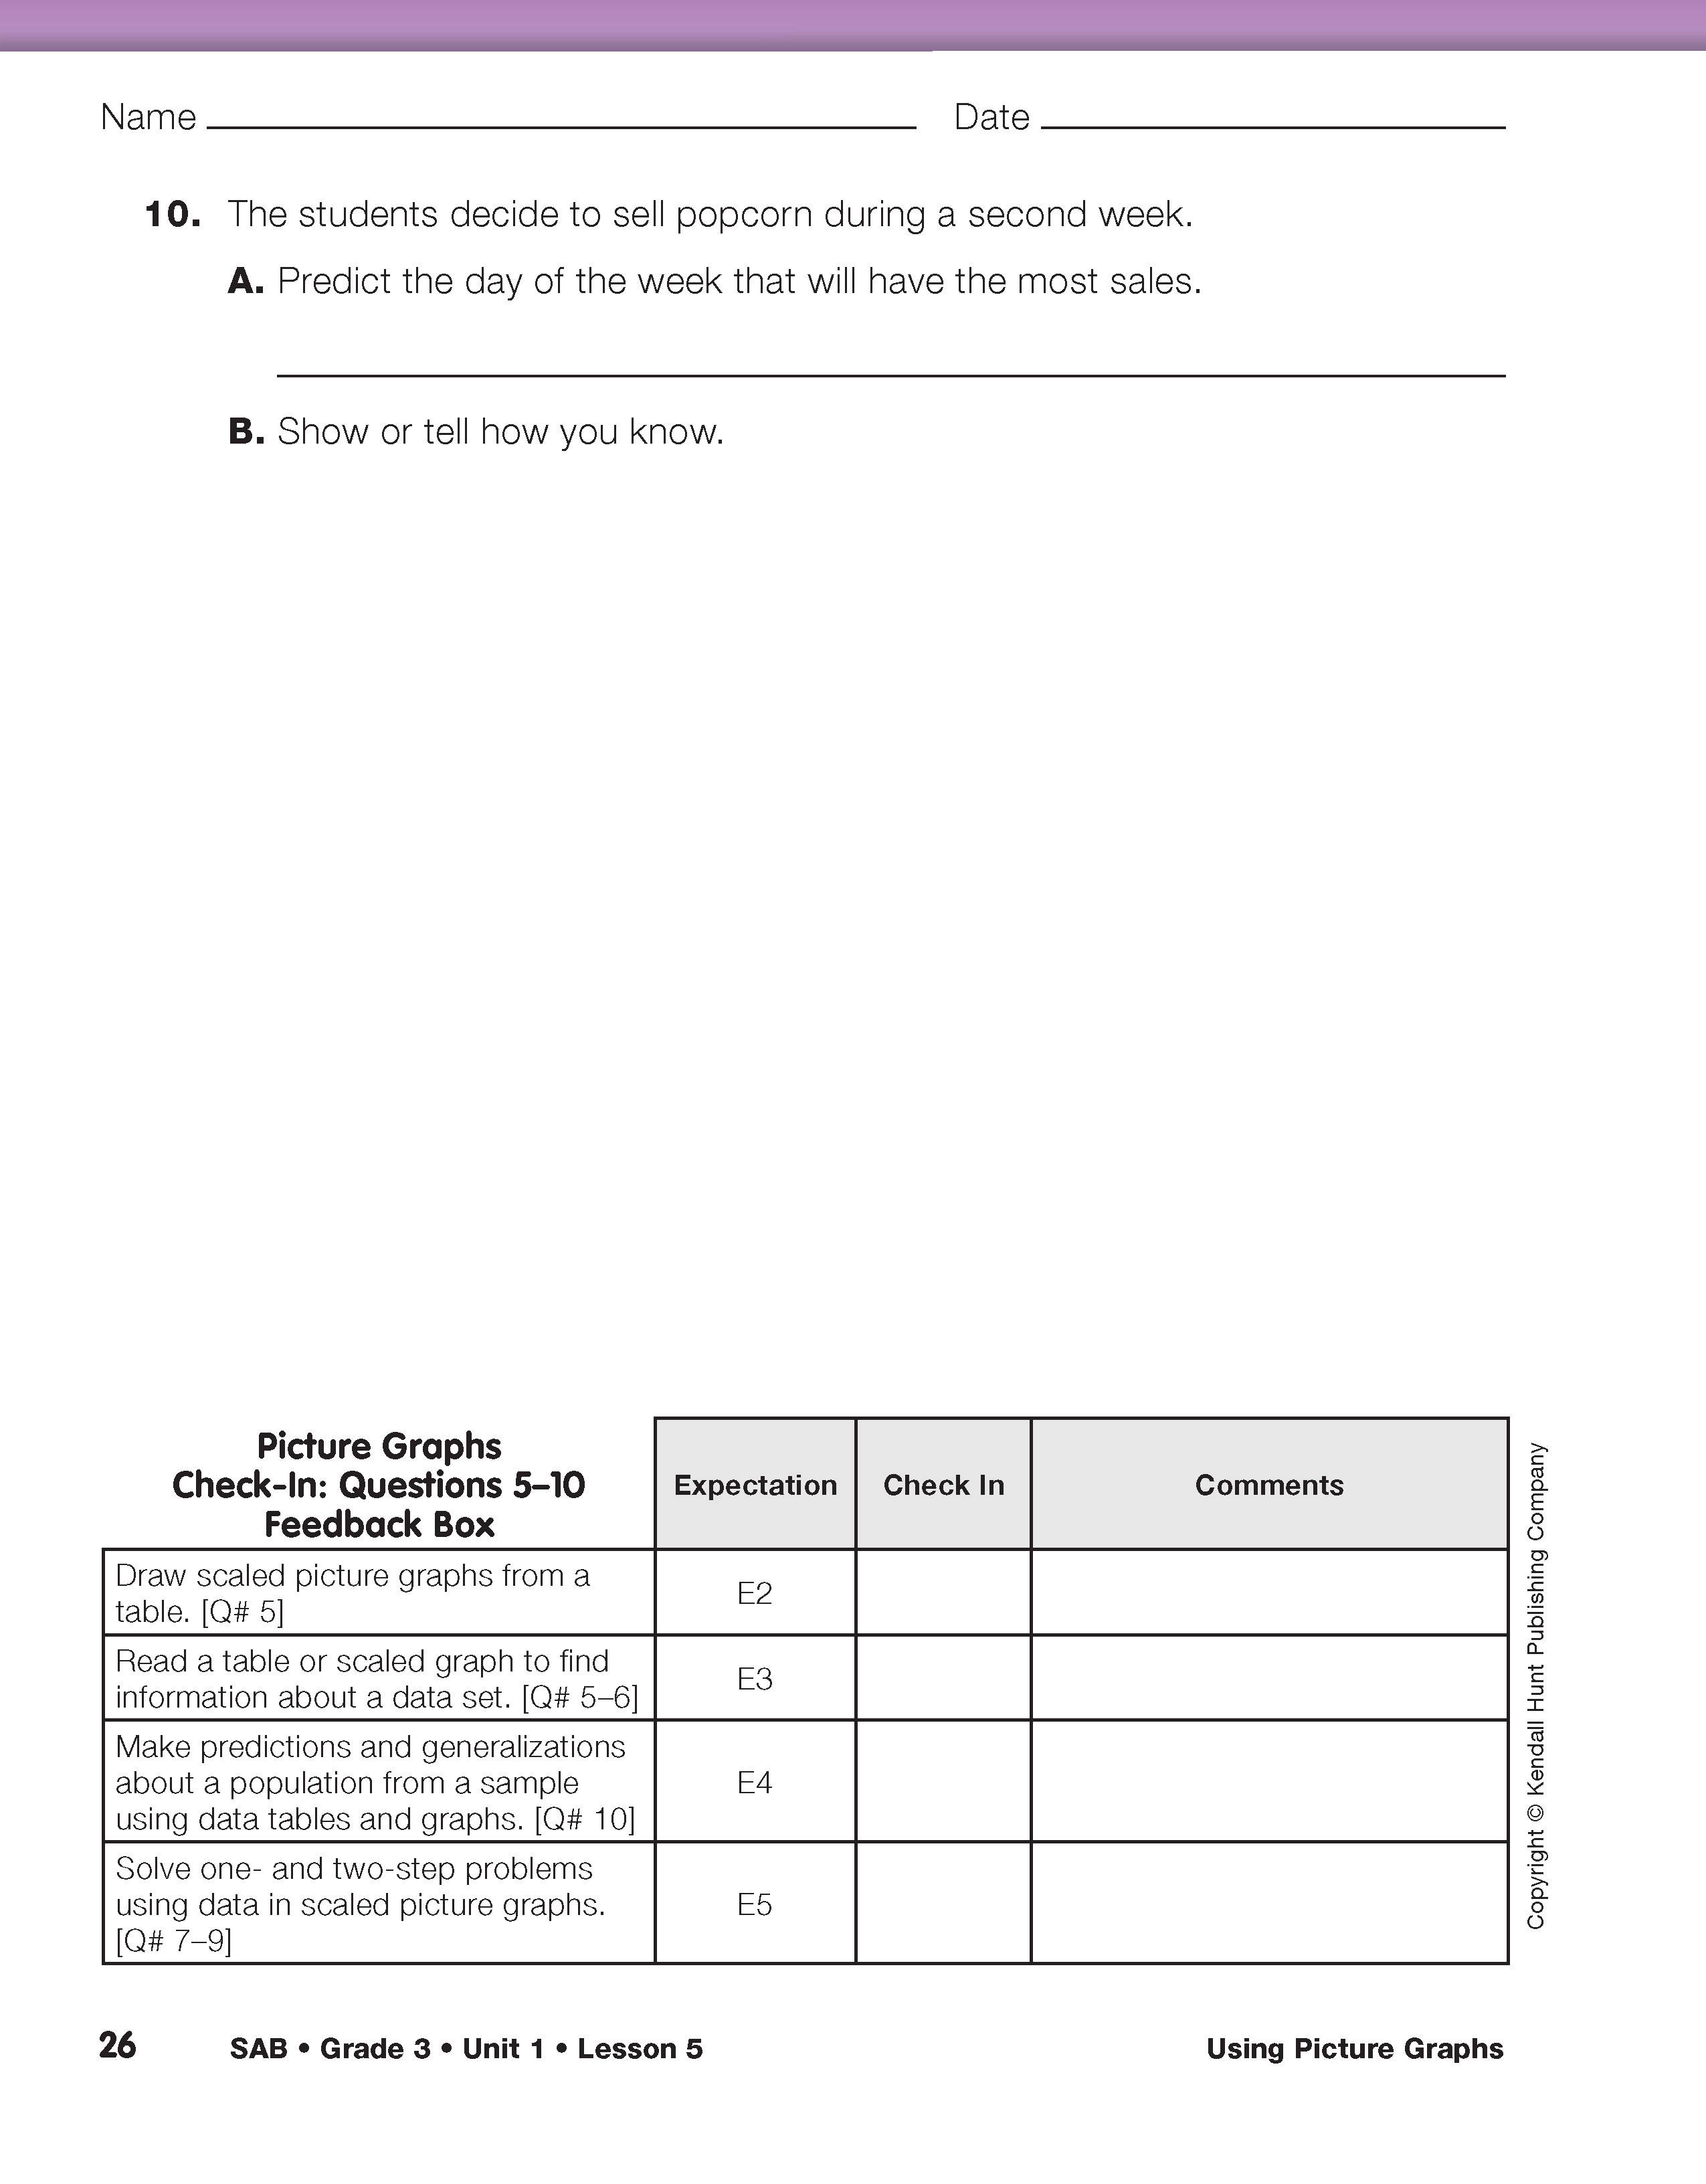
Ask students to complete Check-In: Questions 5–10 independently to assess their understanding of picture graphs.

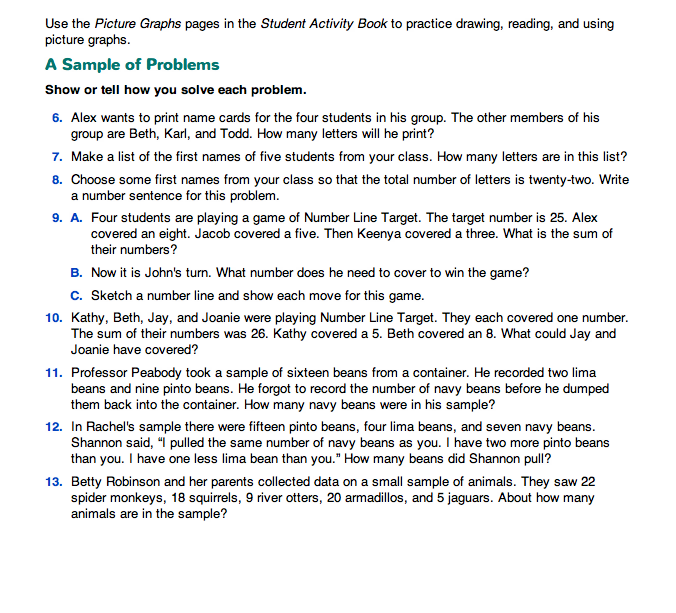
A Sample of Problems. Students complete Questions 6–13 in the A Sample of Problems section of the Using Picture Graphs pages in the Student Guide.
These word problems provide practice with computation, estimation, and critical-thinking skills. Many problems challenge students to use their knowledge of mathematics in new situations. This will encourage students to think through each problem rather than simply applying the same procedure to several problems.