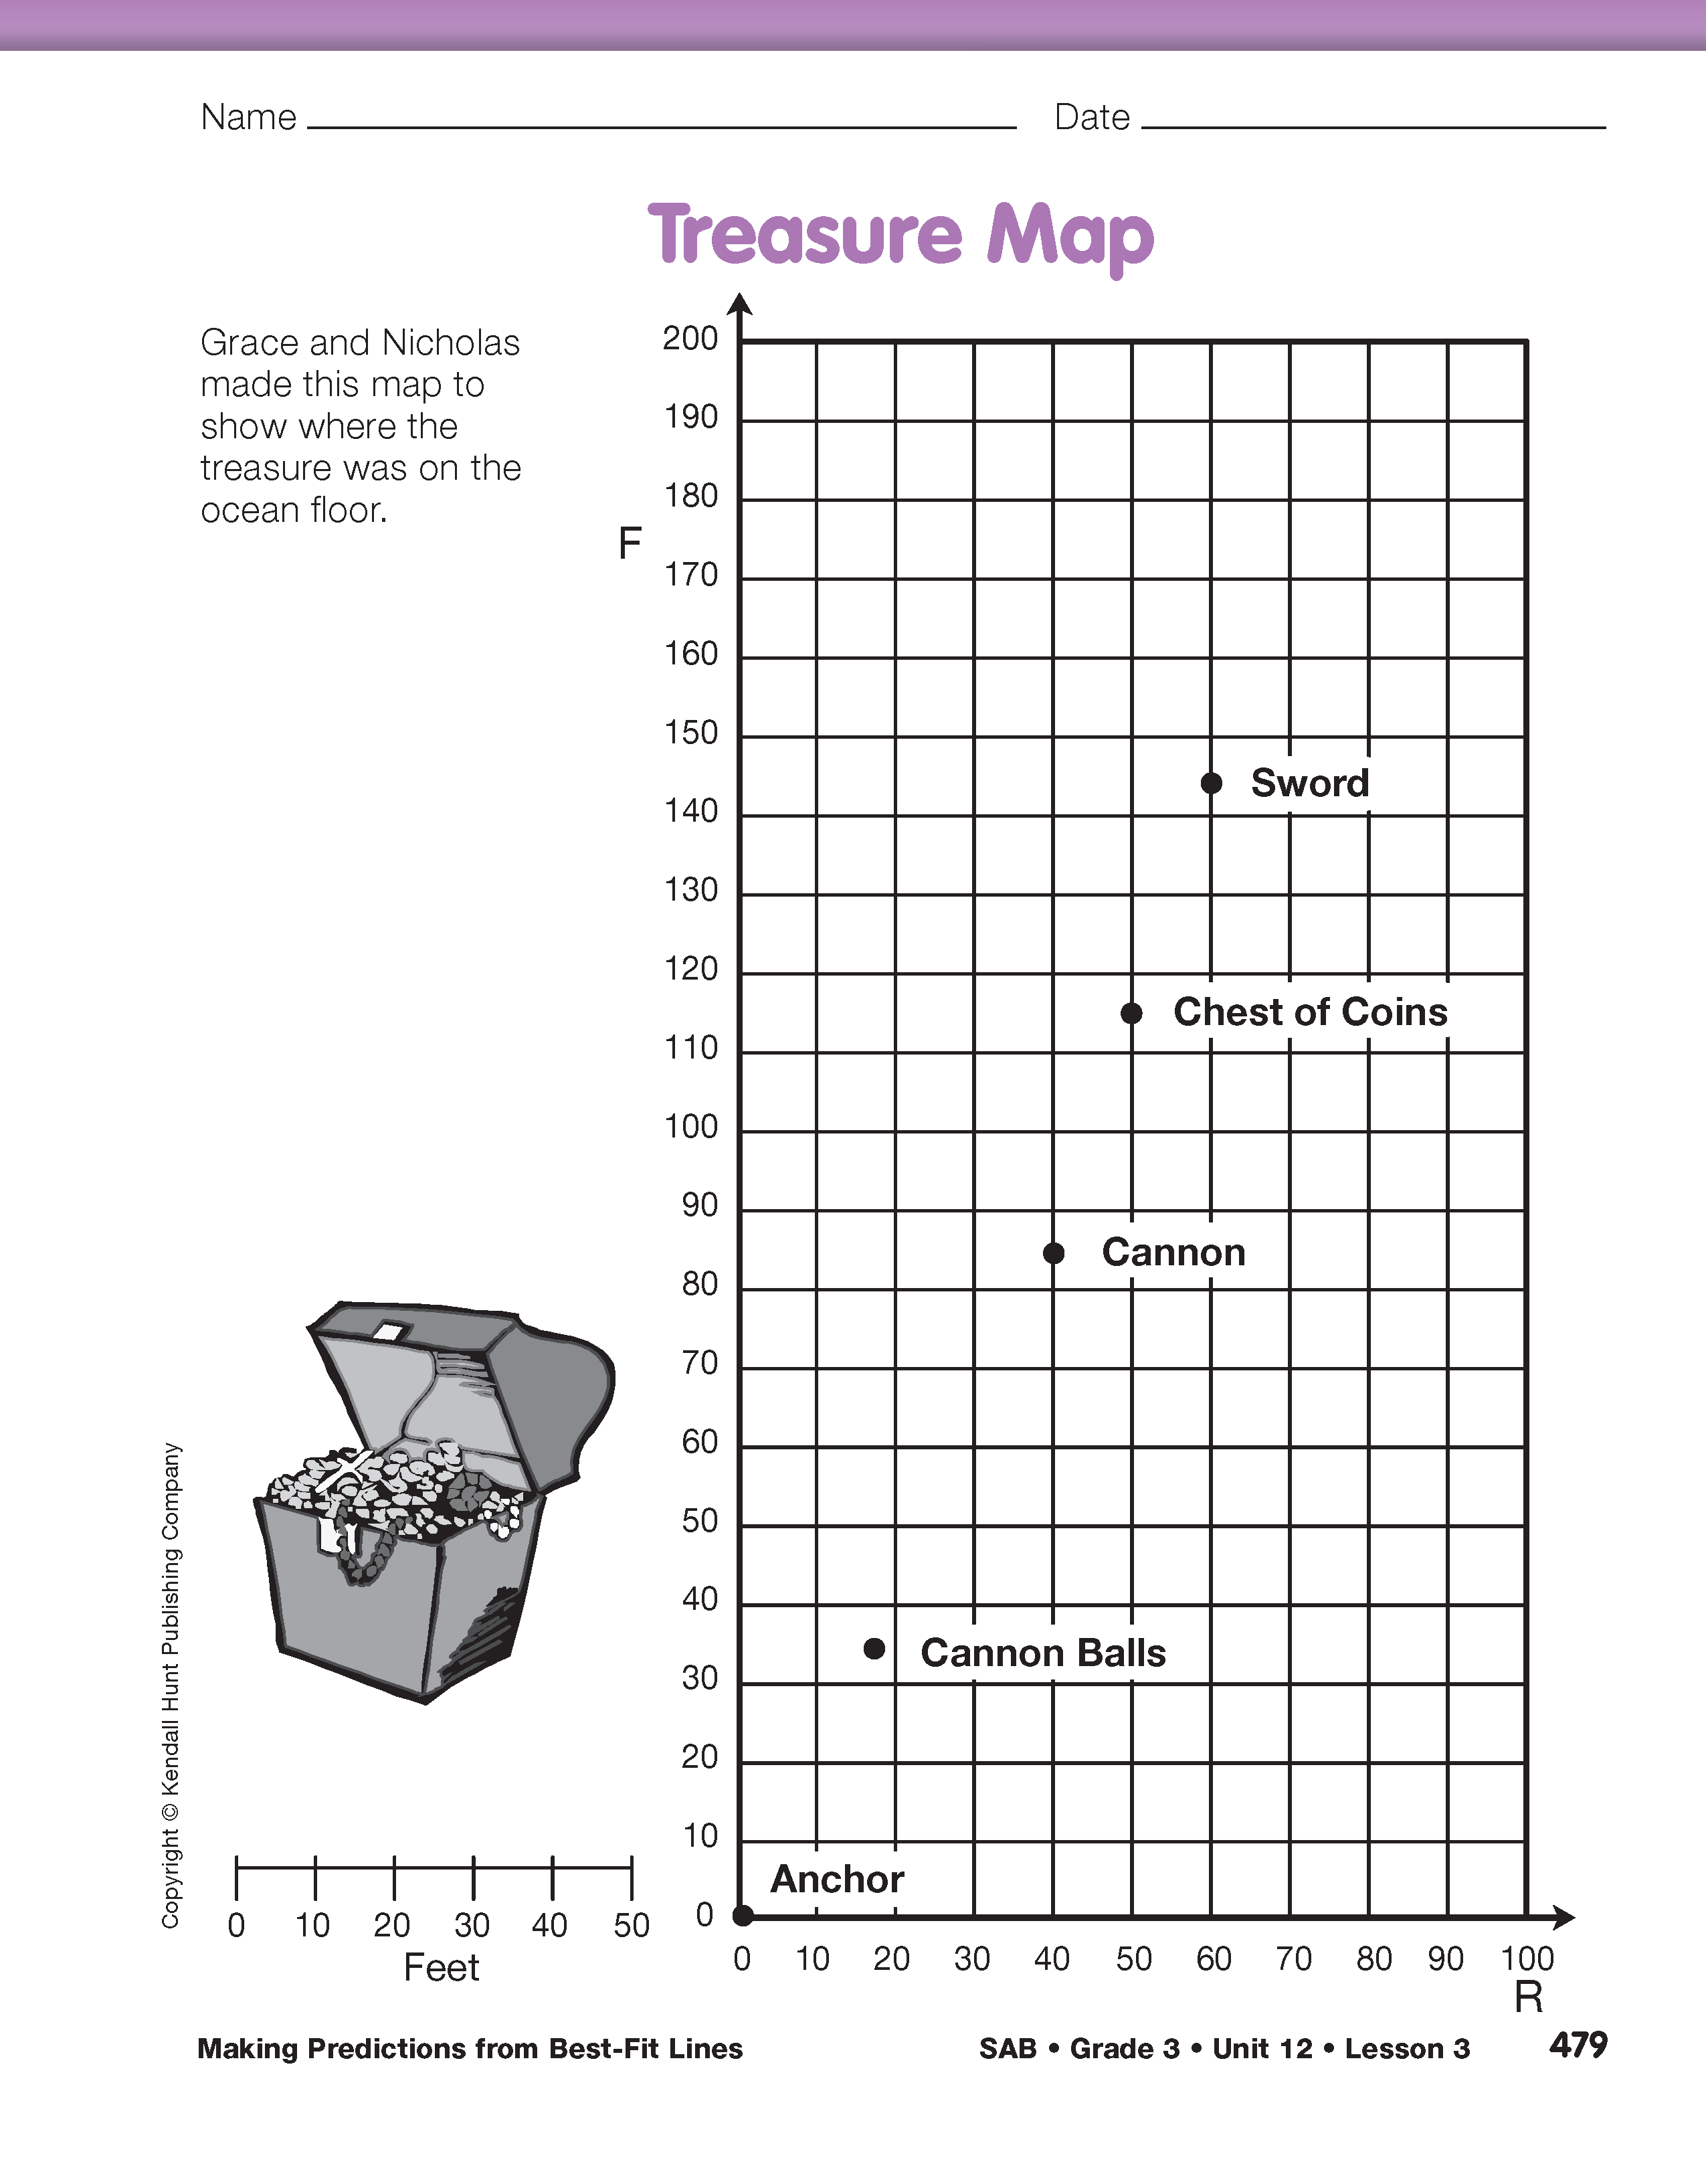
After the students have finished reading the last few pages of the story direct them to the Treasure Map pages in the Student Activity Book. The first page shows part of the map of the sea floor from the story “The Ghost Galleons” in the Student Guide. The points represent each of the heavy items that were found. Using points to represent each item makes it easier to identify its location using coordinates. Display this map using the Treasure Map Master in the Teacher Guide. Use this display and these prompts to guide a class discussion comparing the map in the Student Guide to this graph representation.
- Look at the map that Nicholas and Grace made in the Student Guide. Compare it to the one on the Treasure Map page in the Student Activity Book. How are they alike? (Possible response: They both use a grid. Both of the maps show the location of the heavy objects: anchor, cannon balls, cannon, chest of coins, and sword. Both maps are marked with “R” for right and “F” for front.)
- How are they different? (Possible response: The front/back axis (y-axis) on the map in the Student Activity Book goes up to 200 feet and in the Student Guide it only goes to 180 feet. The right/left axis (x-axis) on the map in the Student Activity Book only goes to 100 feet and in the Student Guide it goes to 180 feet. The map in the Student Guide used a scale of "1 centimeter equals 1 foot" and the one in the Student Activity Book used a scale of "1 centimeter equals 10 feet." The map in the story showed a picture of each of the items where it was found but the map in the Student Activity Book uses points to show where each item was found.)
- Why do you think Grace and Nicholas put only the heavy items on the treasure map? (Possible response: When they made the map in the story they wanted all of the items so they could look for patterns. They predicted they would find the ghost galleons in a line with the heavy items so they needed to include only these on the map.)
- Why do you think Nicholas and Grace used points to represent each item on the treasure map? (Possible response: It is easier to name the coordinates for each item when you use a point. When you draw a picture each item extends over several points.)
- Why do you think they extended the front/back (y-axis) longer on the treasure map (hint: look back at the story). (They found the ghost galleons off the grid of their first map so they had to make the grid on the treasure map taller to put the treasure on the map.)
- Why do you think Nicholas and Grace used a different scale on the treasure map? (Possible response: They probably wanted the map to be smaller so it would fit on a piece of paper.)

To help students understand the scale on the Treasure Map in the Student Activity Book, ask a student to measure a distance of 10 feet in the room. Point out to students that one centimeter on the Treasure Map page stands for 10 feet on the sea floor.
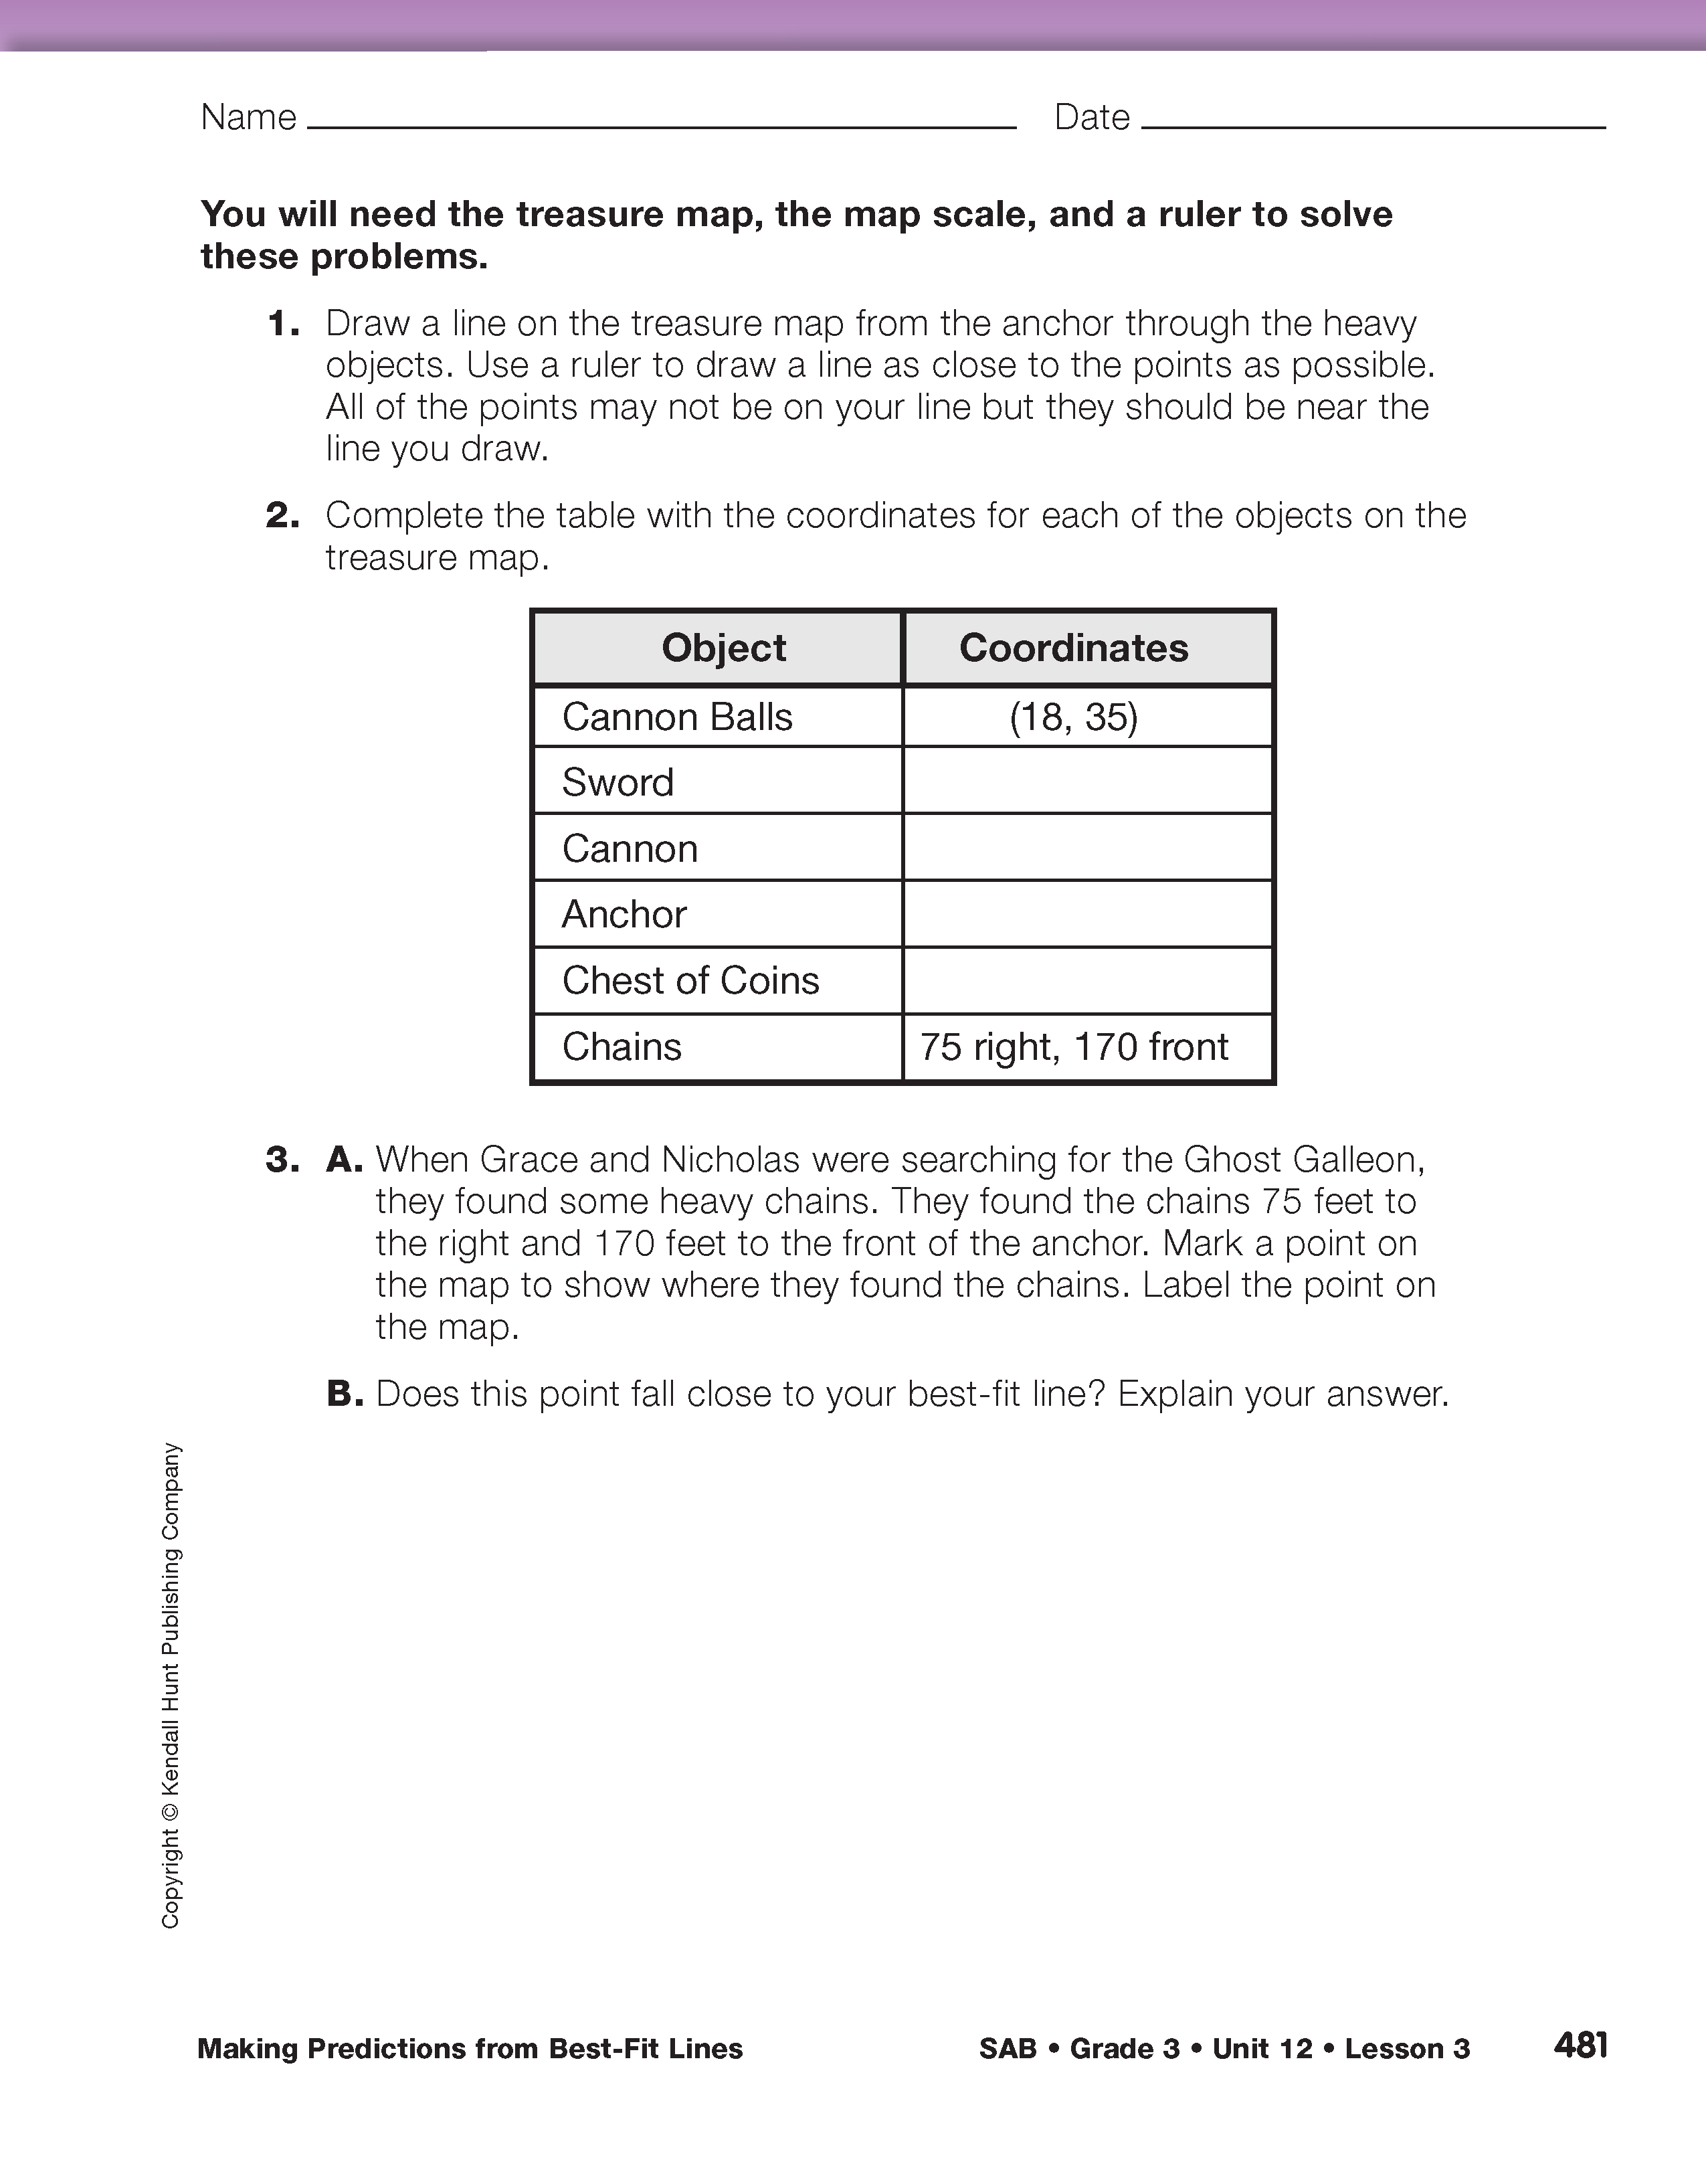
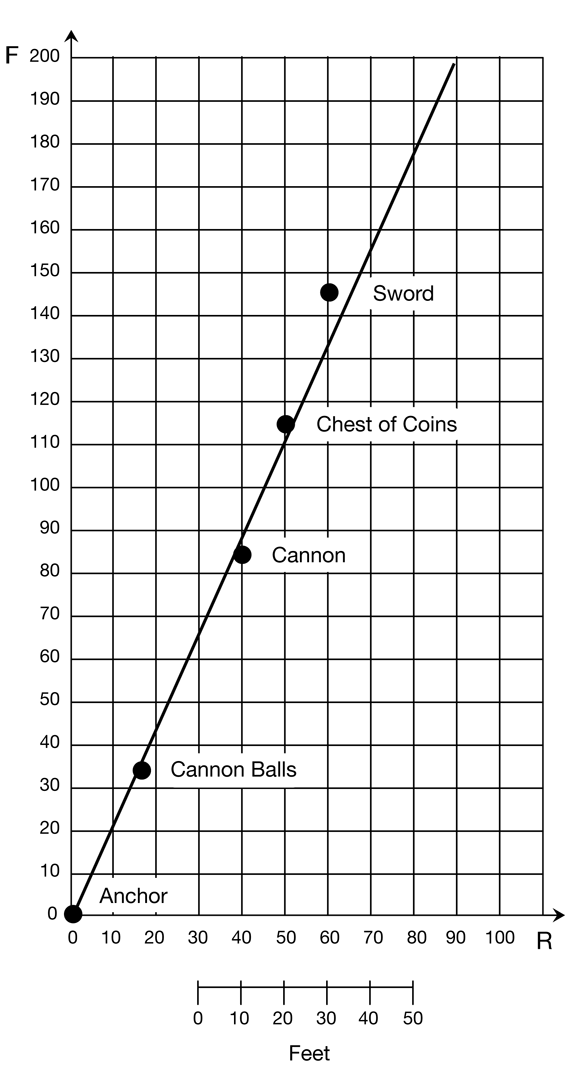
Assign the Treasure Map pages in the Student Activity Book. Question 1 asks students to draw a best-fit line. Ask students to use their rulers to try to find a line that is as close to all the points as possible. This often means that some or all of the points will not lie exactly on the line that is drawn. One way to do this is to try to have as many points above the line as below it. Ask a student to place a ruler on the map that is on the display of the Treasure Map Master to show where he or she thinks the line will go. The other students can make suggestions as to how to move the ruler to draw the best-fit line. Point out to students that drawing a best-fit line is like making a good estimate. The line should be as close to the points as possible, but everyone's line will be a little different. Figure 1 shows a best-fit line drawn on the map. Note that two of the points are just above the line and two are just below it. Ask students to draw a best-fit line on their maps and then complete Questions 2–5 independently.

Use the Treasure Map page in the Student Activity Book with the Feedback Box to assess students' abilities to solve a multiplication problem involving measurement [E3]; plot points and find objects on a map [E4]; measure to the nearest centimeter [E5]; draw a best-fit line [E9]; and make predictions using a best-fit line [E11].
Teachers have used a piece of spaghetti or string to demonstrate how to fit a line to a set of points so that it is easy to see that there may be points above and below the line.