Share Solution Strategies. After students have finished the assessment, ask them to share strategies and solutions for Questions 6 and 7 with a partner. Remind students that their best work will include explanations that will be clear enough so that their partner is able to understand their thinking. Labels should be included. Tell students to provide feedback to their partners if something is missing or unclear in the explanation.
Next, discuss solutions as a group. Have a discussion about how much error in measurement is reasonable. See Content Note. Refer first to Tiffany's data for the small, 4-gram pieces of chalk.
What's Close? The most fundamental idea about closeness is that it is a relative idea. We can consider ratios or percentages to help us know if we are “close enough,” and in general using 10% as a standard of closeness is a good place to start. However, developing this concept requires time and exposure to many experiences. Third-grade students do not need a clear standard to determine measurement error or whether or not a measurement is reasonable. They simply need to be able to begin to think generally about the reasonableness of a measurement. What is a measurement that is “close enough”? While a measurement that varies by 2 grams for a large piece of sidewalk chalk may be reasonable, it is not reasonable or close enough for the much smaller piece of chalk.
- Did any values on Tiffany's data table seem unreasonable? If so, which ones? (Answers may vary. Students may say that the values were reasonable because they all showed that each piece of chalk was about 4 grams. However, some students may say that the masses for 6 and 8 pieces of chalk were not multiples of 4, and appeared less accurate.)
- Did all of the values show that the mass of each piece of chalk was exactly 4 grams? (No. 6 pieces of chalk was 25 grams and 8 pieces of chalk was 33 grams.)
- How could this be? (Possible responses: Tiffany may not have measured accurately, or each of the pieces of chalk may have been a little bit different.)
- Would a mass of 3 grams be reasonable for one piece of chalk? 5 grams? Explain why you think so. (Possible response: Maybe. Those values are close to 4 grams.)
- Would a mass of 2 grams be reasonable for one piece of chalk? 7 grams? (No. 2 grams seems way too low. It is about half the mass of one piece. 7 grams seems way too high. It is almost twice the mass of one piece of chalk.)
- How much is “too much error” when measuring a small 4-gram piece of chalk? (Possible response: It depends. In this case, it is reasonable to be no more than 1 gram off because each piece of chalk is only 4 grams. A measurement of more than 1 gram over or more than 1 gram under the given values shows too much error.)
- In Question 7, was 85 grams a reasonable mass when weighing 25-gram pieces of sidewalk chalk? Show or tell how you decided. (85 grams is not reasonable. Strategies will vary. Possible strategy: I made a data table. I thought about quarters to help me with the pattern. 1 quarter was 25, 2 quarters was 50, 3 quarters was 75, and 4 quarters was 100. 85 does not fit into the pattern.)
- Share a different solution strategy.
- Would a mass of 24 grams be reasonable for one piece of sidewalk chalk? 26 grams or 27 grams? Explain. (Yes, the masses are reasonable. They are still very close to following the pattern of 25 grams for each piece of sidewalk chalk.)
Have students share a variety of solution strategies including one that uses a data table and one that uses a graph for Question 6.
- What patterns helped you solve the problem?
- Show or tell how you predicted the mass of 30 pieces of chalk.
- Solve this problem another way to check it.
- Which tool do you like better, the graph or the data table, to solve problems? Why? (Answers will vary.)
- Is this true for all problems? For which problems did you prefer to use the data table? The graph? (Examples will vary. Possible response: Sometimes it is easier to use a data table and sometimes it makes more sense to use a graph. i liked using the data table to answer Question 5 because I just continued the pattern of adding on 4 grams to the mass values for each piece of chalk. To solve Question 6, I liked using the best-fit line on the graph to predict the mass of 15 pieces of chalk. I doubled that value to find the mass of 30 pieces of chalk.)
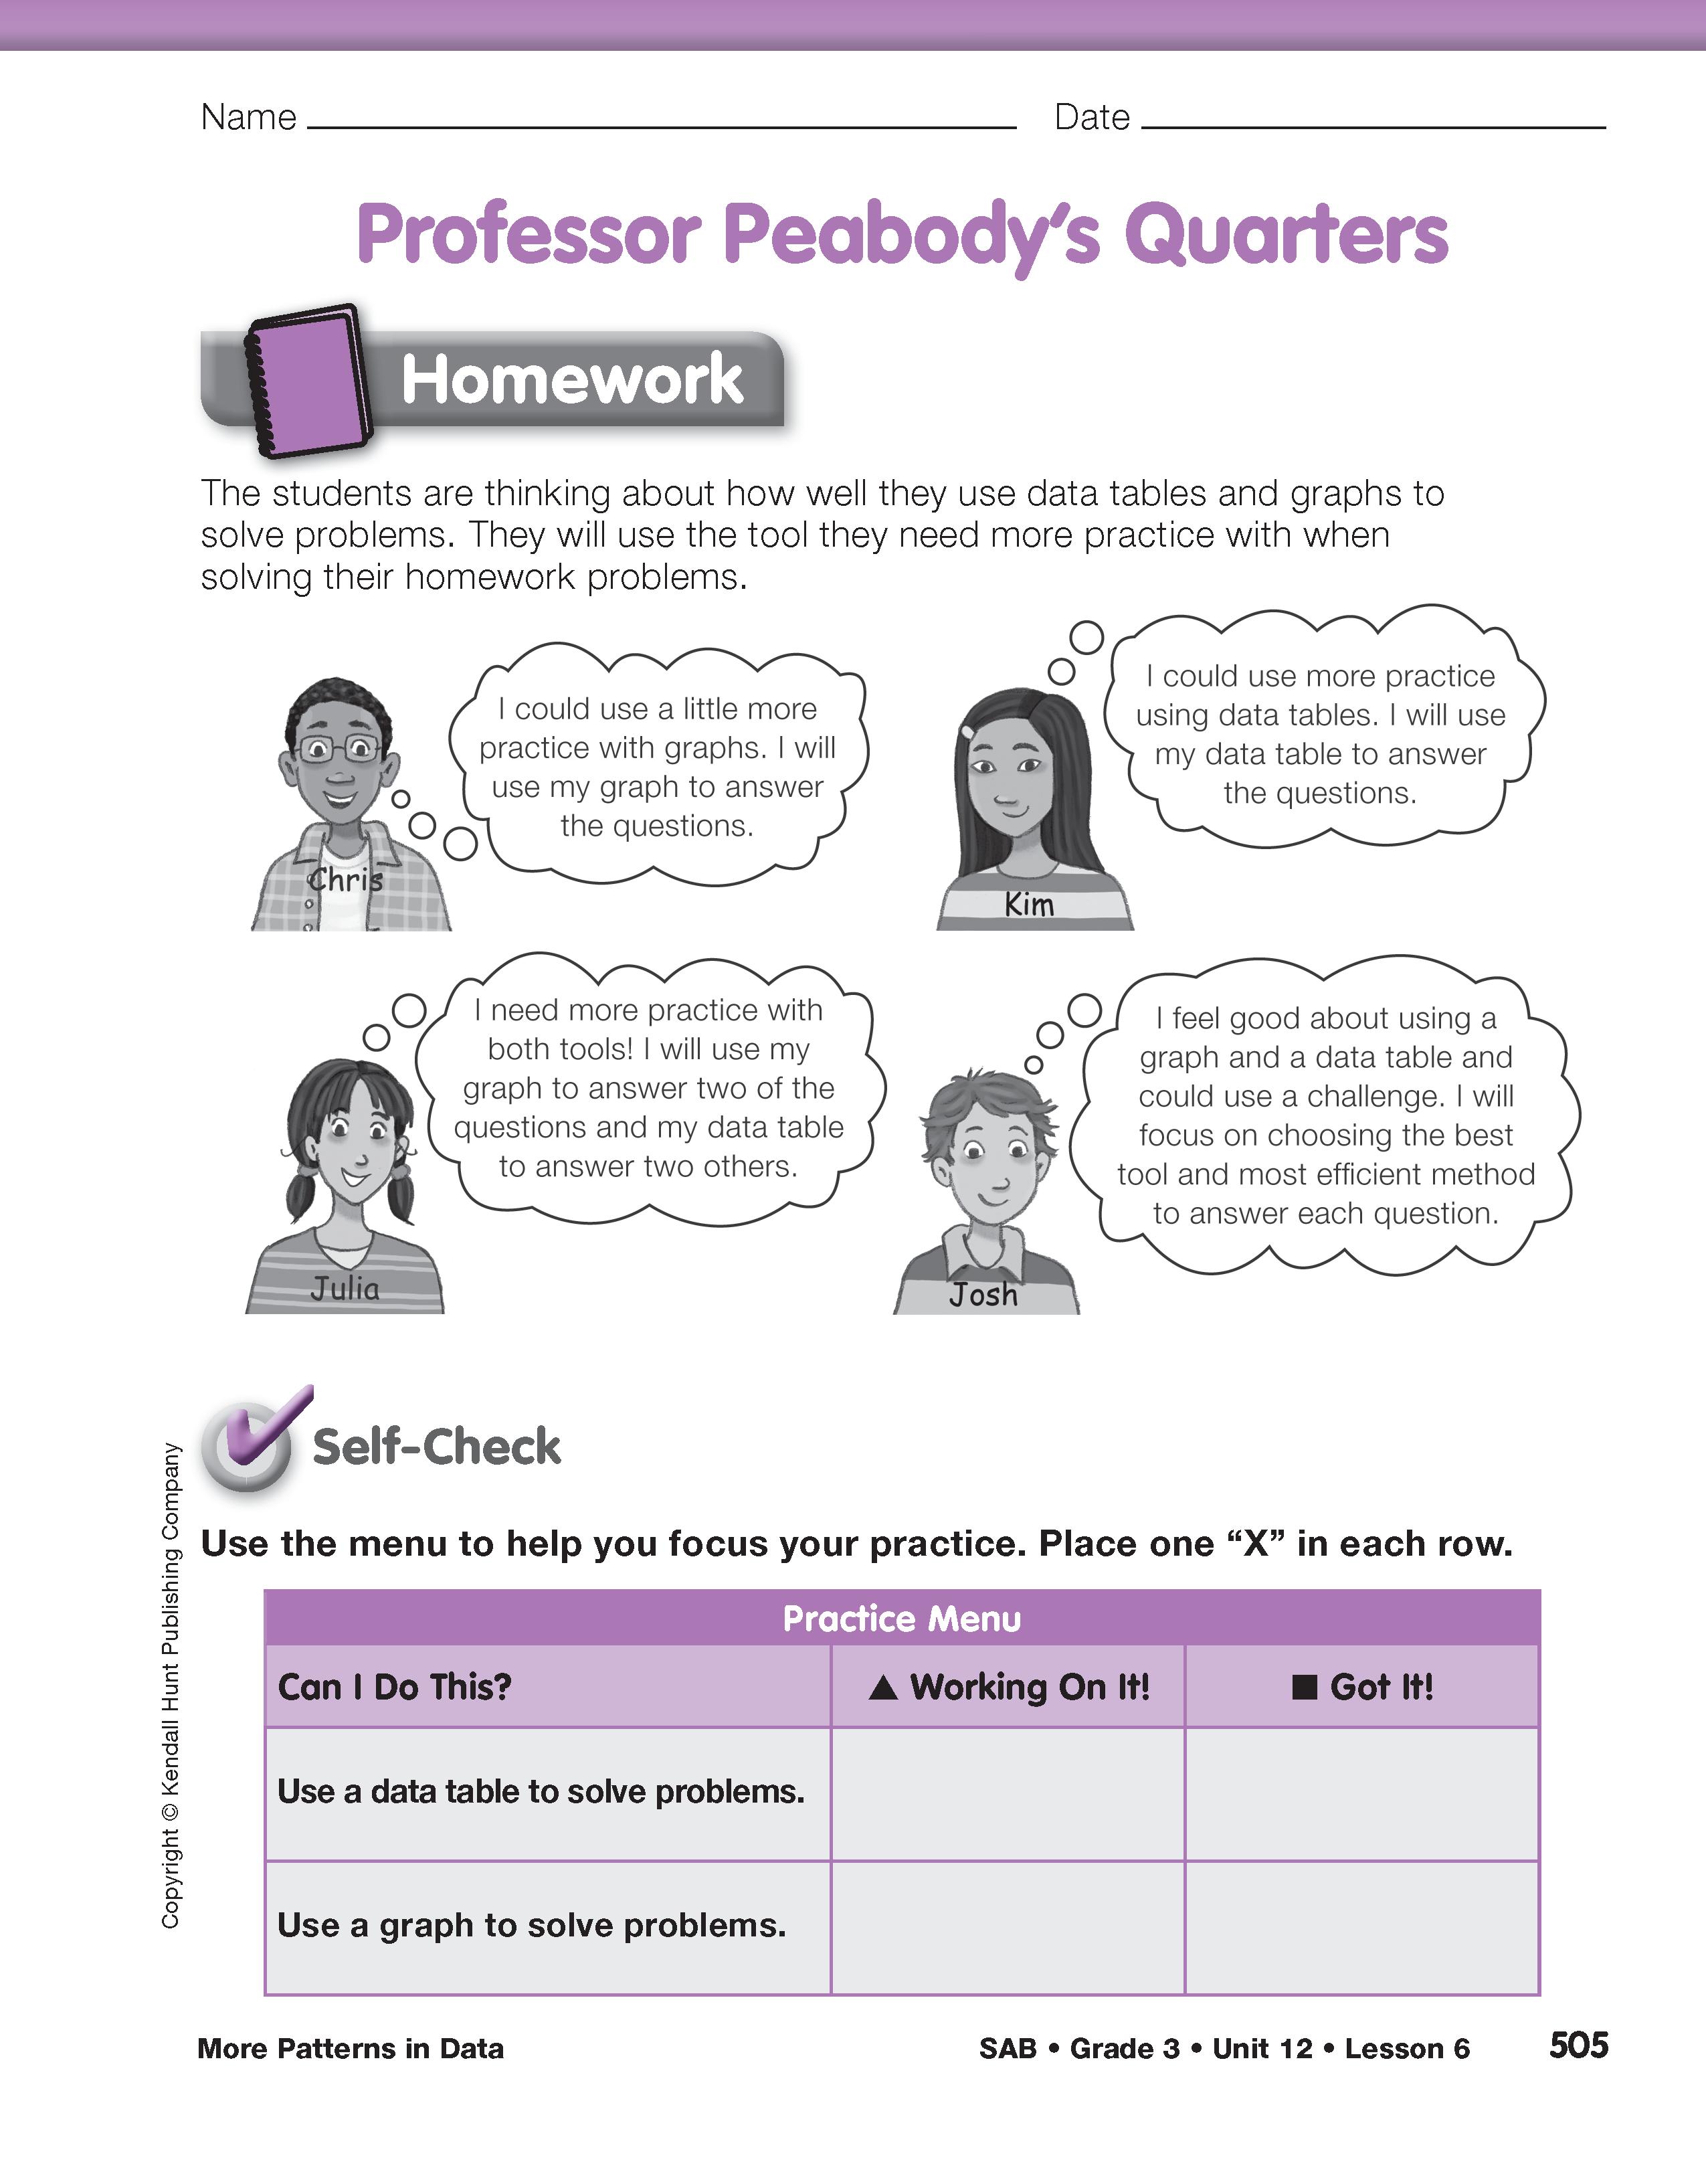
Practice Using Patterns in Data Tables and Graphs. Direct students' attention to Professor Peabody's Quarters in the Student Activity Book. These pages provide a menu that guides students toward differentiated and targeted homework practice based on their needs.
Read the vignette at the top of the page together as a class. It explains the following:
- Students who are comfortable using graphs but need more practice using data tables should use a data table to solve the problems.
- Students who are comfortable using data tables but need more practice using graphs should use the graph to solve the problems.
- Students who need more practice using both of the tools should solve two of the problems using a data table and two of the problems using a graph.
- Students who checked “Got It!” for both the data table and the graph should choose the best tool and most efficient method to solve each problem.
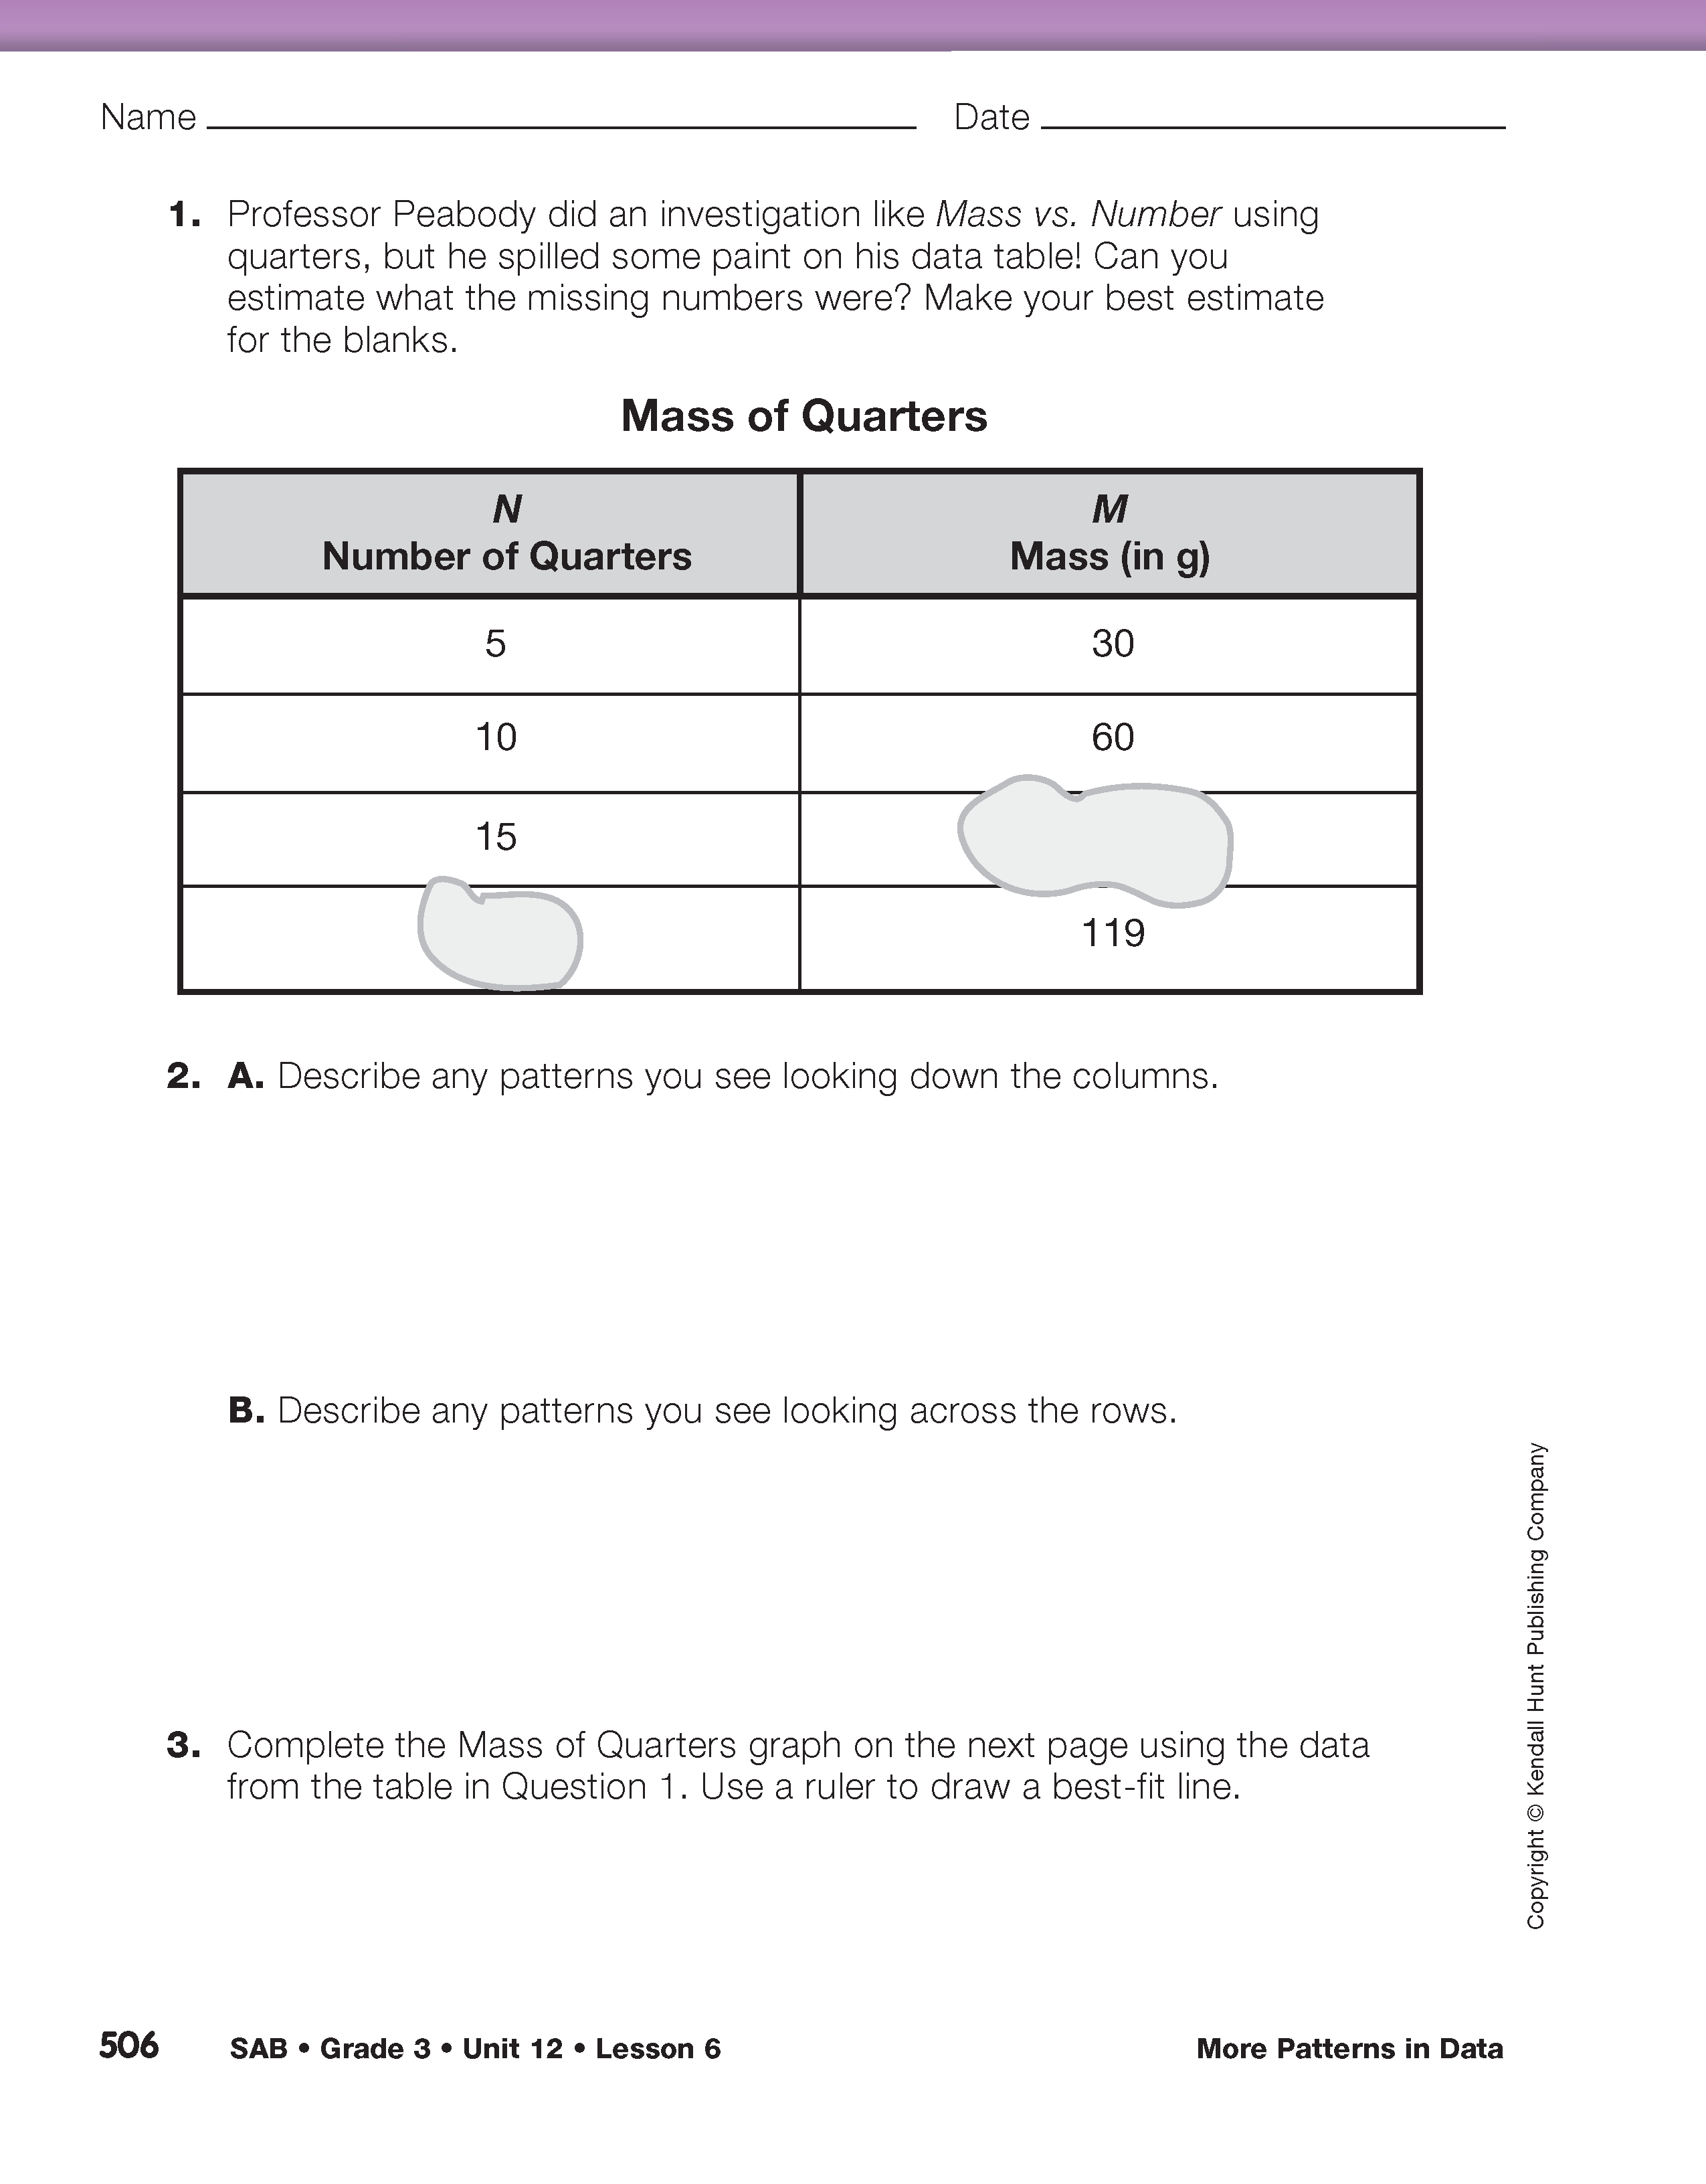
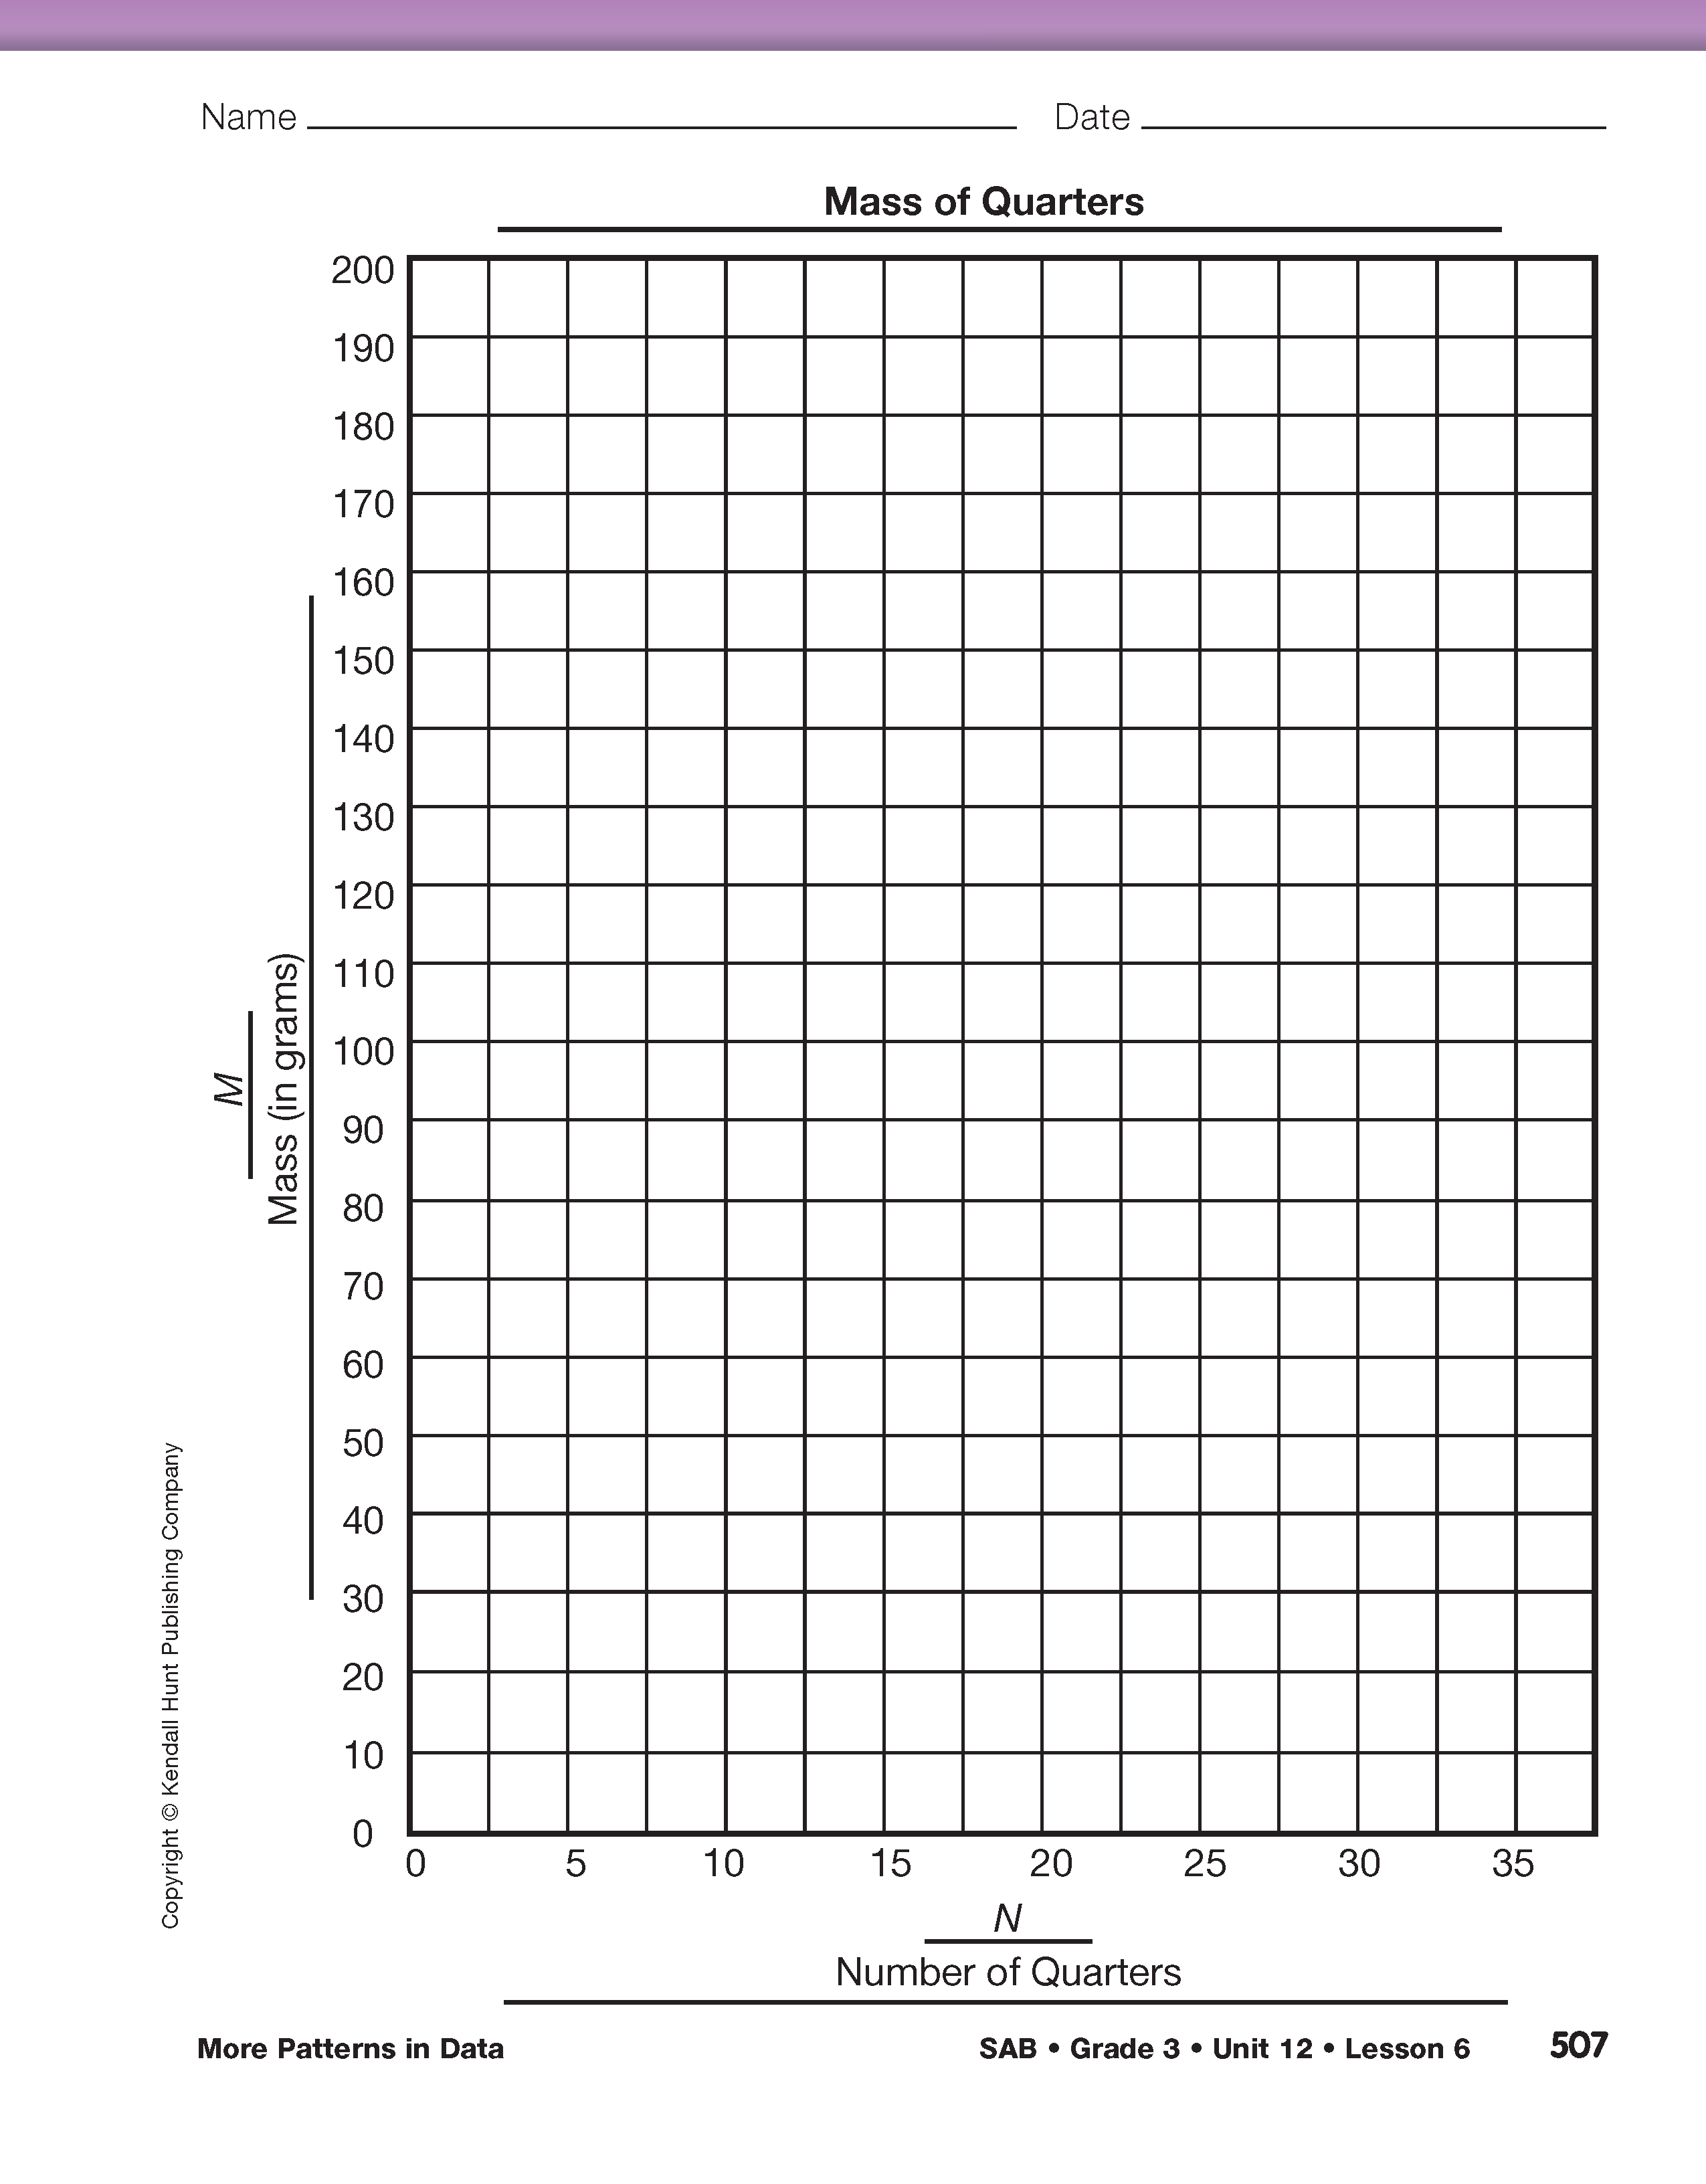
Tell students to think about their work on the Michael's Marbles and Tiffany's Investigation problems. Ask students to self-assess their abilities to use data tables and graphs to solve problems, and then to fill out the menu on the page. Every student will complete the data table and make a point graph. Then, students will decide which tool they will use to solve the problems based on their practice needs.
After students have competed the menu, assign Professor Peabody's Quarters for homework.
Students use the Self-Check with the Practice Menu on Professor Peabody's Quarters in the Student Activity Book to self-assess their ability to use and read patterns in data tables or graphs to solve problems [E10, E11], identify and extend patterns represented in a graph or table [E1] and to choose targeted homework practice.