Lesson 1

Lemonade Stand

Est. Class Sessions: 2

Developing the Lesson

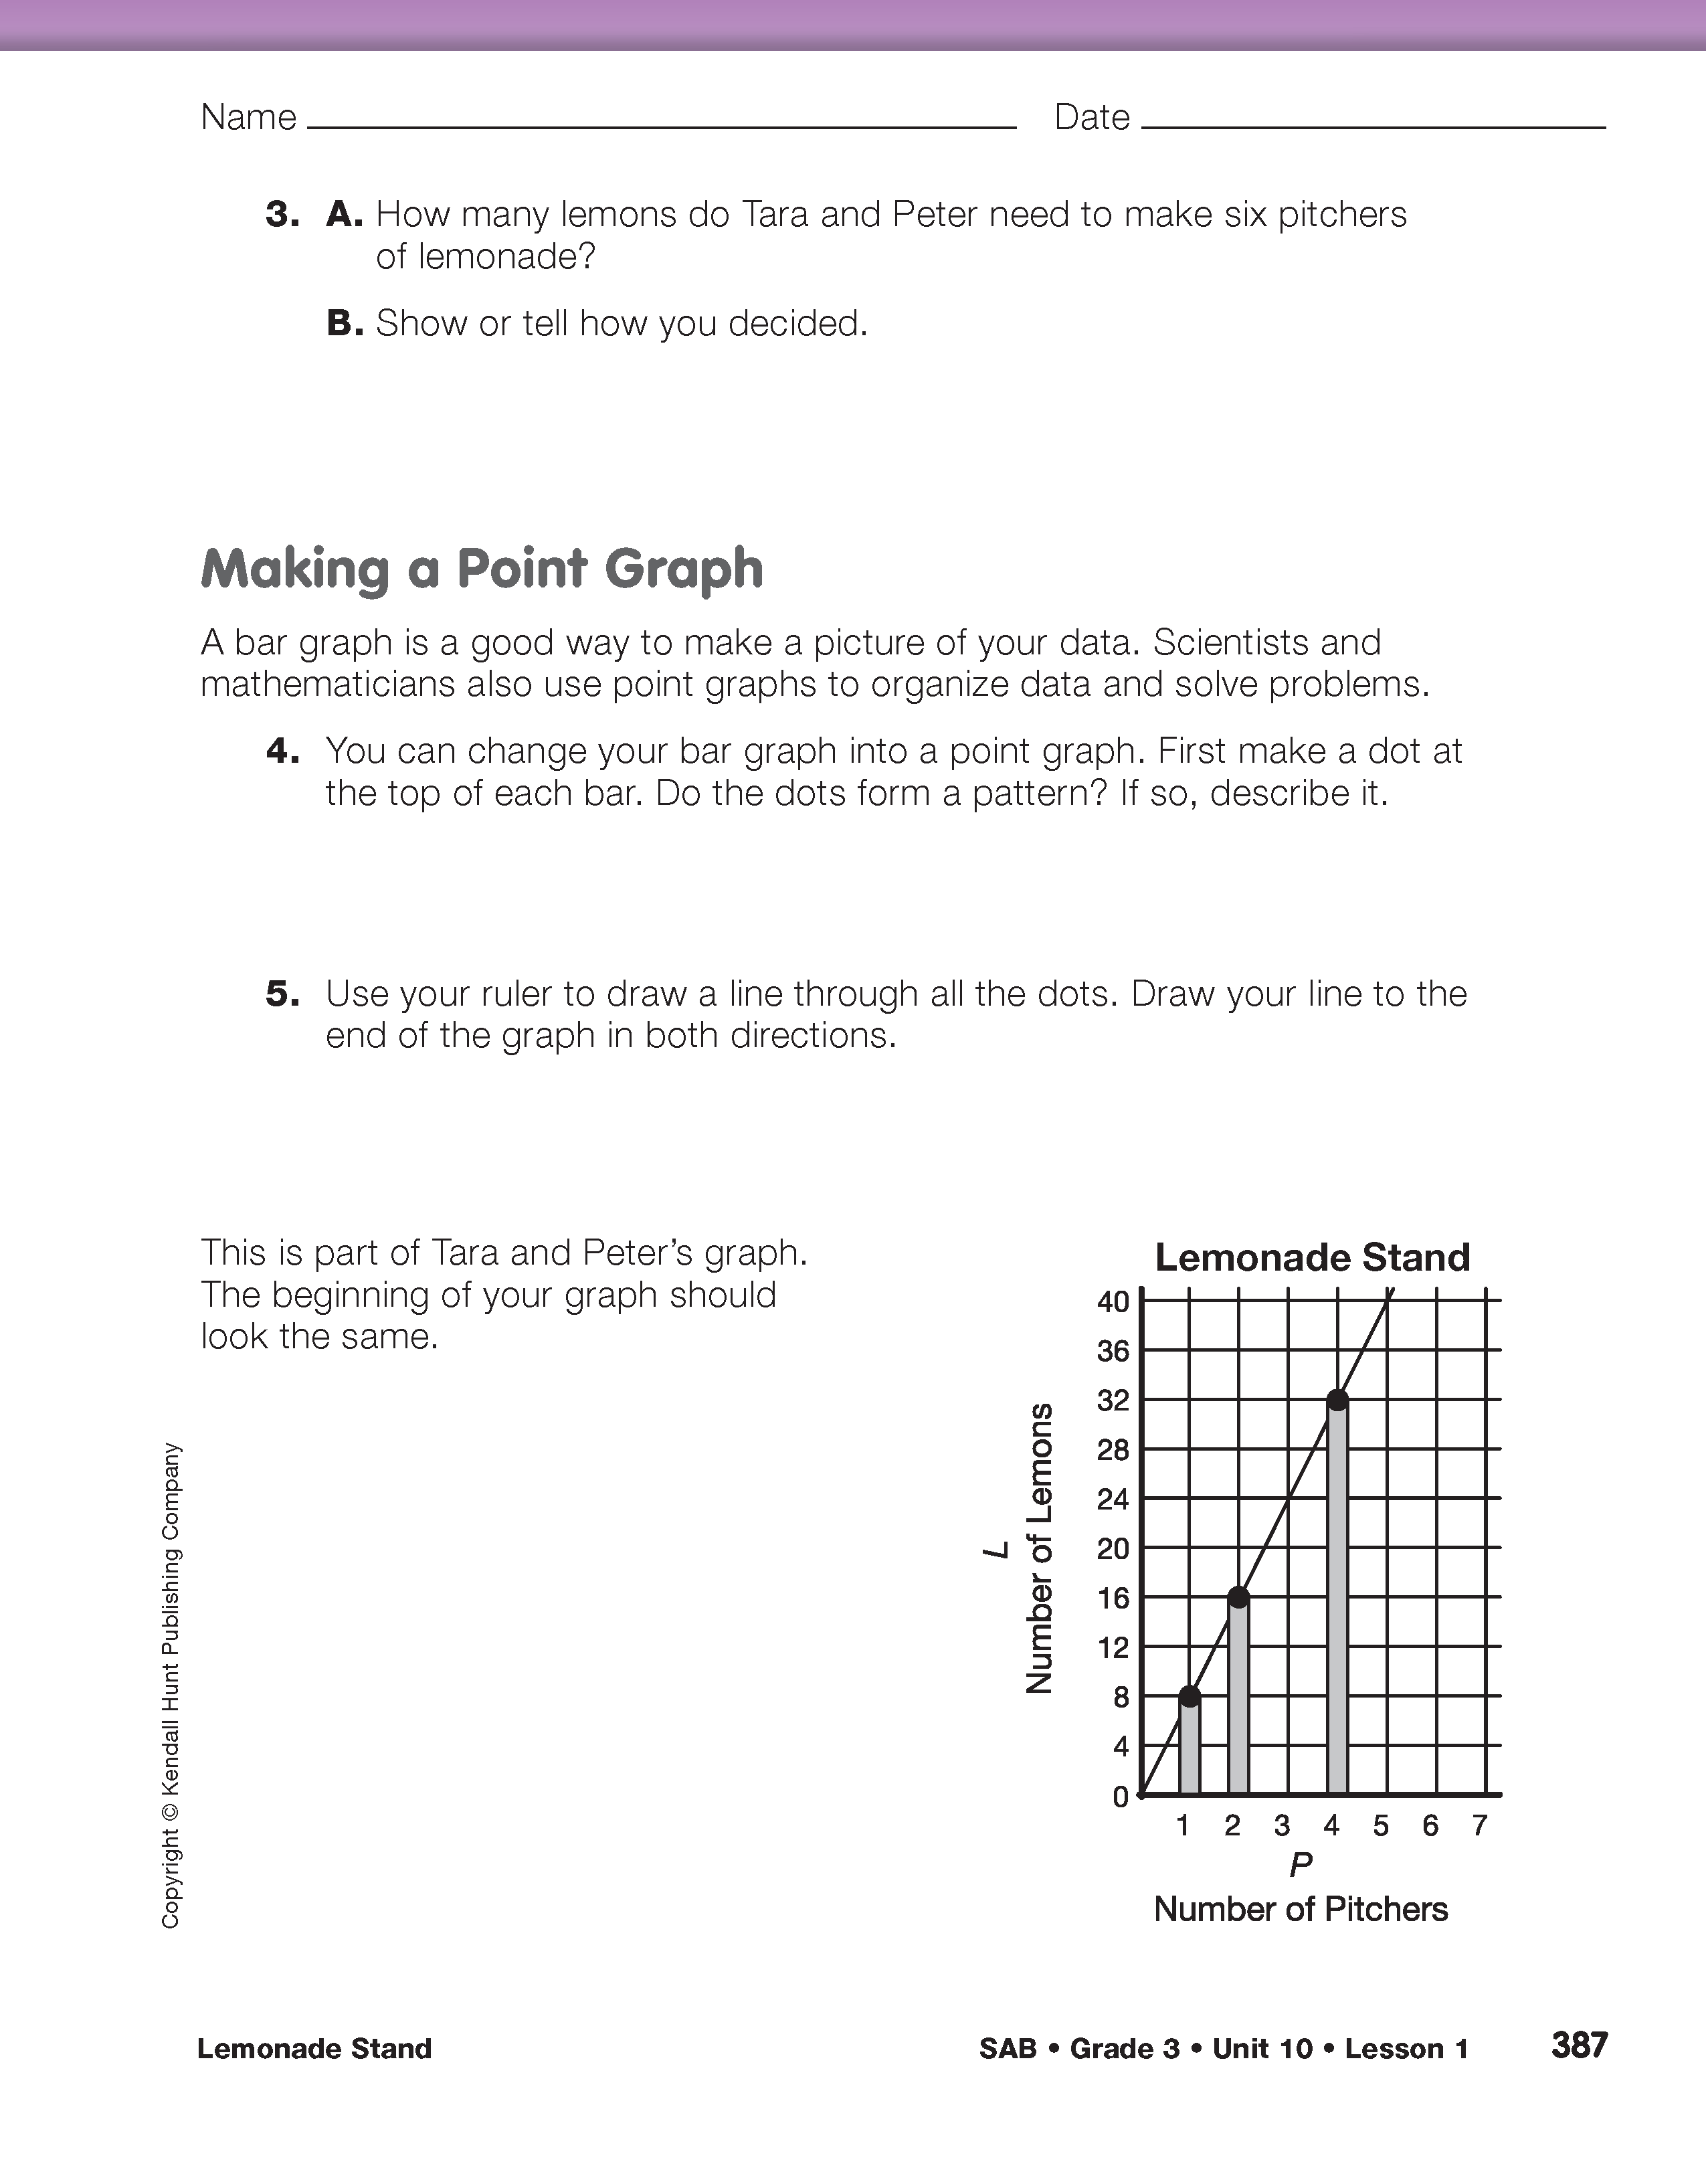
Part 2. Making and Using a Point Graph

Make a Point Graph from a Bar Graph. A class discussion of student strategies for solving Question 3 might include the observation that it is possible to fit a ruler along the tops of the bars and draw a straight line. This line can then be used to predict the height of the bar for six pitchers. Questions 4 and 5 develop this technique.

As shown in Figure 3, students draw dots at the top of each bar and then look to see whether the dots form a pattern. Since the dots lie along a straight line, they draw a line through these points with a ruler, extending the line in both directions. You can demonstrate the procedure using a ruler and the display of the Lemonade Stand Graph Master. See Content Note.

Using this method to draw a line graph is the precursor to graphing ordered pairs. The dot at the top of the bar for 4 pitchers should lie on the grid line for 32 lemons. Students can learn, based on this experience, to graph the point (4,32) without a lengthy explanation of ordered pairs.

Students will use the line drawn through the dots to make predictions. They should therefore use rulers to make the lines as accurate as possible.

If the dots on the bars cannot be connected by a straight line with a ruler, the student has drawn the graph incorrectly. Review the display of the Lemonade Stand Graph Master and the prompts in Part 1 to help students check the accuracy of their graphs.

Use the Point Graph to Solve Problems. In Questions 6 and 7 in the Student Activity Book students use the graph and a ruler to find the answer by drawing a line going up from the number on the horizontal axis (number of pitchers) until they reach their graph line, then extend this line left until they reach the vertical axis (number of lemons), as shown in Figure 4. Students should draw dashed lines to show their work so these lines will not be confused with the line connecting the data points. Demonstrate this on the display of the Lemonade Stand Graph Master.

Questions 8–10 will require students to perform this process in reverse: They will begin drawing their dashed line at the vertical axis (number of lemons) and will find their answer on the horizontal axis (number of pitchers).

Solving Questions 6–10 two ways encourages students to look back at their work and discover the connection between the line graph and multiplication and division.

Questions 6 and 7 can be solved using multiplication and Questions 8–10 can be solved using division. Before students begin their work discuss tools and strategies they can use to check their answers.

  • What strategies or tools can you use to check your work? (Possible responses: We can use number sentences, pictures, models, and number lines to check our work.)

Question 10 can also be solved using division but requires interpreting a remainder. Since the answer is halfway between five and six pitchers, students might say Tara and Peter can make 51/2 pitchers or they can make 5 pitchers but will have four lemons left over. Both answers are correct.

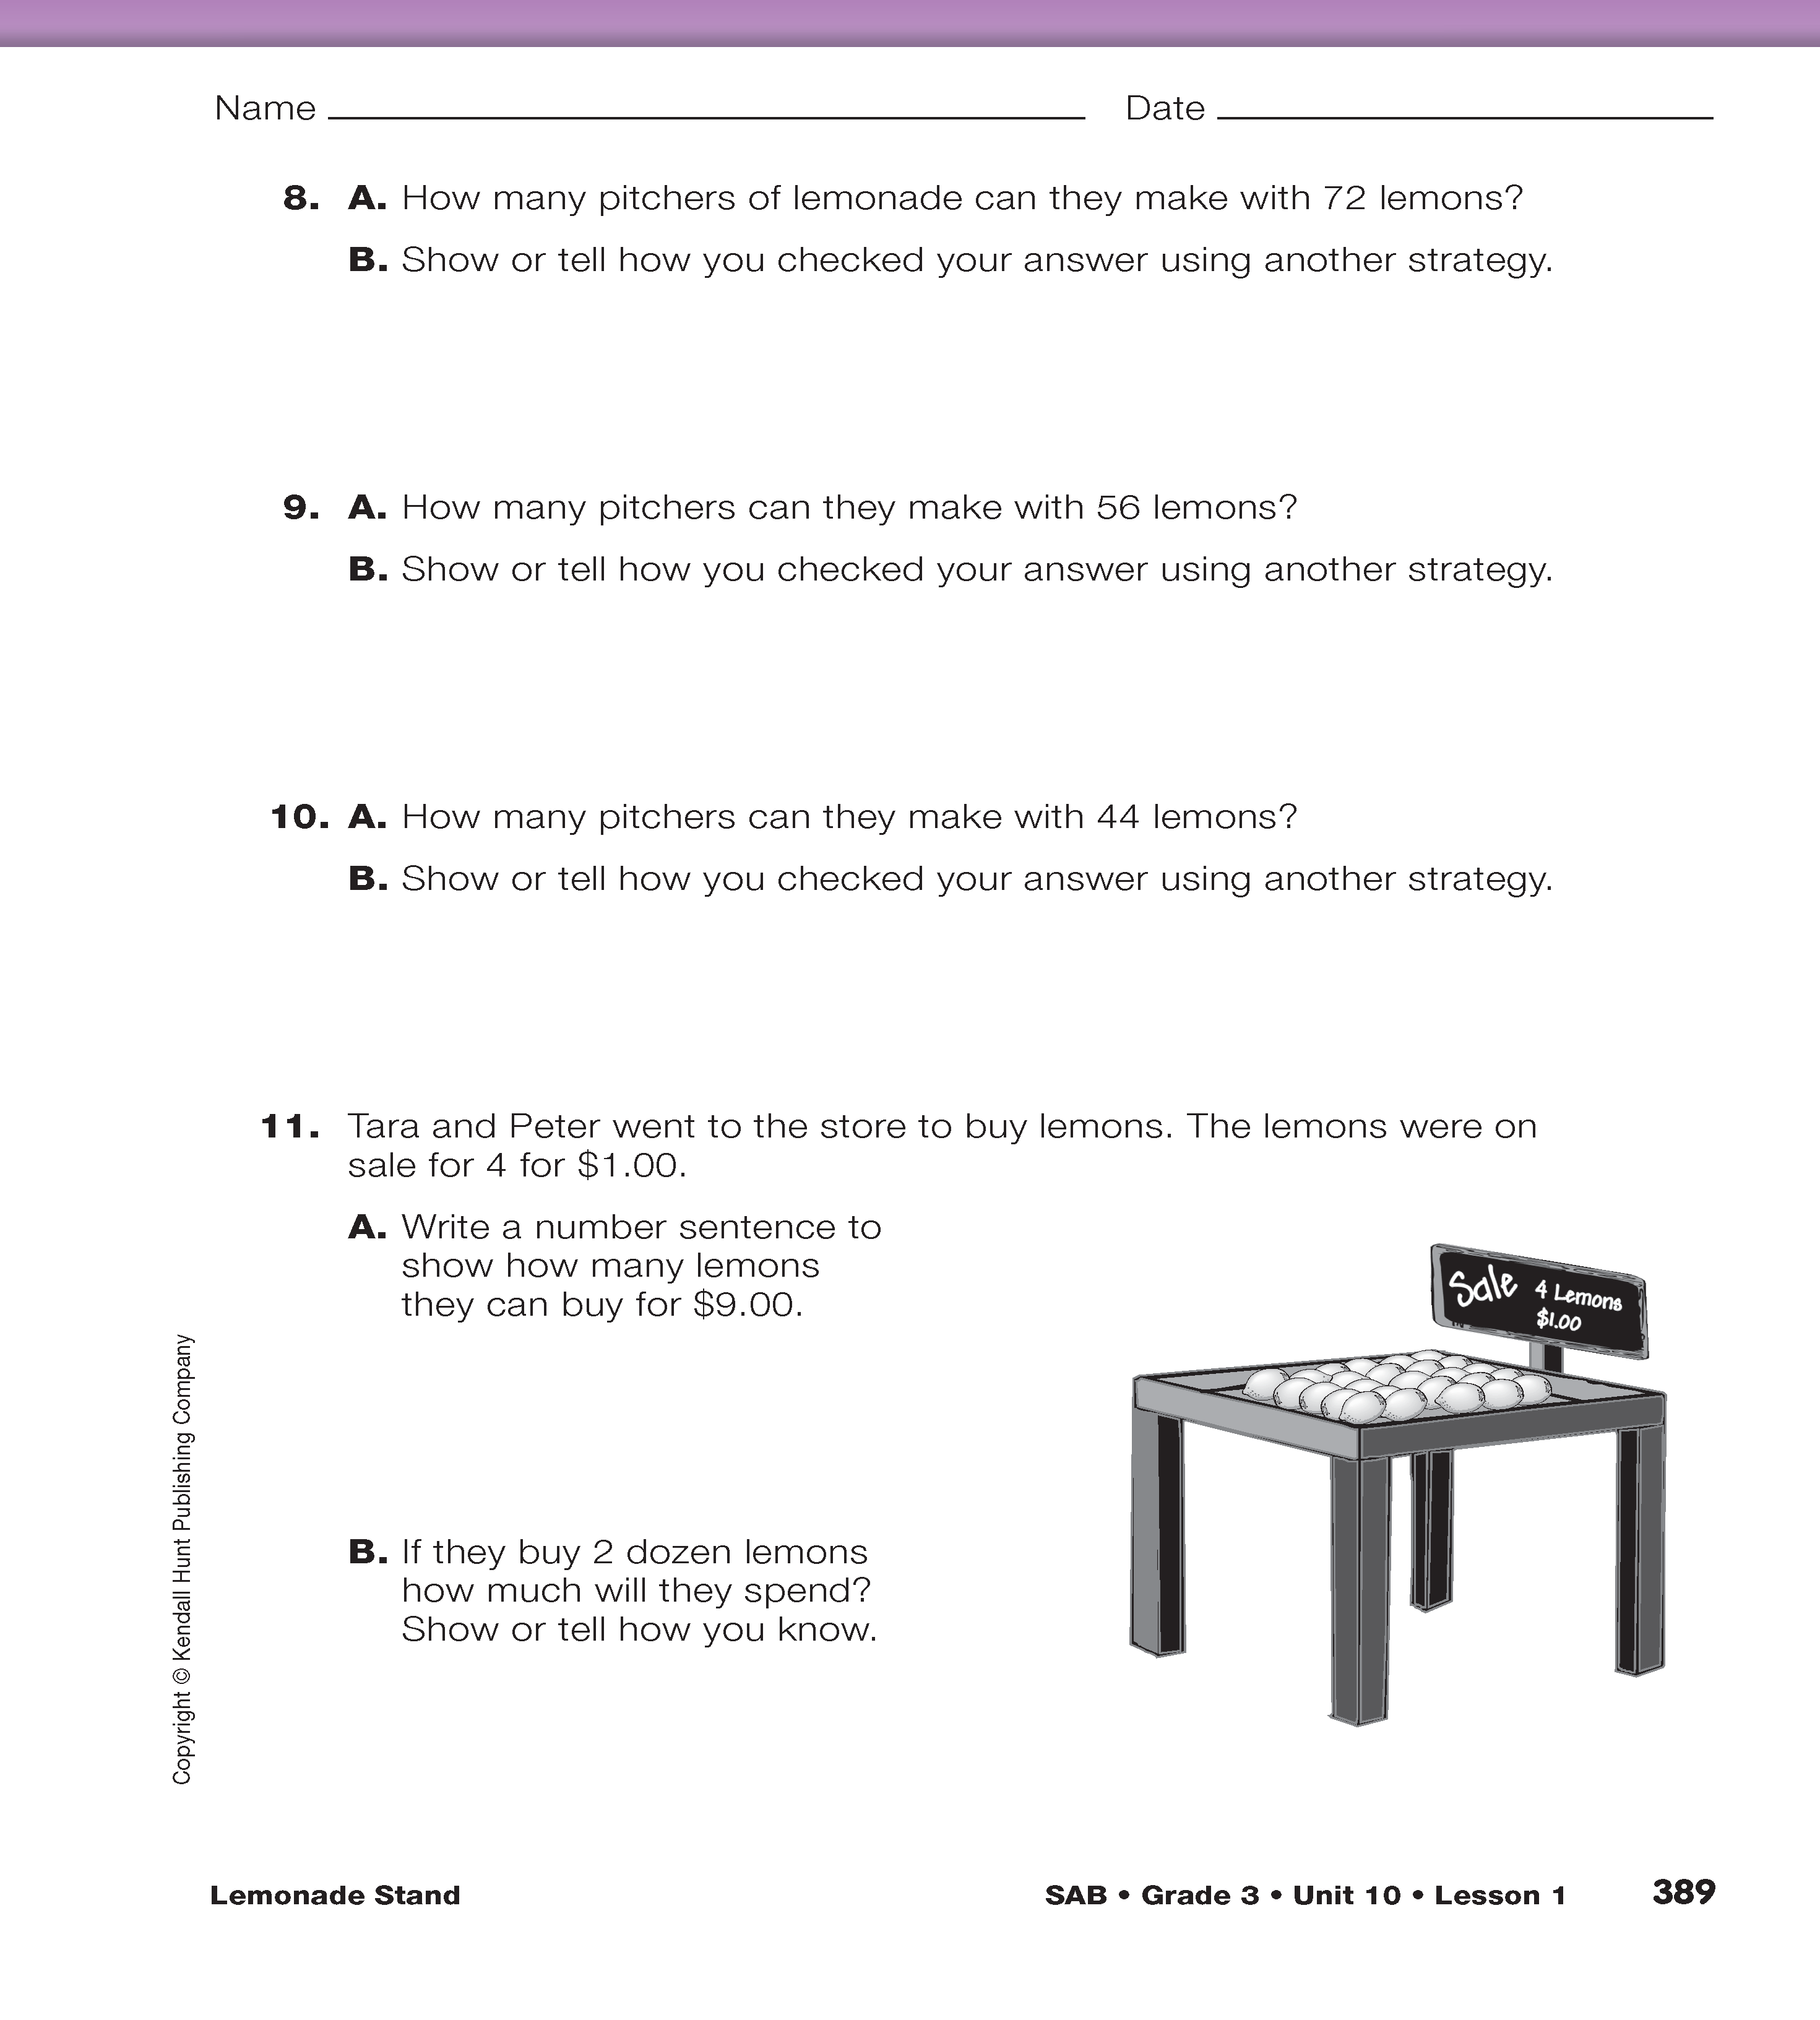
Students are asked to write a number sentence to show how many lemons they can purchase for $9.00 if lemons are on sale four for $1.00 in Question 11A. Students may represent this as a repeated addition problem, 4 + 4 + 4 + 4 + 4 + 4 + 4 + 4 + 4 = 36 lemons or as a multiplication problem, 4 × 9 = 36 lemons. Make sure students are able to tell what the numbers represent in the number sentence they choose. To answer Question 11B students will need to know that there are 24 lemons in 2 dozen.

Share Solution Strategies. After students have completed Questions 6–11, ask two students to explain their solutions for each problem. One student will demonstrate how to use the line drawn on the display of the Lemonade Stand Graph Master to solve the problem. The other student will show how he or she solved it using a second method. The short discussion in the Sample Dialog box includes sample discussion prompts and possible student responses.

Using the graph to find data points that lie between those in your data table is called interpolation. Inter means “between” or “among.” Since we have data for four pitchers and eight pitchers, using the graph to answer Question 6 (five pitchers) is interpolating. Using the graph to make predictions about data points that lie outside those in your data table is called extrapolation. Extra means “outside” or “beyond.” Since 72 lemons lie beyond the largest number of lemons reported in the data table, using the graph to answer Question 8 is extrapolating.

Use this dialog to compare solution strategies.

Teacher: Mara, show us how you used the graph to answer Question 7. How many lemons do you need for 10 pitchers of lemonade?

Mara: I started here at 10 down here. [Points to 10 on the horizontal axis.]

Teacher: Is that 10 for 10 pitchers or 10 lemons? What numbers are on the horizontal axis?

Mara: It's 10 pitchers. That is what this P stands for.

Teacher: Good. Then what did you do?

Mara: Then I drew a line up to where it met the line we drew through the points. [Draws a dotted line as shown in Figure 4 that meets the solid line drawn through the data points.] Then, I went over to where the graph shows how many lemons. That's what the L is for. [Draws a dotted horizontal line over to the vertical axis at 80 lemons.] See, the graph says it is 80 lemons.

Teacher: Thank you, Mara. That was very clear. Don't sit down yet. Let's see how Carla solved it without the graph.

Carla: I thought of tens. For ten pitchers, you would need ten times eight lemons. That is the same as 8 tens and that's 80. So, 80 lemons.

Teacher. Let's compare the strategies. How are they alike? How are they different?

Richard: They got the same answer.

Teacher. That's important. Using two strategies is a way to check that your answer is correct. How are the two strategies different?

Johnny: Carla thought about tens. She said 8 tens are 80.

Teacher: That's right. How did Mara use the graph to find 10 times 8? What do you think, Johnny? [He looks confused.] Look at your graph. How can you use your graph to find 2 times 8? 3 times 8?

Johnny: I get it now. It is like walking up the steps. To find 2 times 8, start at 2 down here. Go up to the top of the bar, then go straight over to here where the 16 is. 2 times 8 is 16. [Johnny points to the 2 on the horizontal axis. See Figure 4]. For 3 times 8, I start here at 8 and go up to the line—that is where the bar would have been. Then I go over to 24. So 3 times 8 is 24. So, Mara's dotted lines show to start at 10 down here, go up to the line, and then over to the 80 for 8 times 10.

Teacher: So 8 times 10 is 80. Here's 10 pitchers and 80 lemons. [Points to the intersection of the two dotted lines and the solid line.]

X
SG_Mini
+
X
SG_Mini
+
X
SG_Mini
+
Converting to a point graph
X
+
Using a line to interpolate and extrapolate
X
+