After they have revised their work, have students share some solution strategies for Question 4.
- Were you able to use the graph to solve Question 4? (Possible response: Yes, I used the graph to figure out how much money Katie would have at 6 weeks. If she earns $72 in 6 weeks, she would earn twice that in 12 weeks. $72 + $72 = $144.)
- Explain a second method for solving Question 4. (Possible response: I made a data table and continued the pattern. For each week I recorded in the first column, I added 12 to the second column, Dollars. I had 1 week, $12; 2 weeks, $24, and so on until I found 12 weeks, $144.)
Ask students to share other interesting solution strategies.
Some questions to ask are as follows:
- Is there another way to solve this problem? Explain.
- How did you get that number?
- How did you decide if you were going to divide (or use another operation)?
- Where did this (number) come from?
- Which is the most efficient strategy for solving this problem?
- Which strategy do you like best?
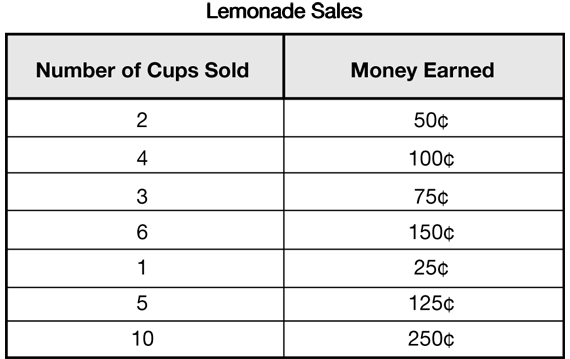
Direct students' attention to Question 5. See Figure 8.
- Did you notice any patterns going down the columns? (Possible response: No. The numbers seemed to be in random order.)
Some students may find and use patterns while looking down the Number of Cups Sold column. For example, some may notice that 2 cups doubled is 4, and 50¢ doubled is 100¢; 3 cups doubled is 6, and 75¢ doubled is 150¢. That relationship may help them determine that 125¢ would buy 5 cups of lemonade, and then that 10 cups of lemonade would be double that, 250¢. However, in this type of table, it is important that students recognize the relationship between the numbers going across the rows. In other words, 25¢ times the number of cups sold will tell you the money earned.
- Did you notice any patterns going across the rows? (Possible response: Yes. I could see that 2 cups of lemonade sold earned 50¢, 3 cups earned 75¢, and 4 cups earned 100¢. I noticed for every additional cup sold, I could add on 25¢.)
- What strategies did you use to complete the table? (Possible response: I thought about quarters. I looked at the patterns and saw that for every cup sold, one quarter was earned. Or, I used a guess-and- check strategy. I thought about 2 times what number could equal 50.)
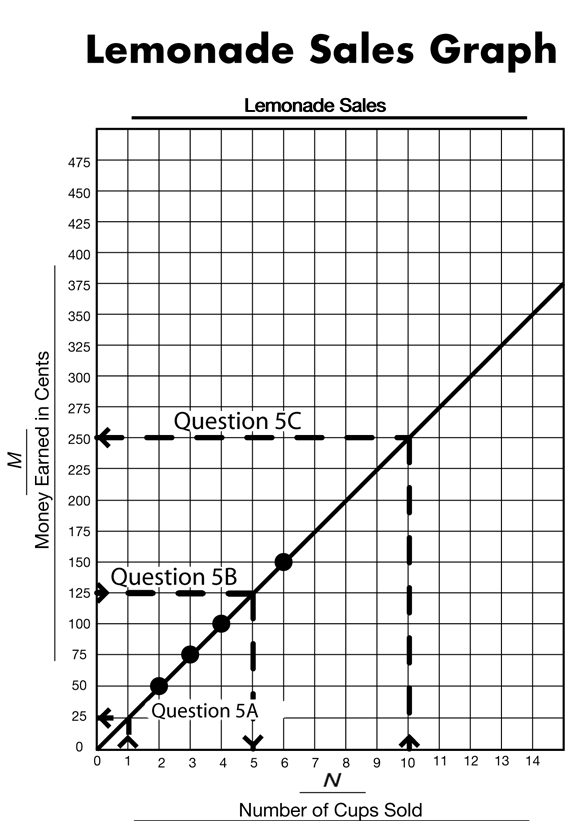
Display the Lemonade Sales Graph Master. Tell students you are going to make a graph to check the reasonableness of the answers to Question 5. Plot the data points from the Lemonade Sales table and use a ruler to draw a straight line connecting the points. Ask student volunteers to draw dotted lines on the graph to show how they use it to verify the information in the data table. See Figure 9.
- Use the graph to show that 1 cup of lemonade is 25¢ (Question 5A).
- Show how to find out how many cups of lemonade were purchased with 125¢ (Question 5B). (5 cups)
- Use the graph to show how much 10 cups of lemonade cost (Question 5C). (250¢)
- Katie's brother recorded the sale of 7 cups of lemonade as 170¢. Do you think he recorded the sale correctly? Why or why not? (No. Possible explanation: 170¢ does not follow the pattern in the data table. I know that 6 cups are 150¢, so one more cup adds on one more quarter, 175¢. If I use the graph to check, 7 cups equals 175¢, not 170¢.)