Solve Mr. Green's Gumball Problems. Direct students to the Mr. Green's Giant Gumball Jamboree page in the Student Guide. Tell students Mr. Green sells giant gumballs for 20 cents each. Ask them to solve Questions 1–5 and to be prepared to share their strategies with the class. While students are working, identify students who will display a solution to each question. As students share their solutions with the class, leave these solutions posted for reference. These examples will help students develop strategies as they solve problems later in the lesson.
After all the solutions are posted ask student pairs to discuss Question 6. Gather student ideas in a list. Students should suggest that Mr. Green make a data table or a graph to help solve problems related to the cost of the gumballs.
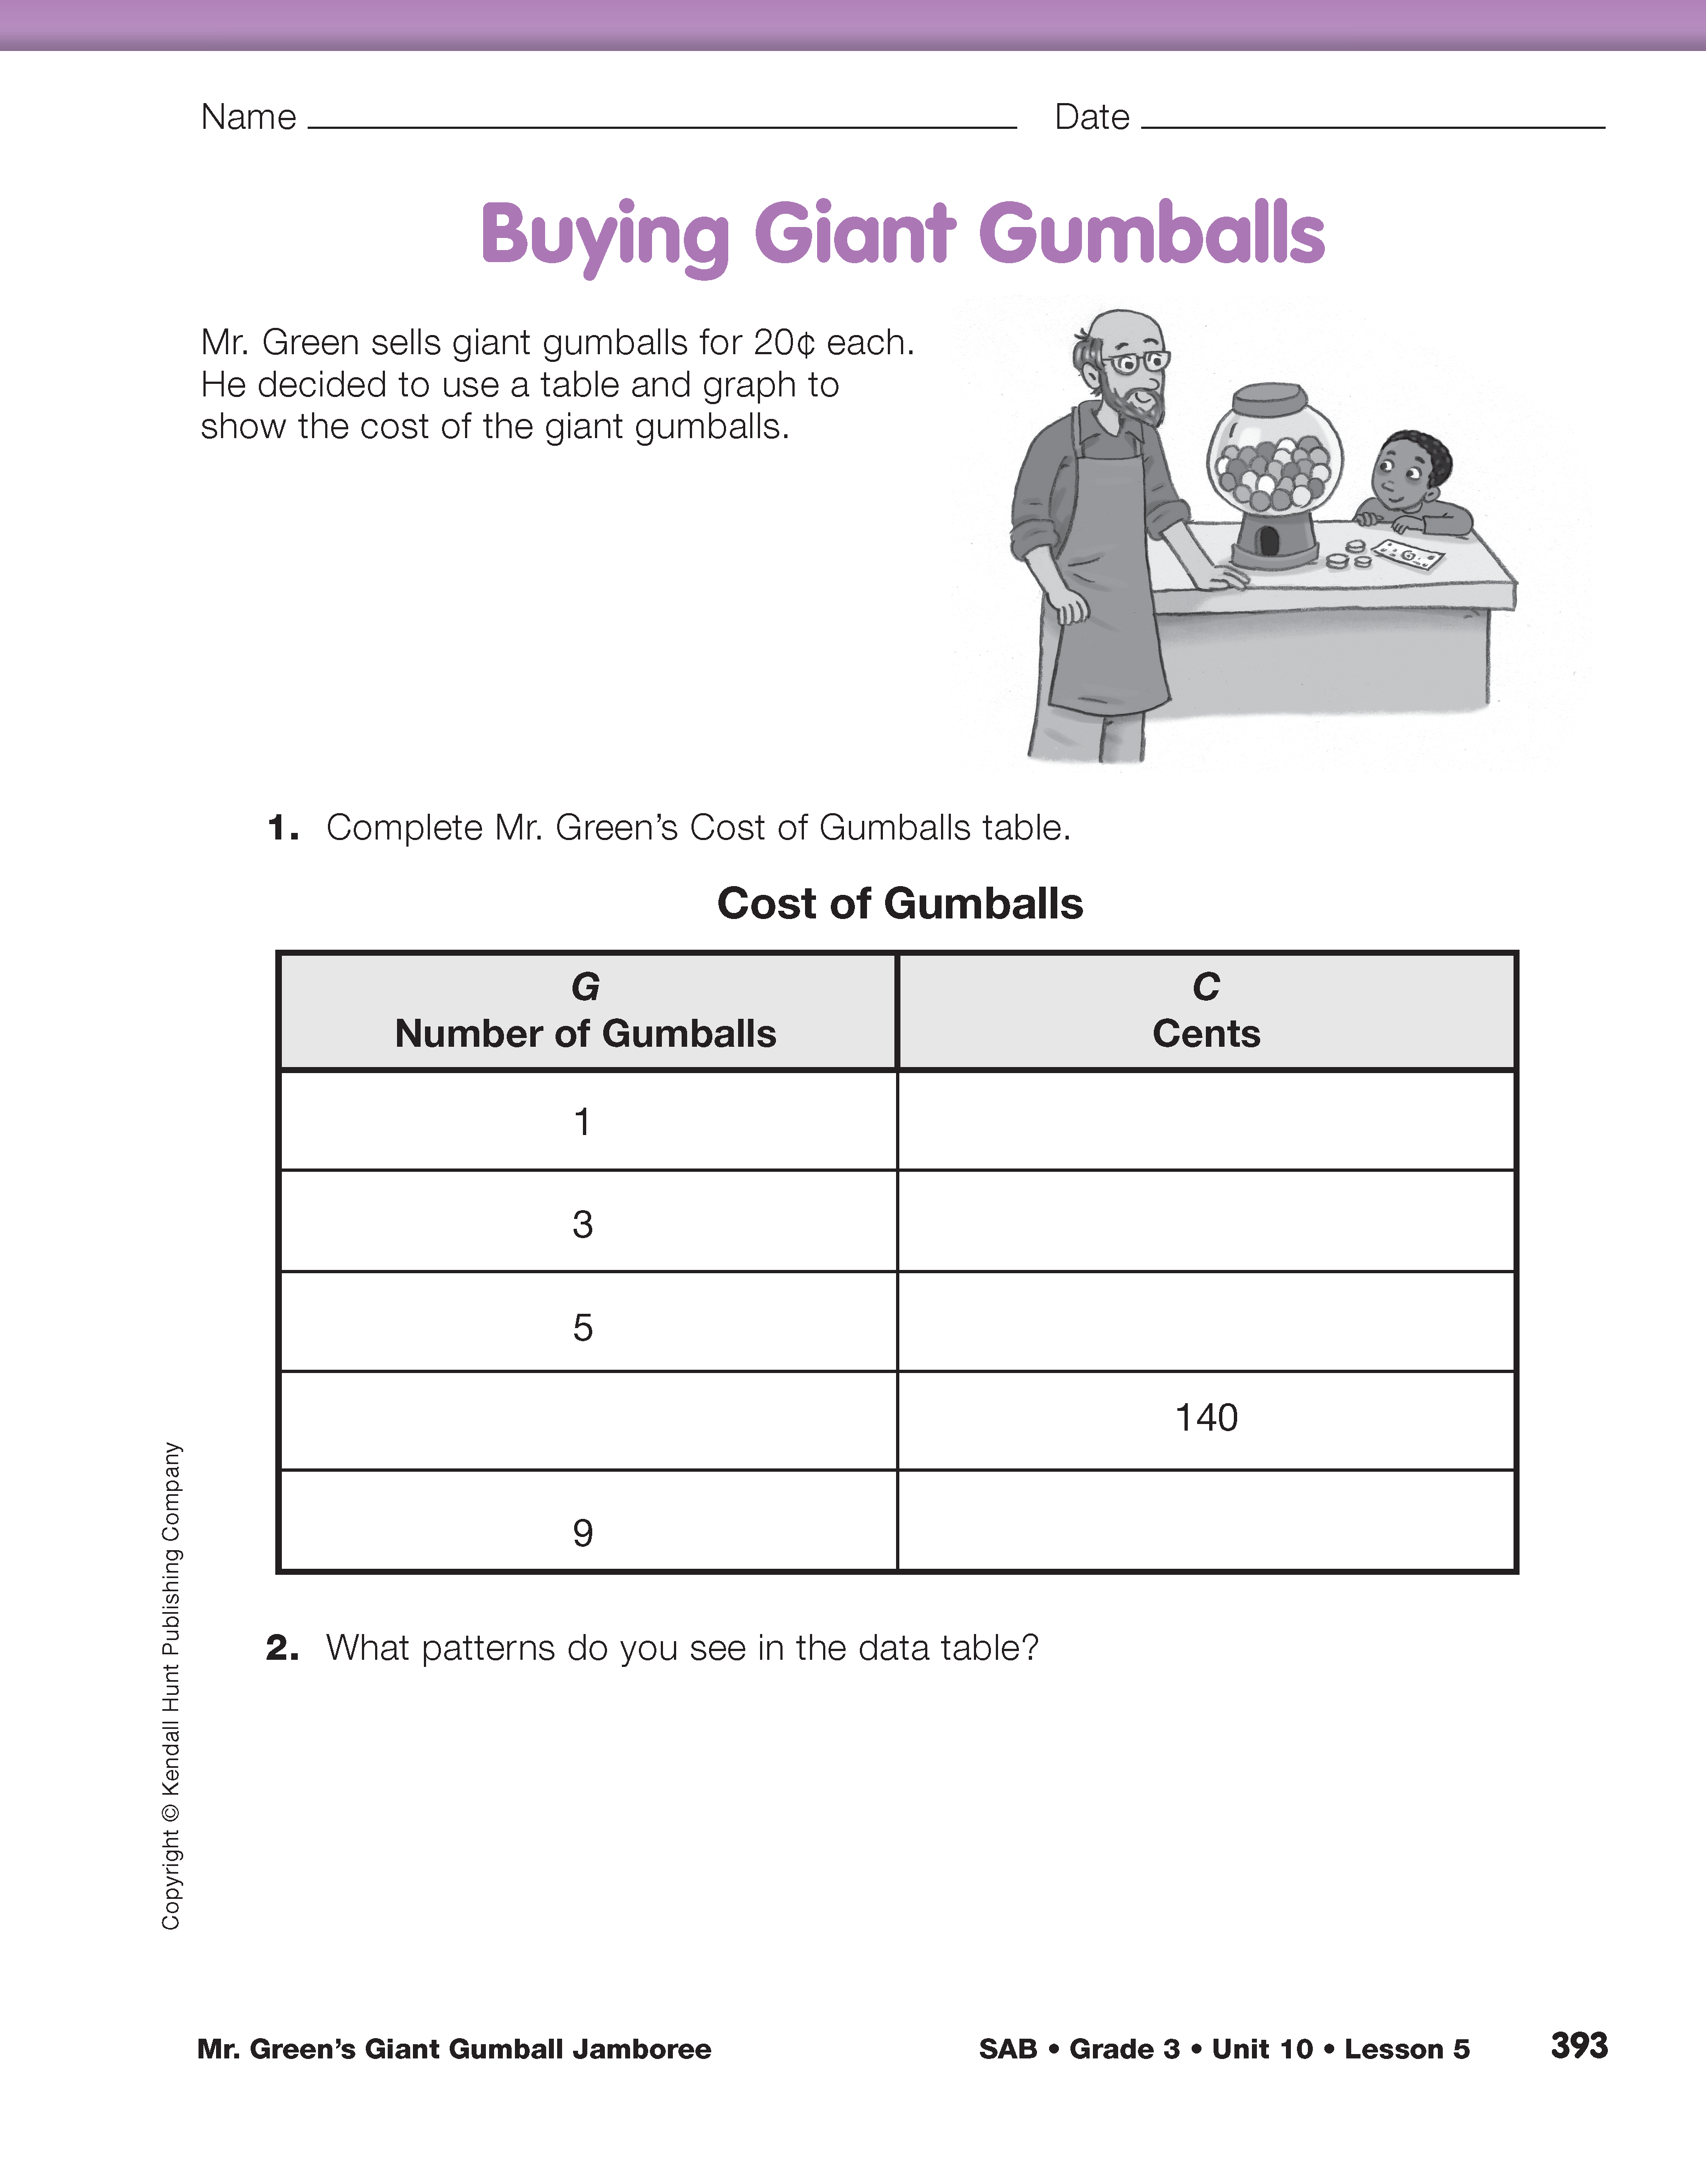
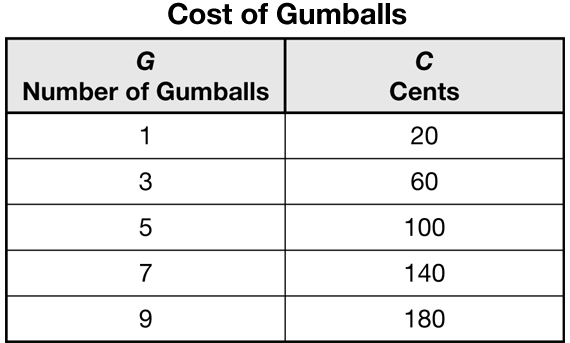
Identify and Represent Multiplicative Patterns. Ask students to remove the Buying Giant Gumballs pages in the Student Activity Book and assign Questions 1–2. Allow student pairs to develop their own strategies for completing the Cost of Gumballs data table. A completed data table is shown in Figure 1.
Display the Cost of Gumballs data table from the Student Activity Book. Complete the table and discuss the patterns in the table.
- Do you see any patterns going down the columns? (Possible response: The numbers in the Number of Gumballs column are odd numbers. The cost of the gumballs always ends in zero and goes up by 40¢ between each row.)
- Do you see any patterns going across the rows? (Possible response: The numbers on the right come from multiplying the numbers on the left by 20.)
- Explain how you figured out what to put in the data table. (Possible response: I thought about the patterns. I knew the numbers for the Number of Gumballs column had to be odd: 1, 3, 5, 7, 9. I knew one gumball was 20¢ and that the cost of the gumballs always ended in zero, so I skip counted by 20, missing every other number: 20, 60, 100, 140, 180.)
- What is another name for 140 cents? 180 cents? ($1.40, $1.80)
- Explain how to use the data table to figure out how much 6 gumballs would cost, and write a number sentence to show your solution. (120¢ or $1.20. Possible response: The numbers in the Cents column come from multiplying the numbers in the Number of Gumballs column by 20. I added six 20s: 20 + 20 + 20 + 20 + 20 + 20 = 120.)
- Explain how to use the data table to find the cost of 11 gumballs, and write a number sentence to show your solution. (220¢ or $2.20. Possible response: I see that 9 gumballs cost 180¢. I continue the pattern going down the Number of Gumballs column and add the odd number 11. I continue the pattern going down the Cents column by adding 40 to the number before it. 180¢ + 40¢ = 220¢.)
Use Patterns in a Table. Ask students to revisit Questions 1–5 in the Student Guide but this time use the table to solve each problem. Encourage students to use the information in the table to solve each problem. For example, the solution to Question 4 cannot simply be read from the table. A student may use the cost of 5 gumballs first. Since 5 gumballs cost 100 cents, then 10 gumballs cost 200 cents. 3 gumballs cost 60 cents, which is too much. Chris can purchase 12 gumballs with $2.50 and have some money, 10 cents, left over.
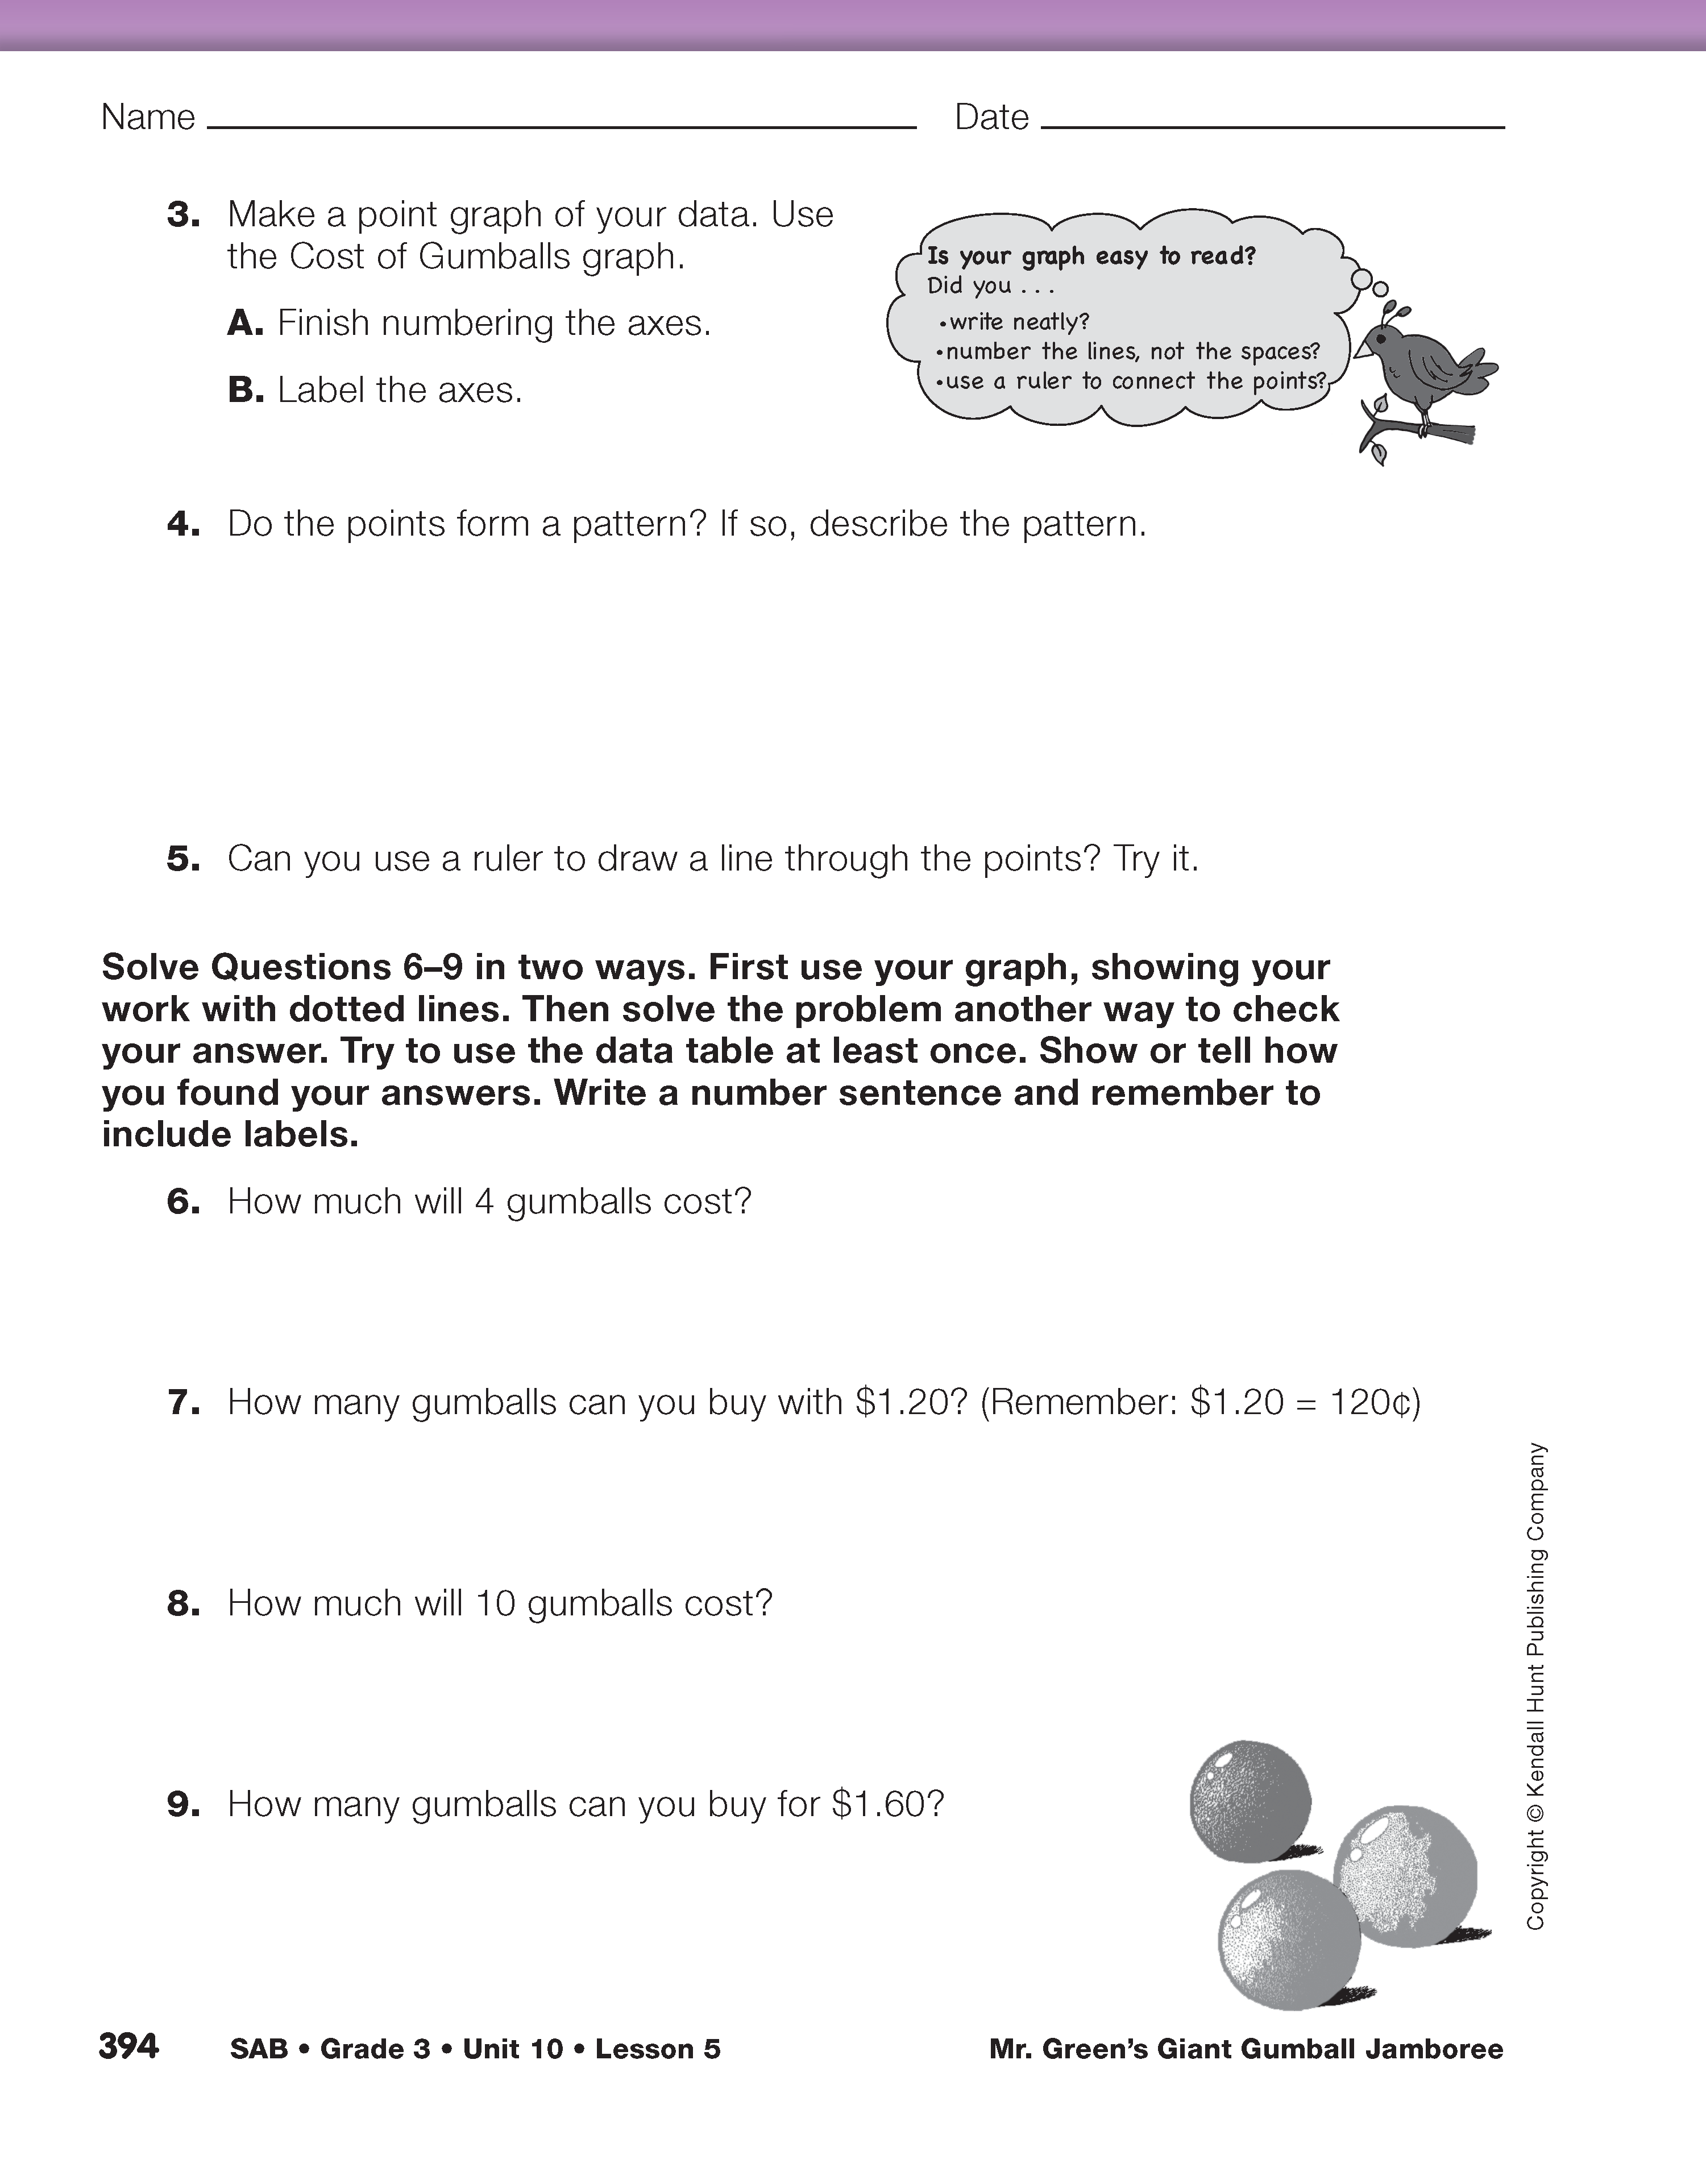
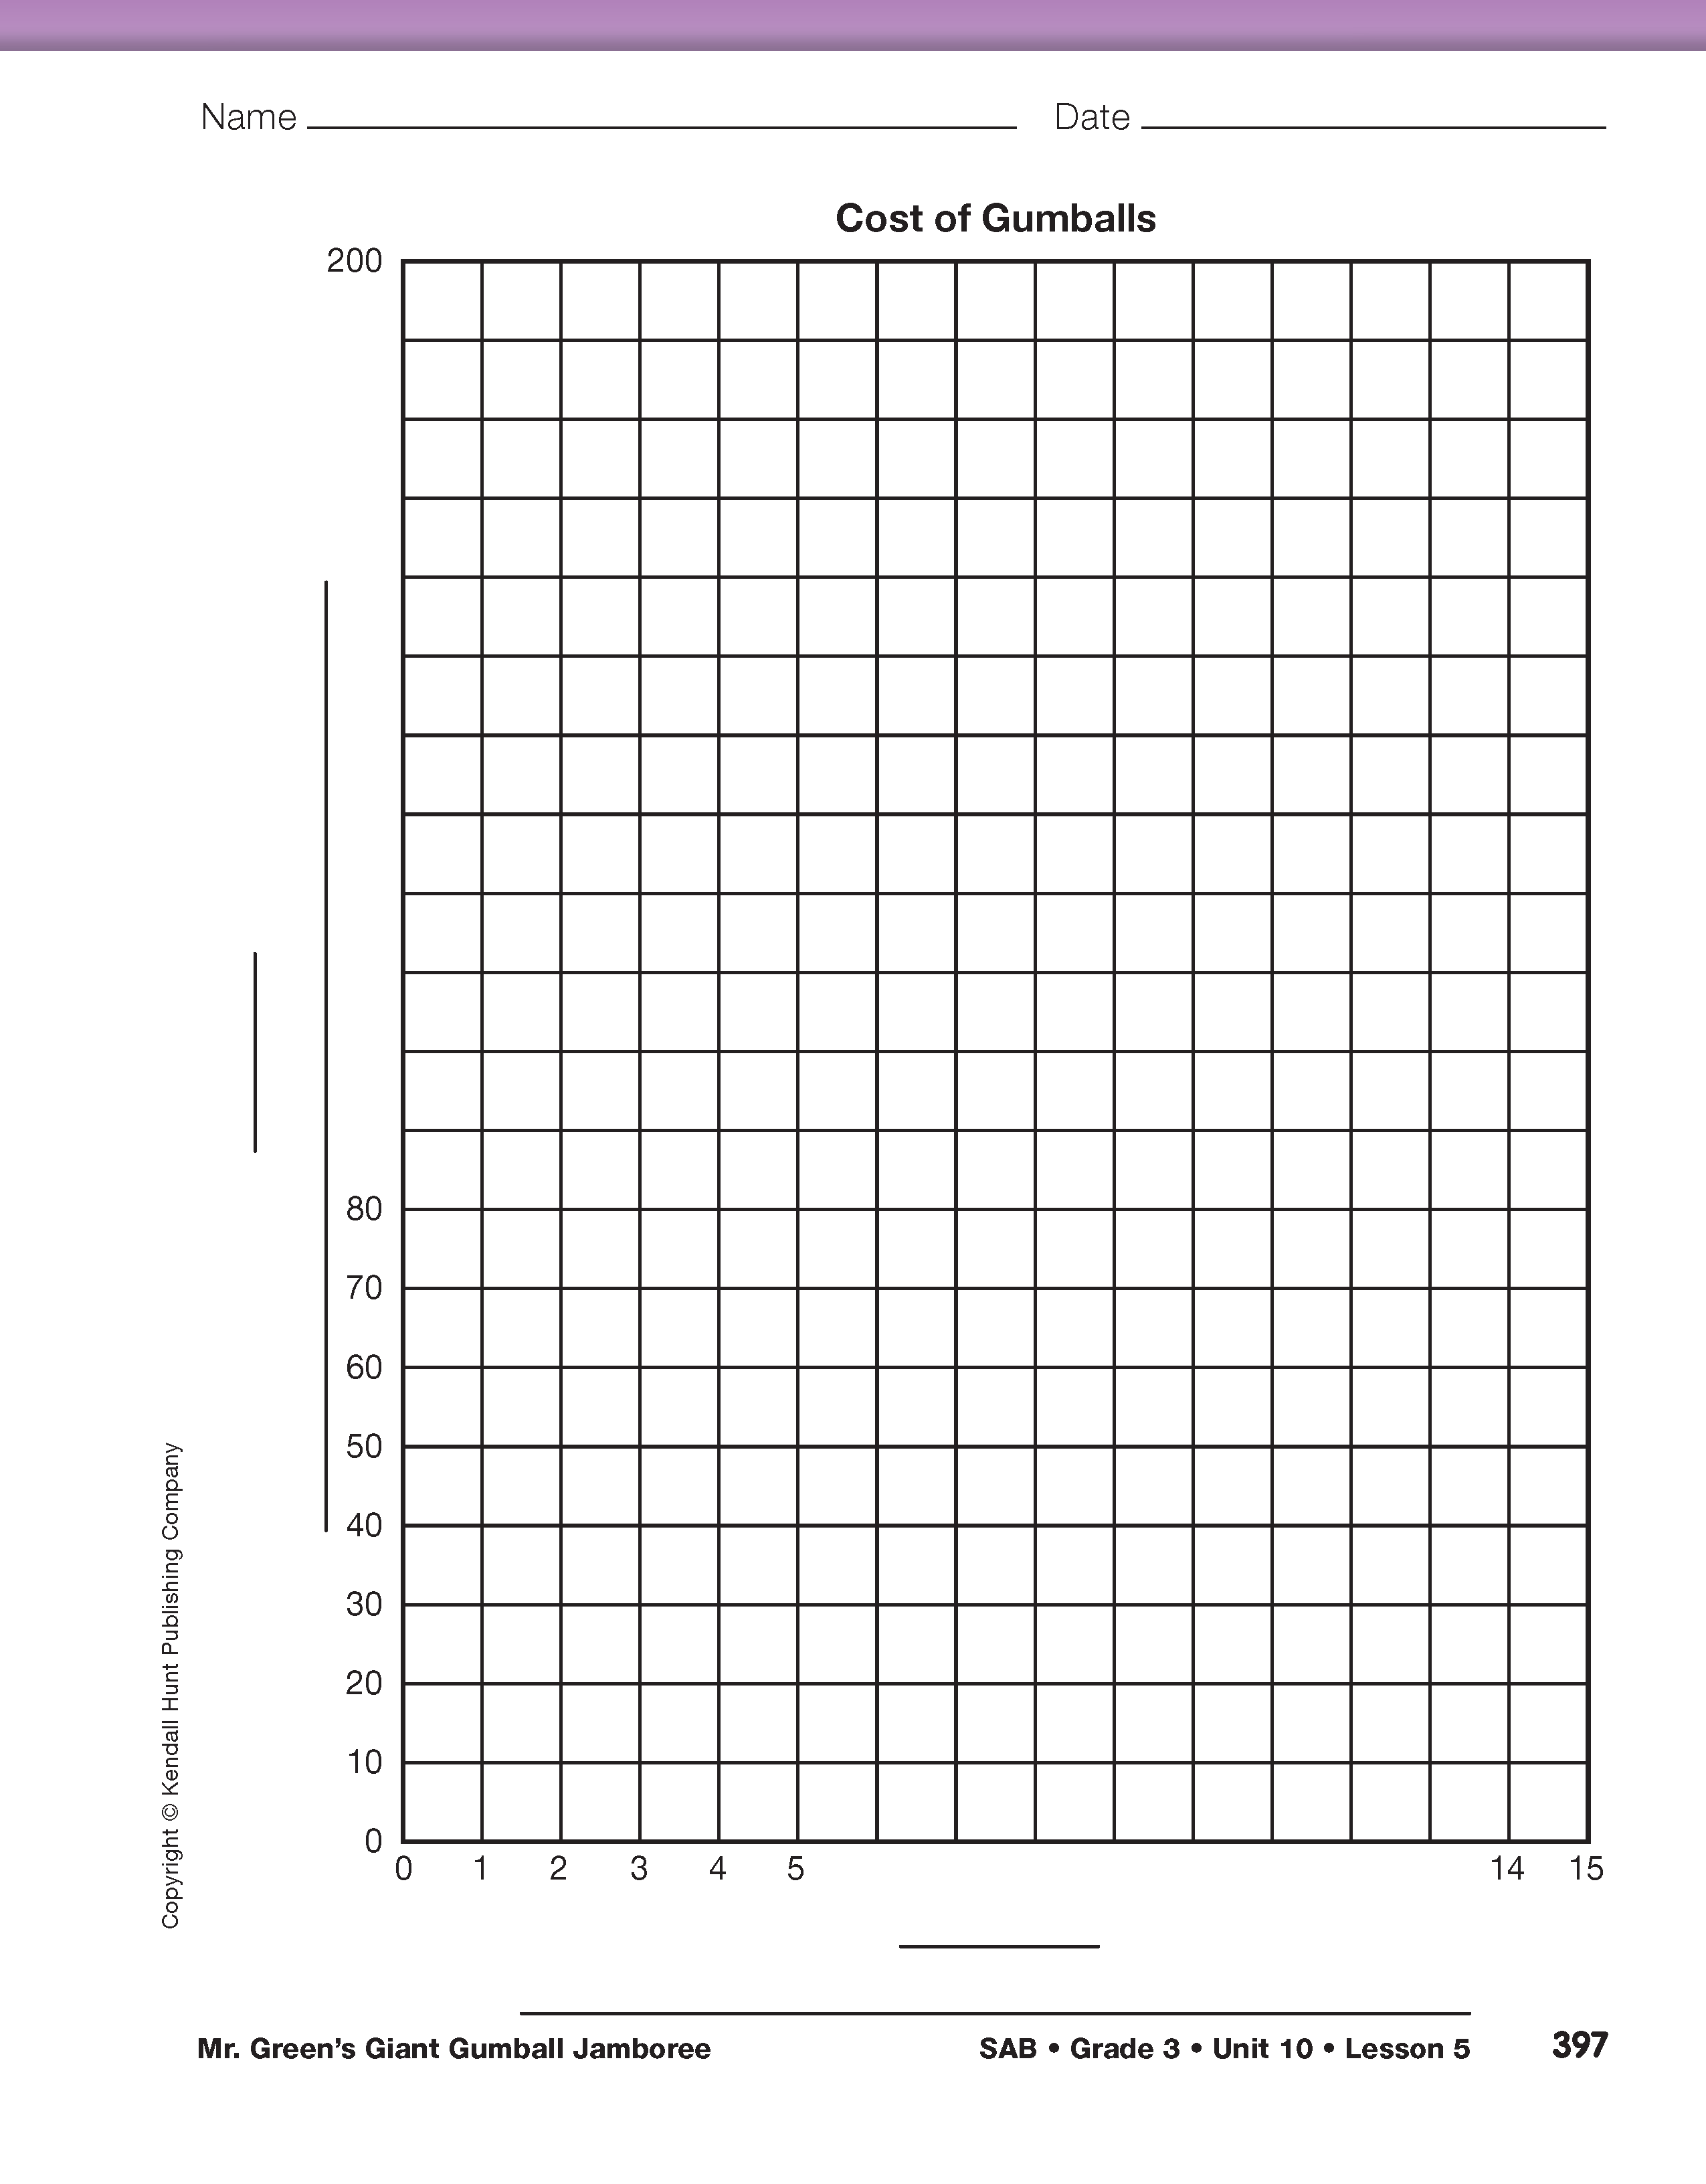
Make Point Graphs. Show students a display of the Cost of Gumballs graph from the Buying Giant Gumballs pages in the Student Activity Book. Explain that they will be making a point graph of their data. A complete graph is shown in Figure 2.
- What do you notice about the numbers on the horizontal axis? (They count by ones: 1, 2, 3, etc.)
- What do you notice about the numbers on the vertical axis? (They skip count by 10s.)
- How should we label the axes? (Label the horizontal axis G and Number of Gumballs; label the verical axis C and Cents.)
- How can we make the graph easy to read? (Possible responses: We should write neatly, finish numbering the axes, number the lines and not the spaces, label the axes, and use correct spelling.)
- How will you graph the Cost of Gumballs data?
Some students will suggest to start by drawing a bar graph. Other students may see that they can find the point at the top of the bar without drawing the bar. For example, to find where the top of the bar for 3 gumballs and 60 cents would be, students can go across on the horizontal axis until they find 3 gumballs and then go up that line on the graph until it meets the line for 60 cents. Allow one or two student volunteers to show the class how they would graph the data points on a display of the graph and then assign Questions 3–5 to students.

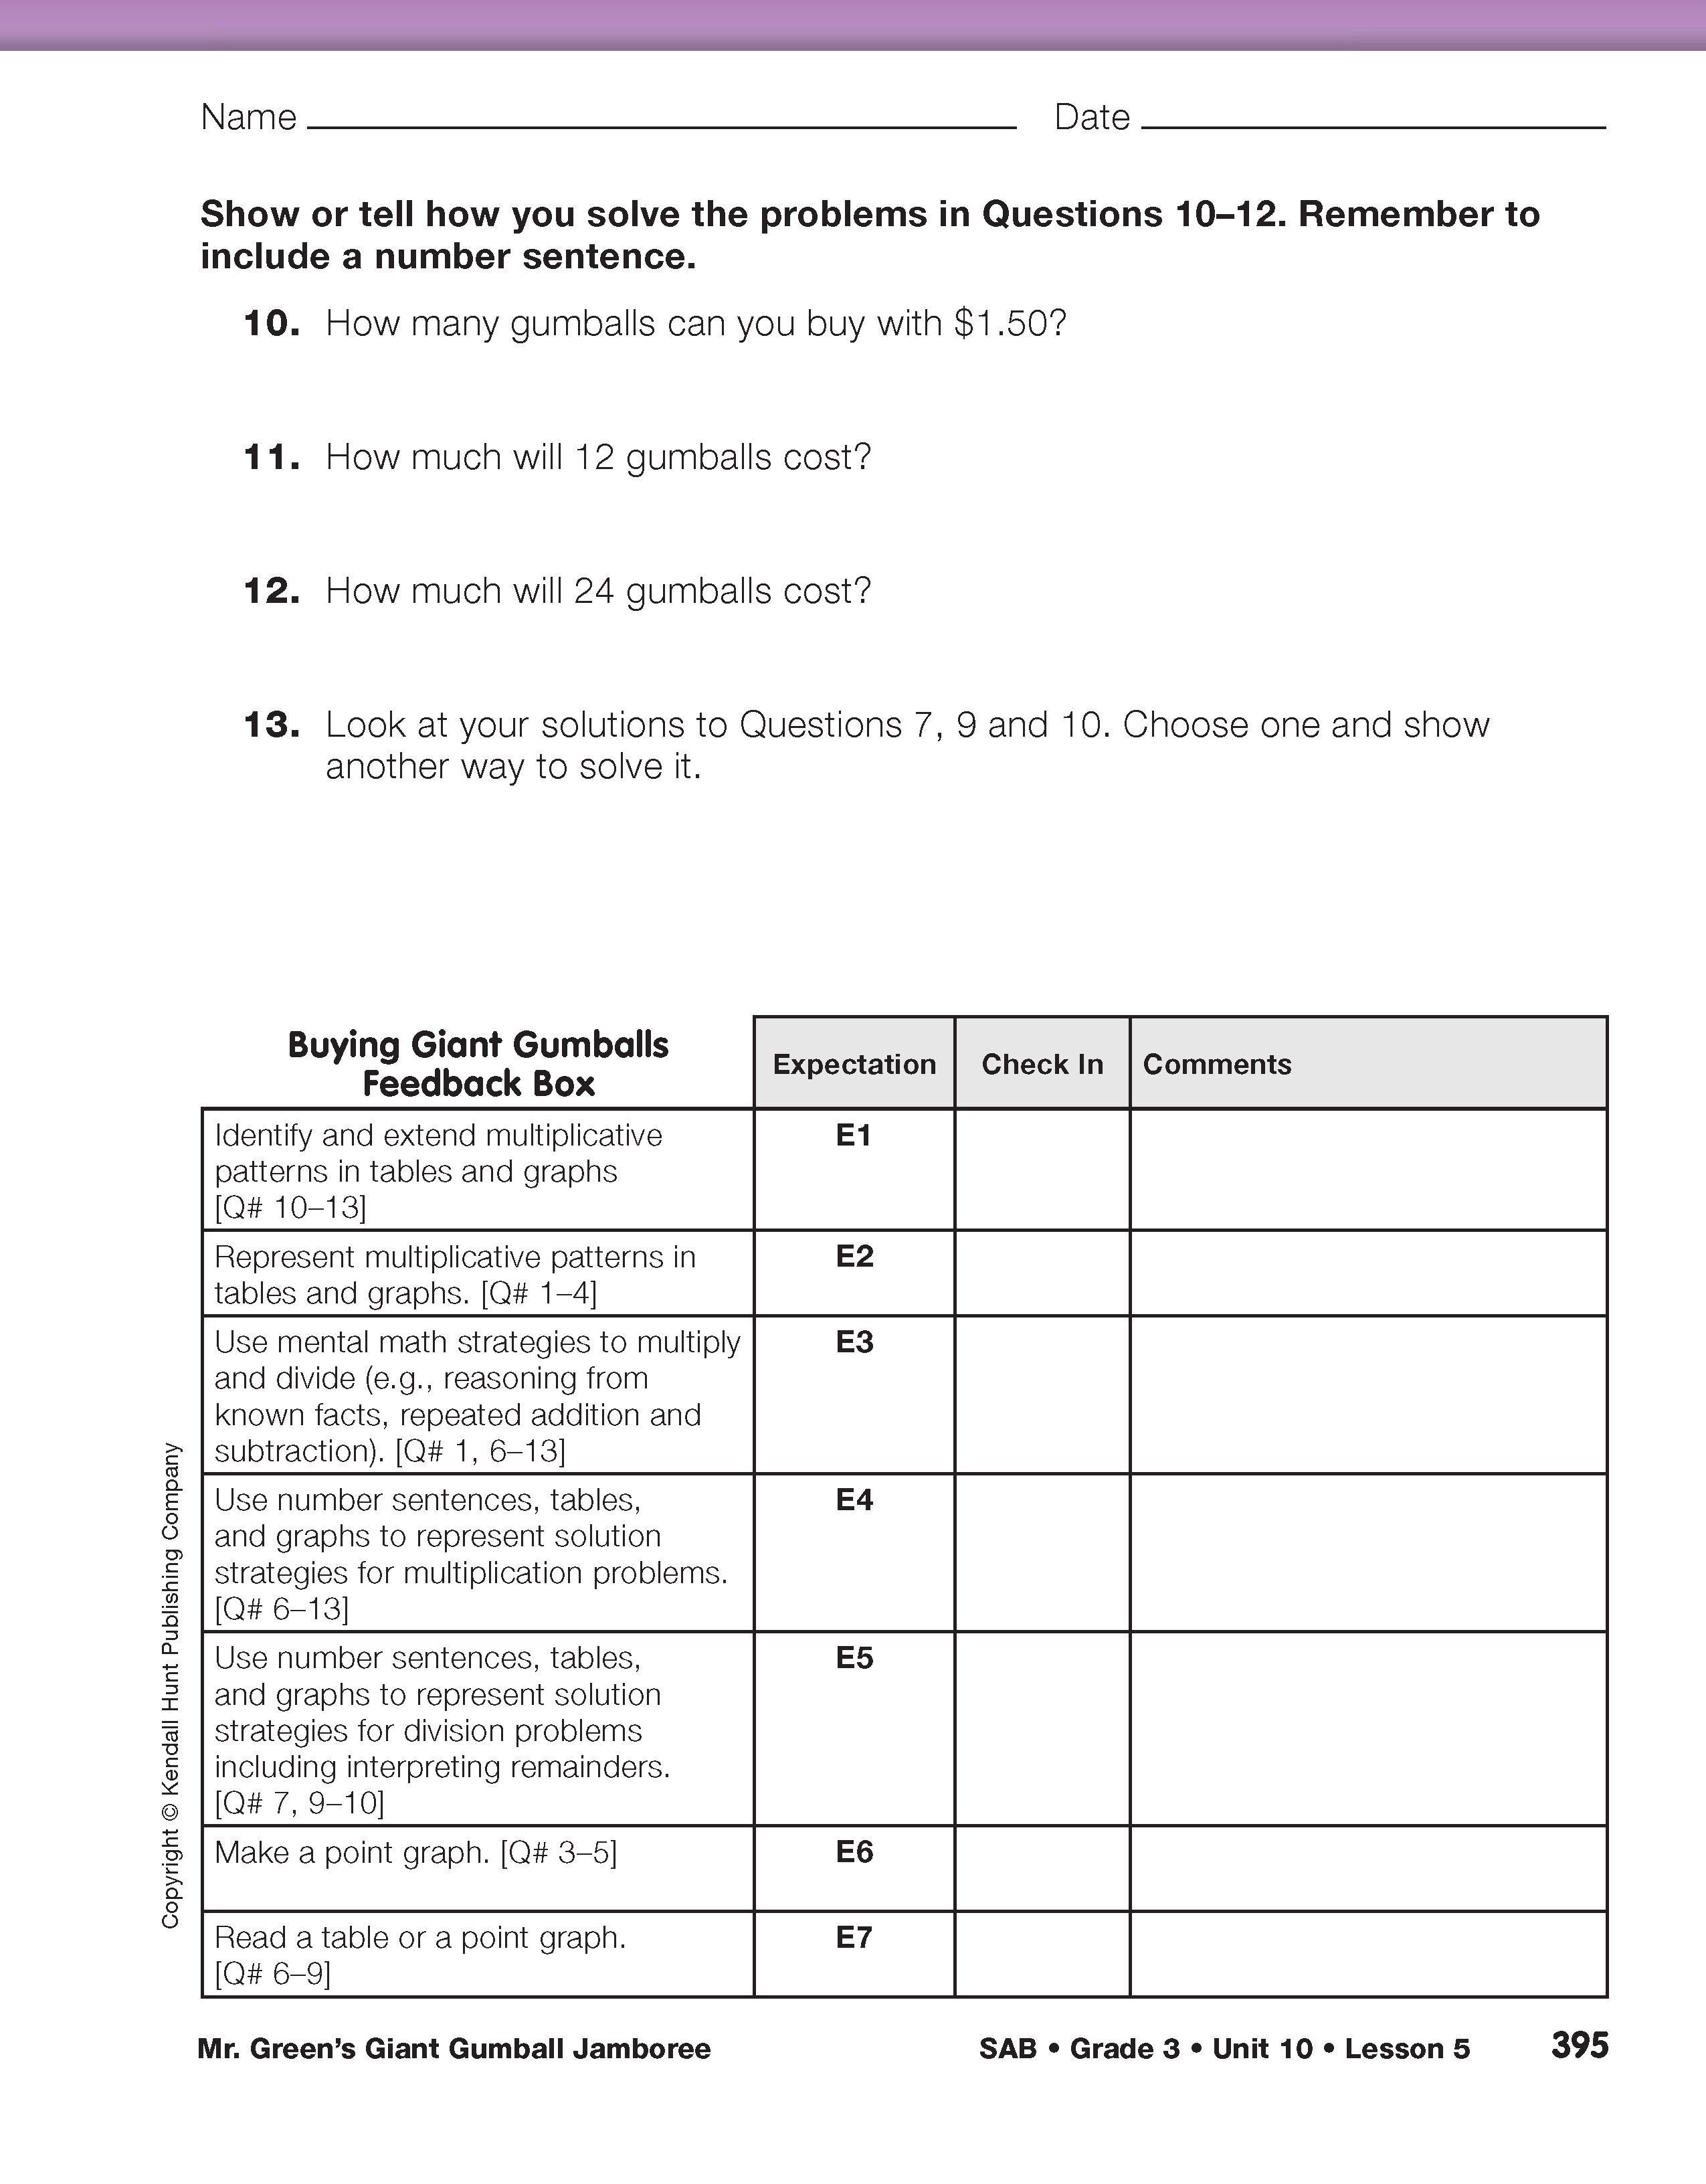
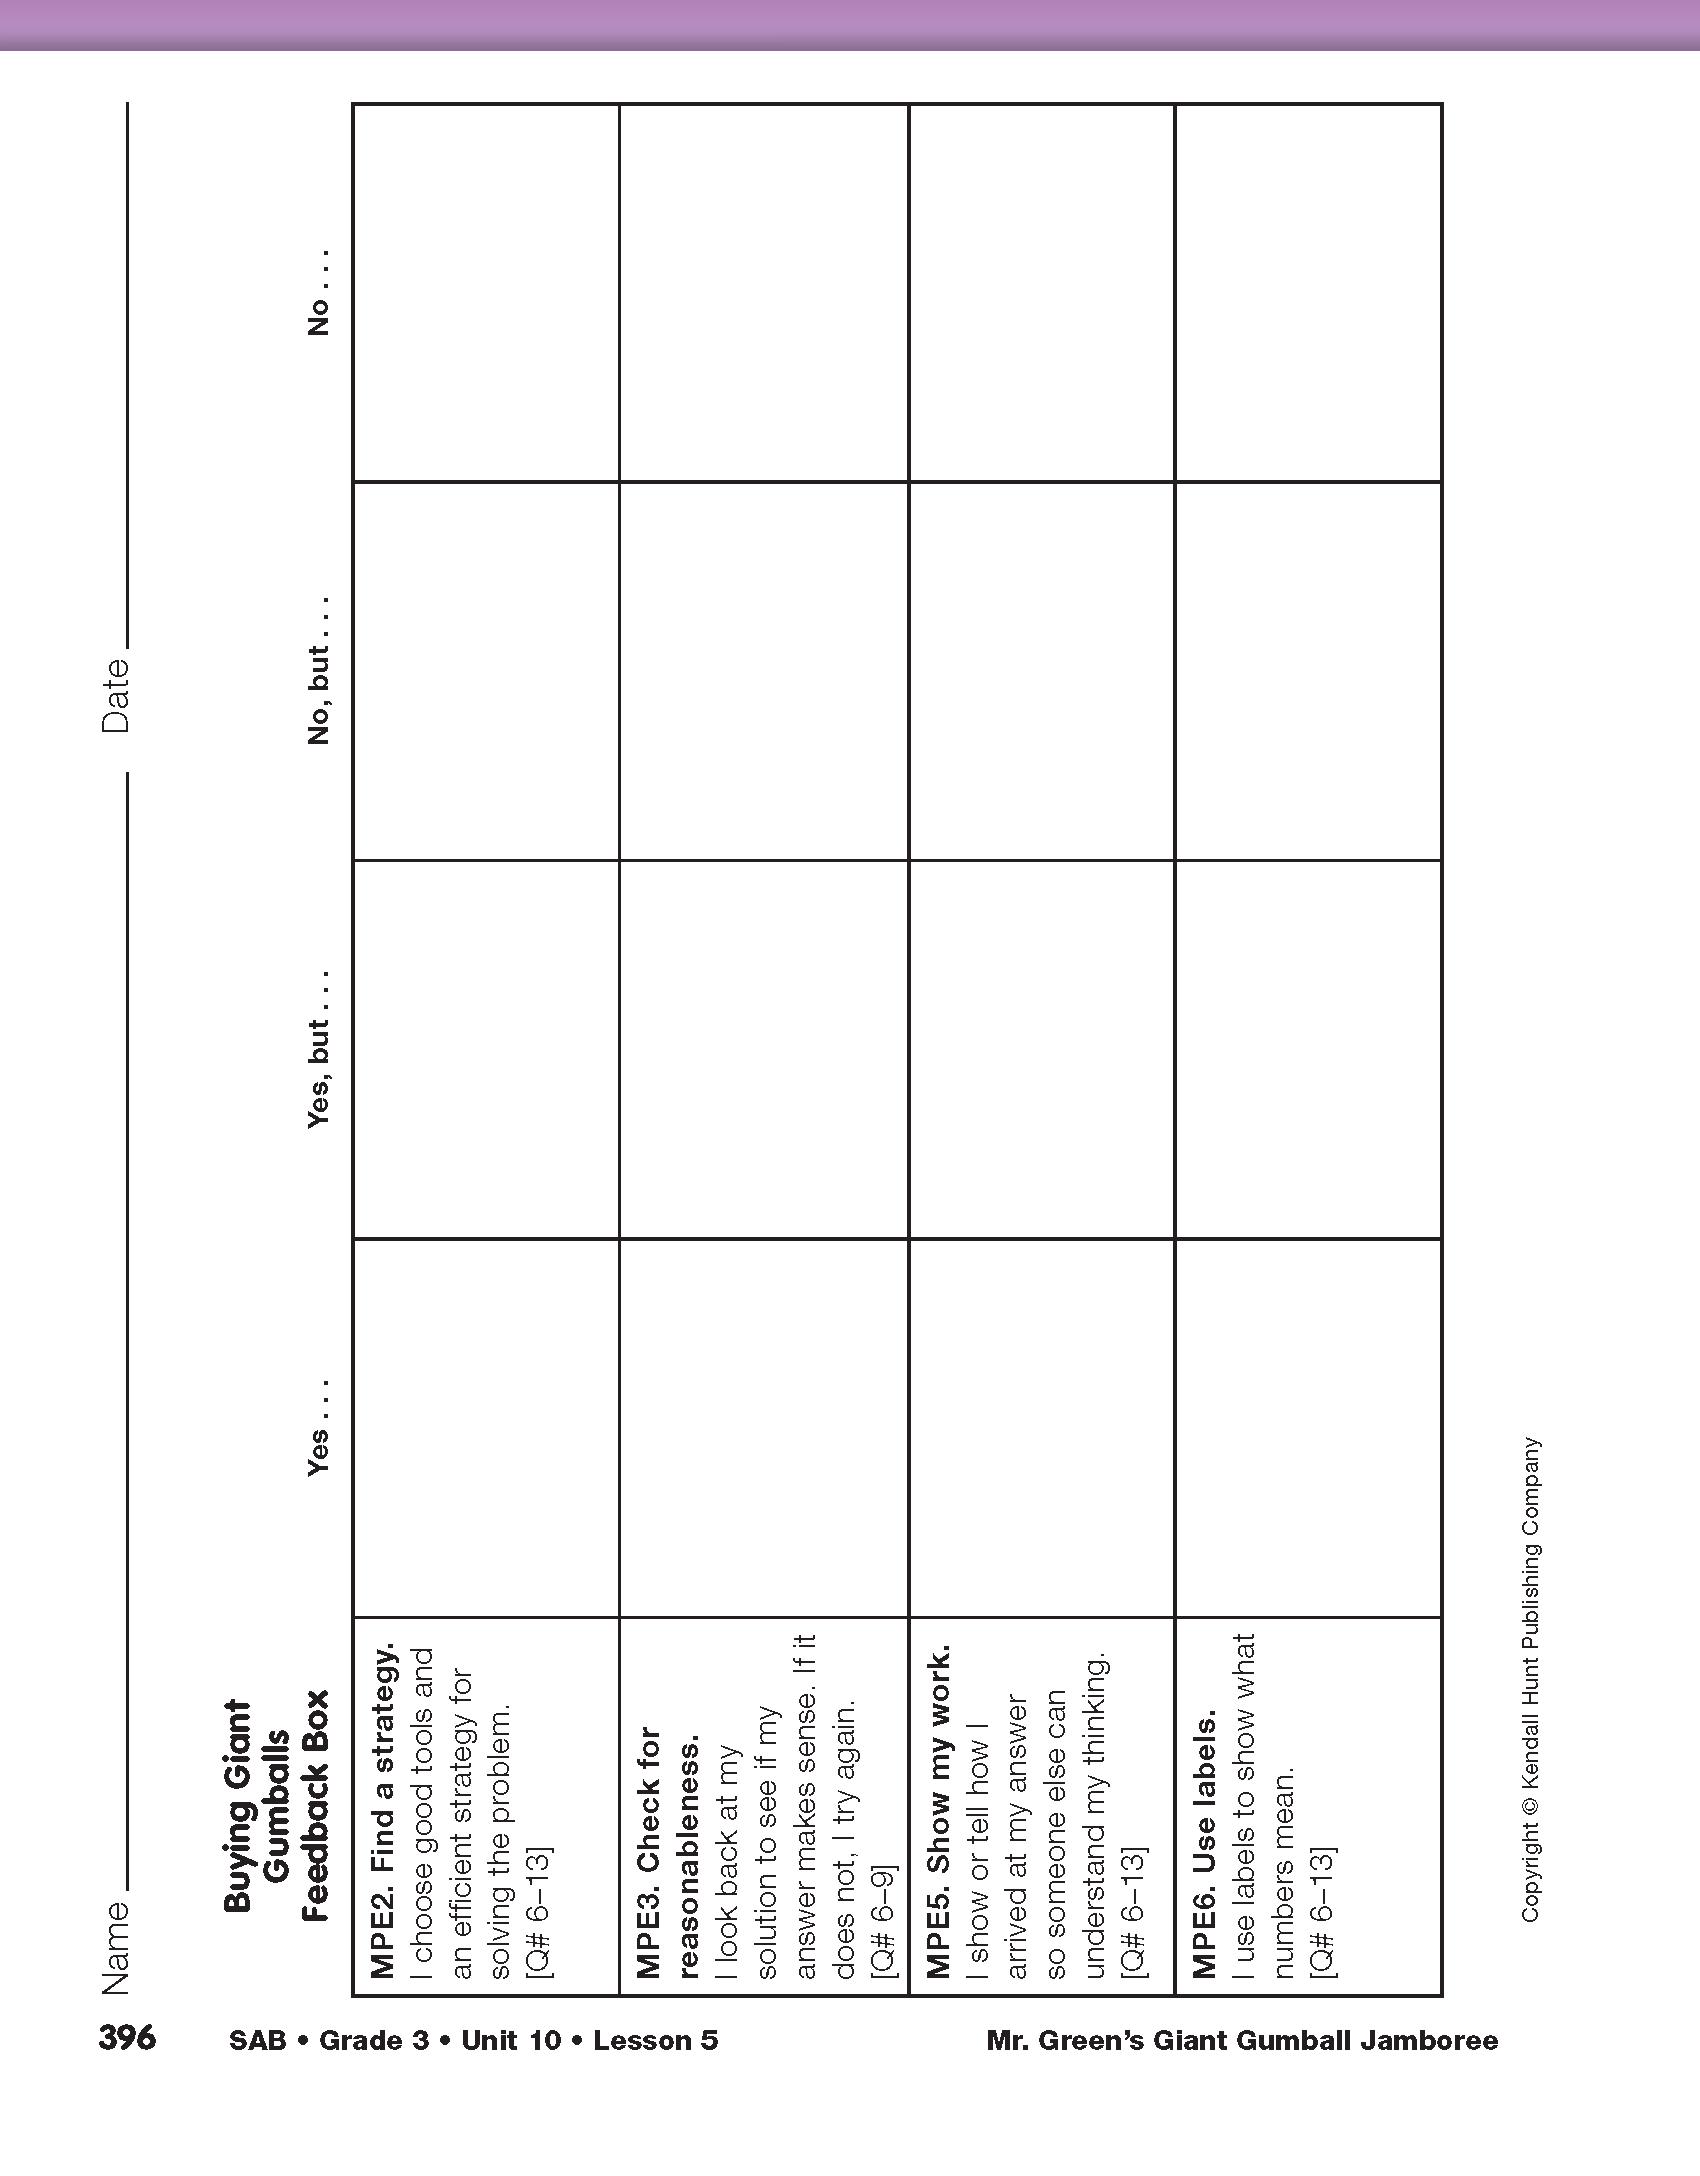
Use Buying Giant Gumballs with Feedback Box in the Student Activity Book to assess students' progress toward the following Expectations:
- Identify and extend multiplicative patterns in tables and graphs [E1].
- Represent multiplicative patterns in tables and graphs [E2].
- Use mental math strategies to multiply and divide [E3].
- Represent solution strategies for multiplication problems with number sentences, tables, and graphs [E4].
- Represent solution strategies for division problems including interpreting remainders [E5].
- Make a point graph [E6].
- Read a table or a point graph [E7].
Use Buying Giant Gumballs to assess students' abilities to communicate their solutions using the following Math Practices Expectations:
- MPE2.
- Find a strategy.
- MPE3.
- Check for reasonableness.
- MPE5.
- Show my work.
- MPE6.
- Use labels.
This activity can be modified to provide targeted practice with the interconnected Expectations in this unit. Change the cost of Mr. Green's giant gumballs to meet student needs. For students who are “Working on It,” change the cost to 10 cents each, for students who are “Getting It,” change the cost to 30 cents, and for students who “Got It,” change the cost to 25 cents. The questions and table can remain unchanged. Provide copies of the Centimeter Graph Paper Master.

Allow students to use calculators and multiplication tables as needed to check work or to solve some of the more complex problems presented in Buying Giant Gumballs. The appropriate use of these tools allows students who are still learning their facts and how to multiply by tens to further their understanding of these concepts while solving the problems.
Question 4 asks if the points form a pattern. Students may say that the points form a line that goes up. Students then draw a line through the points to complete Question 5. Insist that students draw their lines with rulers. Ask them to extend their lines in both directions.
Before continuing with the questions, have students look back at their graphs to be sure that they are correct. They can compare their graphs to their neighbors' graphs. Ask the volunteers to display their graphs.
Use the checklist the class generated in Lesson 1 for making point graphs with the following prompts:
- How did you label the horizontal axis? (Number of Gumballs.)
- What letter did you use for Number of Gumballs? (G)
- How did you label the vertical axis? (Cents)
- What letter did you use for Cents? (C)
- How is the horizontal axis numbered? (by ones)
- How is the vertical axis numbered? (by tens) Count by tens again to see that you numbered correctly.
- Did you graph your points correctly? Did you go across on the horizontal axis to 1 and go up to 20 for the first point? Across the horizontal axis to 3 up to 60 for the next point? [Ask the volunteers to demonstrate how they graphed these points.]
- Did you draw a line through the points with a ruler? Did you extend it in both directions?
Discuss what the points on the graph represent. Ask:
- Which point shows that 1 gumball costs 20¢?
Which point shows that 3 gumballs cost 60¢?
Which point shows that 9 gumballs cost 180¢?
- Explain how to use the graph to find out how much 2 gumballs cost. (Possible response: I went across the horizontal axis until I found the 2 for two gumballs. That is what the G is for. Then I went up until I came to the diagonal line. Then I went over to see what number is on the side on the vertical axis. It says 40 and that's cents. The numbers that go up are for cents.)
Read Point Graphs. Demonstrate using a ruler to show how to use the graph to find the cost of two gumballs. Draw dotted lines with a ruler as shown in Figure 3.
- We used the graph to find out how much 2 gumballs cost. How could we solve the problem a second way to check your calculations and solution? (Possible responses: We could use patterns in the data table, use repeated addition, skip count, or use known multiplication facts.)
- What if your answers don't match after you solved the problem with a second method? (It shows that I made a mistake and that I should look back and correct it.)
Assign Questions 6–9. Students solve problems about the data in two ways. For one method, they use their graphs. Remind students to show how they used the graph by drawing dotted lines as shown in Figure 3. Students devise their own strategies for a second method. Remind students to use some of the same reasoning strategies posted during the discussion of Questions 1–5 in the Student Guide earlier in the lesson. Encourage students to use a method involving the data table at least once. See TIMS Tip.
The strategies posted as part of the discussion of Questions 1–5 in the Student Guide can be used to encourage students to use more efficient and varied reasoning strategies. For example, if students are using drawings and counting ask them to use a repeated addition strategy for one of the problems.
Upon completion, ask students to explain their solutions to Questions 6–9. Have one student demonstrate how to use the graph. The other student will show how he or she used a second method and will write a number sentence that matches the solution.
- For Question 6, how did you use the graph to find the cost of 4 gumballs? (Possible response: I drew dotted lines up from the 4 on the horizontal axis, Number of Gumballs, and stopped at the line I drew with the ruler. I drew a dotted line to the 80 on the vertical axis, Cents. The dotted lines intersect at the point for 4 gumballs and 80¢.)
- Explain your second method for solving the same question and show your number sentence. (Possible response: I used the patterns in the data table. Only odd numbers are on the table, but I knew 4 gumballs would be in between 3 and 5. The pattern in the Cents column is skip counting by 20 but missing every other number. If all the numbers were on the table, I could just skip count by 20 four times—20, 40, 60, 80. 20¢ + 20¢ + 20¢ + 20¢ = 80¢, or 4 × 20¢ = 80¢.)
- For Question 9, how did you use the graph to find out how many gumballs you could buy with $1.60? (Possible response: I found 160¢ on the vertical axis. I drew a dotted line over to the diagonal line I drew with the ruler. From that point, I drew a dotted line down to the horizontal axis. 8 is the number of gumballs on the horizontal axis.)
- Explain a second method to solve Question 9. (Possible response: I reasoned from a known fact. I knew gumballs were 20 cents each. I thought 20 times what number equals 160. I knew 2 × 8 = 16, so 20 × 8 = 160.)

For Questions 6–9 some students who find solutions using the graph first may then have difficulty representing the solutions with number sentences. To help them focus on multiplication and division strategies you may choose to change the order of the directions by having them represent solutions with number sentences first then using the graph as a second way to check answers.
Interpret Remainders and Extend Patterns. Question 10 asks students to interpret remainders. Questions 11–12 challenge them to solve problems that lie beyond the data on the graph. Students may use any strategy to solve the problems and must show or tell how they arrived at their solutions.
Direct students' attention to a display of the Math Practices page from the Student Guide Reference section.
Refer to Questions 10–12 and ask:
- What are some of the strategies you could use to solve these problems [MPE2]? (Possible response: I could use patterns in the data table or graph, use repeated addition or multiplication, or reason from a known fact.)
- How will you show your work [MPE5] and use labels [MPE6]? (Possible response: I will show or tell all the steps I took and explain what the numbers mean by using labels like gumballs and cents.)
Assign Questions 10–13.