


Lemonade Stand
Est. Class Sessions: 2Developing the Lesson
Part 1. Using Strategies to Develop Multiplicative Reasoning
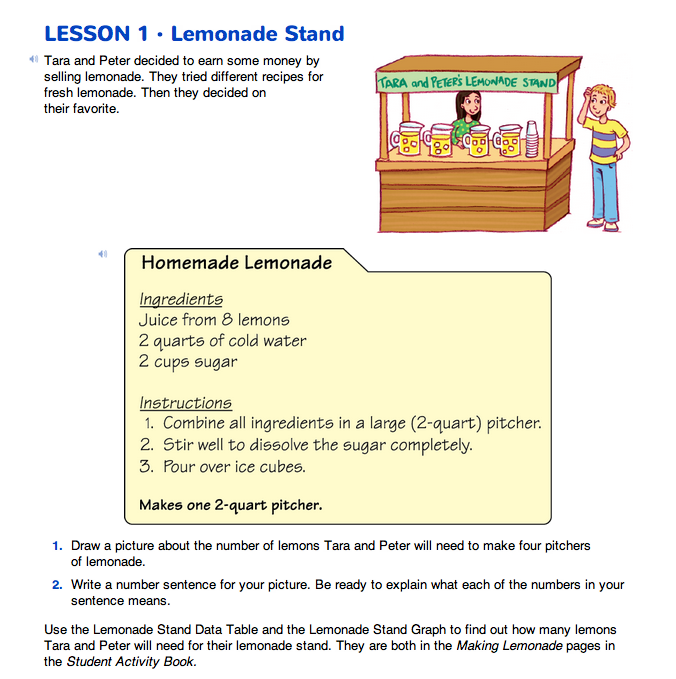
Explore Strategies. Read the recipe for homemade lemonade on the Lemonade Stand page in the Student Guide. Tara and Peter are faced with a problem: they need to know how many lemons to buy for the number of pitchers of lemonade they plan to sell. Discuss with students how to determine the number of lemons Tara and Peter will need.
Ask:
Assign Questions 1–2 to student pairs.
After students have completed their work, ask:
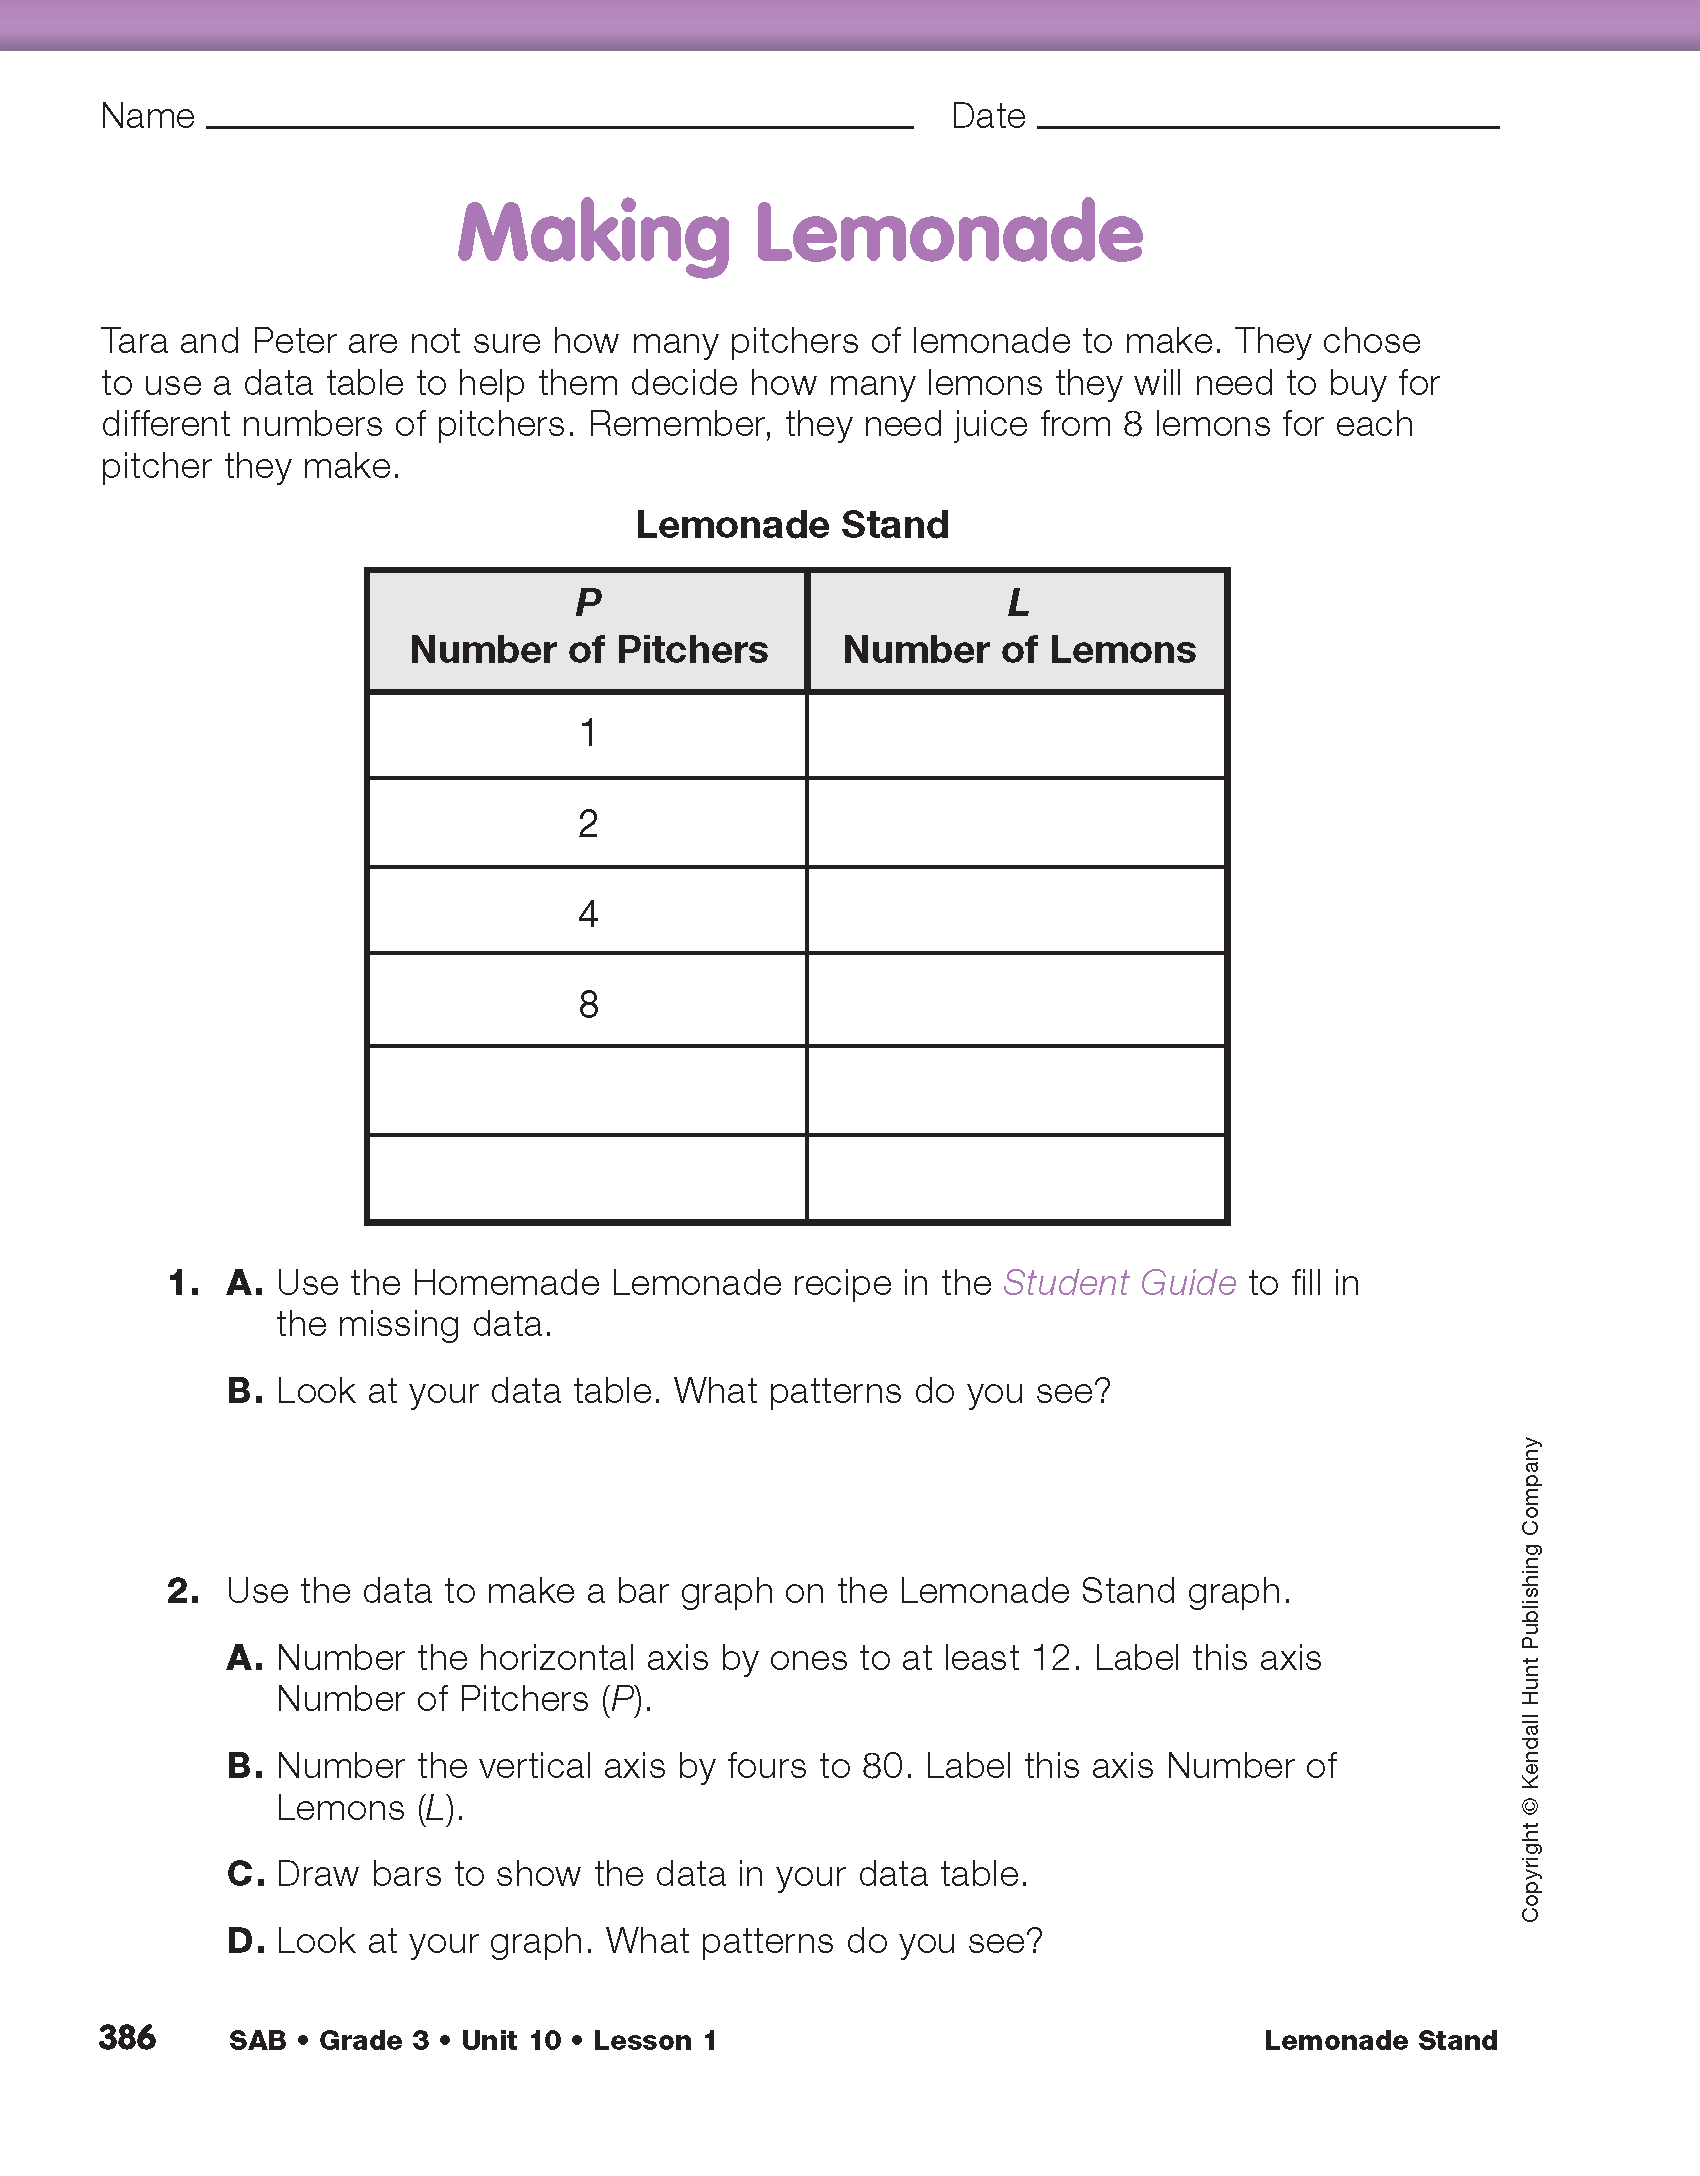
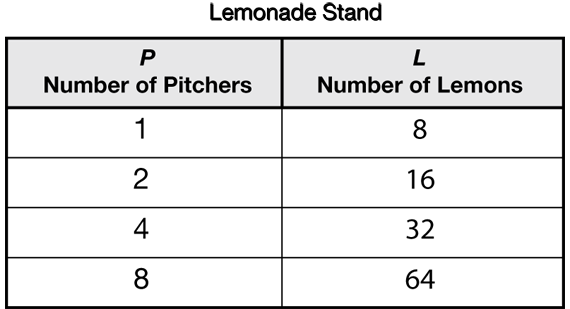
Identify Patterns in a Data Table and Bar Graph. Direct students to the Making Lemonade pages in the Student Activity Book. Begin by reading the short vignette about Tara and Peter's choice to use a data table to find out how many lemons they would need for different numbers of pitchers. After reading the vignette ask students to complete Question 1. They complete the Lemonade Stand data table in Question 1A. A completed table is shown in Figure 1.
In Question 1B, students look for patterns in the data table. These patterns reflect the multiplicative structure of the problem. The discussion of these patterns gives students opportunity to use words that describe multiplication.
To guide the discussion ask:
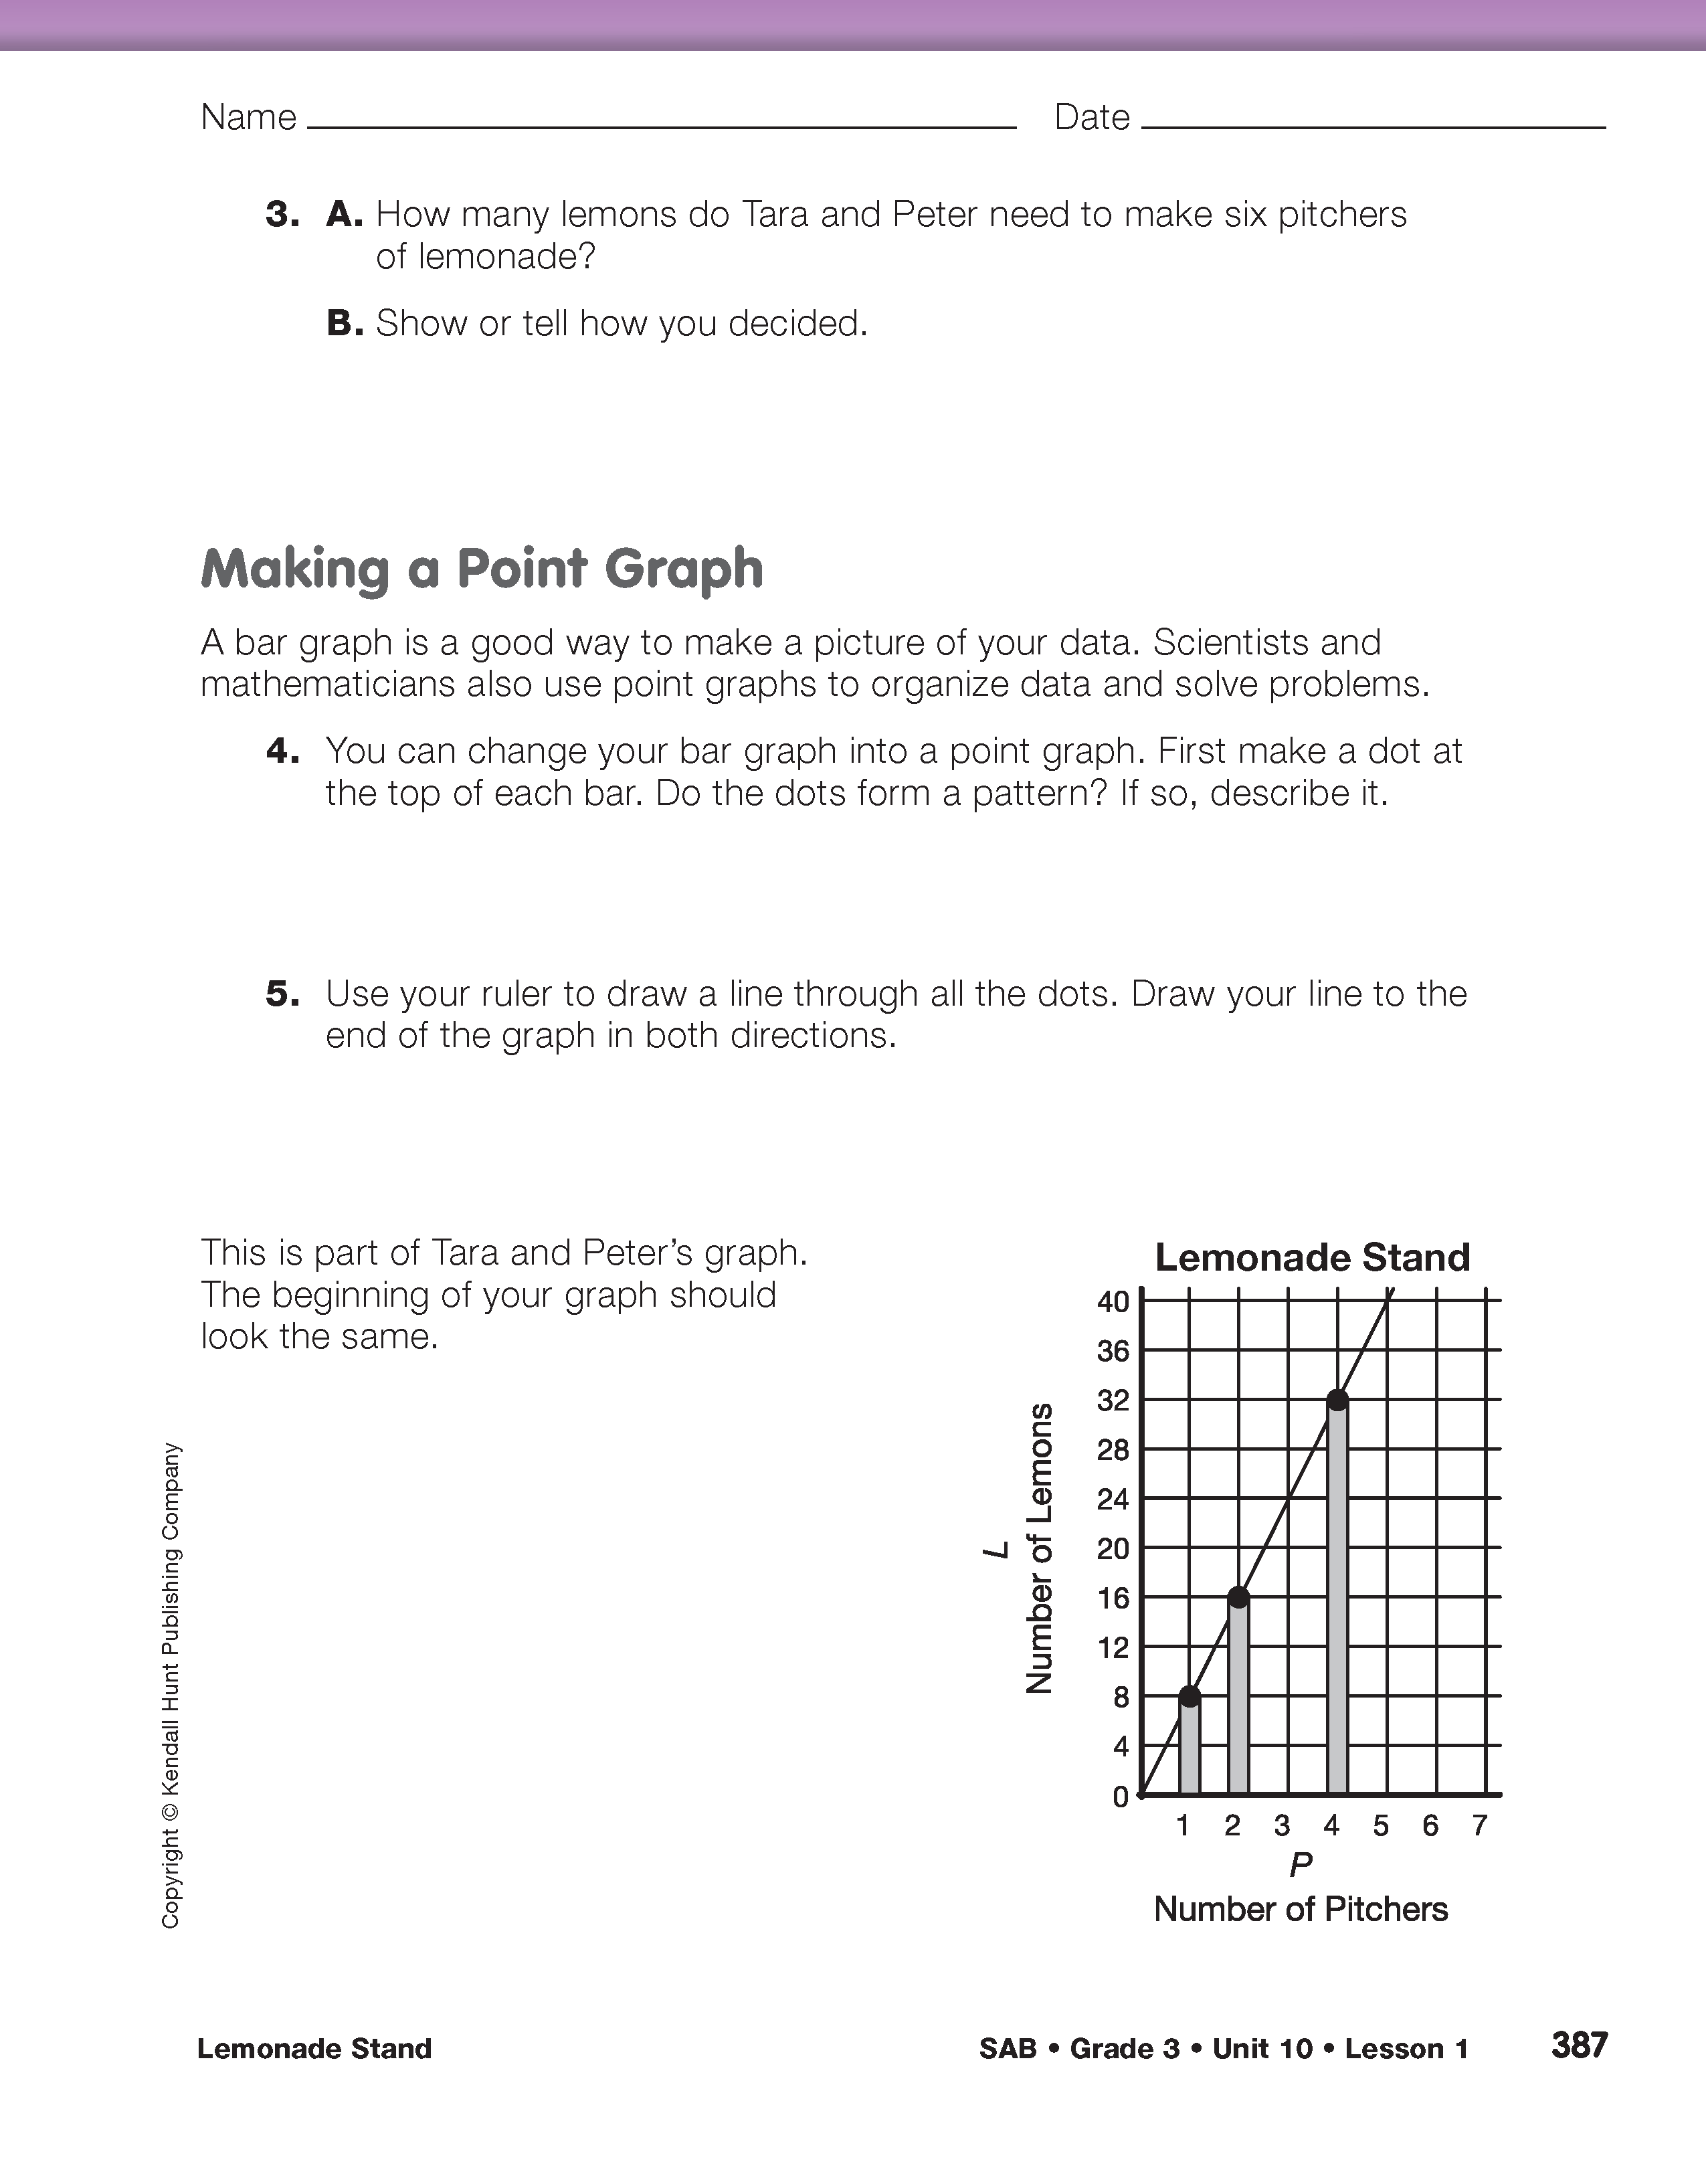
After students have had time to explore the patterns in the data table ask them to complete Questions 2A–D. These patterns can also be represented in a graph. Questions 2A–C guide students through the process of making a graph using the data in the Lemonade Stand data table. Students should use the Lemonade Stand graph that is already started on the last page of this lesson in the Student Activity Book.
Since students will later convert this bar graph to a point graph, it is important to check that their graphs are correctly labeled and scaled, as shown in Figure 2. Use the display of the Lemonade Stand Graph Master to lead a discussion that will help students assess the accuracy of their graphs.
Ask:
When they have completed their graphs, ask:
After discussing the patterns on their graphs, ask students to use their graph or their data table to answer Question 3.
To answer Question 3 students often sketch the bar for six pitchers, making its height midway between the bar for four pitchers and the bar for eight pitchers. They can also add the height of the bar for four pitchers to the height of the bar for two pitchers. Students can also use their data tables to solve this problem by adding the number of lemons needed for two pitchers to the number of lemons needed for four pitchers (16 + 32 = 48 lemons). They can also use repeated addition, adding 8 + 8 + 8 + 8 + 8 + 8 = 48 lemons. Using these or other methods, students should find that Tara and Peter will need 48 lemons for six pitchers of lemonade.