


Exploring Multiplication and Division
MULTIPLICATIVE REASONING

This unit's activities continue the study of multiplication and division. Students encounter … read more
This unit's activities continue the study of multiplication and division. Students encounter many types of multiplication and division problems, discover different strategies for solving problems, and learn to communicate their solutions in many ways.
The concepts developed in this unit serve as a foundation for many important mathematical ideas that students will use in later units and grades. The representations in this unit support students' development of multiplicative reasoning that is not only necessary for successful whole number computation with both multiplication and division, but is a vital component of students' understanding of fractions and development of proportional reasoning. For example, identifying patterns in tables and then looking for the same patterns in a point graph serves students on many levels. See Figure 1. On one level, students are practicing multiplication facts in a real-world context. At the same time, students are developing important pre-algebra concepts about variables, patterns, and graphs that contribute to understanding fractions and proportions.

Figure 1: Using a data table and graph to solve multiplication and division problems
TYPES of MULTIPLICATION and DIVISION PROBLEMS
Researchers have identified different types of multiplication and division problems. While … read more
Researchers have identified different types of multiplication and division problems. While students do not need to be able to identify these different types of problems by name, it is important that they encounter and solve them. Below is a discussion of the different types of problems, all of which are included in our third-grade curriculum.
Problems Involving a Number of Equal Groups
The problems involved in Making Teams (Unit 3 Lesson 4) are good examples. Using the … read more
Problems Involving a Number of Equal Groups
The problems involved in Making Teams (Unit 3 Lesson 4) are good examples. Using the same situation, three different questions emerge. One question is interpreted as a multiplication problem, the other two as division problems.
- The unknown is the total number in all the groups. If there are 5 teams with 4 members on each team, how many players are there in all? There are two known factors and a missing product. Using established knowledge, students often interpret this correctly as a repeated addition problem (4 + 4 + 4 + 4 + 4 = 20). Through classroom experiences with many such problems, they connect the repeated addition sentence to a multiplication sentence (5 × 4 = 20).
- The unknown is the number of groups. Twenty members of a class are divided into teams of 4 members each. How many teams in all the groups and the measure or size of each group. This aspect of division is called measurement division.
- The unknown is the number in each group. Twenty members of a class are divided equally into 5 teams. How many students are on each team? The problem gives the total number of students and the number of groups or partitions. This aspect of division is known as partitive division.
Jumps on a number line and arrays provide additional experiences with multiplication and division with equal groups. Successive jumps of equal size on a number line were introduced in Unit 8 using a subspecies of math hoppers called constant hoppers. They provide a model for multiplication as repeated addition. An array, which is introduced in Unit 8, is a collection of objects arranged in rows of equal size.
Problems Involving Scale Factors
This type of problem is often found in TIMS laboratory experiments. For example, after … read more
Problems Involving Scale Factors
This type of problem is often found in TIMS laboratory experiments. For example, after students have rolled three different cars down a ramp, they might be asked whether one car rolled three times as far as another. Similarly, when finding the mass of objects, they may be asked whether the mass of one object is one-half the mass of another object.
A Cartesian Product
This type of problem asks for the number of possible pairs that can be made from two sets. … read more
A Cartesian Product
This type of problem asks for the number of possible pairs that can be made from two sets. For example, if one is a set of two shirts and the other is a set of three pants, the problem is to find all six possible shirt-pant pairs. Young children are able to solve this type of problem using manipulatives and diagrams. This type of problem is practiced in the Daily Practice and Problems thoughout the year.
It is not important for students to identify the problem types by name. However, experiences with many types of problems will provide a strong conceptual foundation not only for multiplication and division, but also for fractions, ratios, and proportional reasoning as well.
NOTES on GRAPHING
The graphing techniques in this unit are an integral part of Math Trailblazers®. … read more
The graphing techniques in this unit are an integral part of Math Trailblazers®. They are powerful tools for studying many of the big ideas students will encounter in their study of mathematics, especially algebraic concepts. In this unit students learn to represent data using point graphs as well as bar graphs. In the lessons Lemonade Stand, Mr. Green's Giant Gumball Jamboree, and Walking around Shapes, students use point graphs to investigate multiplication and division.
In subsequent units, students will choose which kind of graph is the most appropriate to use in a given situation. Since a graph is a visual representation of the relationship between variables, the appropriateness of the graph depends on the type of variables in the experiment. Up to this point, students have used bar graphs to represent data and study the relationships between variables. For example, Figure 2 shows the graph from Which Picks Up More? in Unit 5. The horizontal axis is labeled with the various types of paper towels. The variable type of towels is discrete; that is, there are no values between Brand 1, Brand 2, and Brand 3. Thus, it does not make much sense to connect the data points with a line. A bar graph is the appropriate type of graph for representing this data.
However, in Lemonade Stand the variable number of pitchers is continuous; that is, the values between the data points are meaningful. For example, it makes sense to talk about 3 or 71/2 pitchers, instead of just 1, 2, 4, and 8 pitchers. In this case, drawing a line between data points is meaningful. Drawing a line between them helps show a relationship between number of pitchers and number of lemons that can be used to predict the values of the in-between points.
Lemonade Stand is students' first exposure to point graphs. To simplify students' initial attempts at graphing, they graph the data on a bar graph first and then convert the bar graph to a point graph. Students find that the points fall on a straight line and use a ruler to draw the line passing through them, as shown in Figure 2. Later, this line becomes the basis for making predictions about values that lie between and beyond the data points. Making predictions about values that fall between data points is called interpolation. Making predictions about values that lie beyond data points is called extrapolation.
Although point graphs are often used when both variables are quantitative, that is not always the case. The two variables in the experiment First Names in Unit 1 are number of letters and number of students. While both of these variables are quantitative, they are also discrete—it is not meaningful to speak of 61/2 letters in a name or 61/2 people who have that number of letters in their names. Thus, a line on a point graph, in which values between data points are represented, would not be appropriate. The data in First Names, therefore, is best represented on a bar graph. See Figure 3.

Figure 2: A bar graph for qualitative variables and a point graph for quantitative, nondiscrete variables
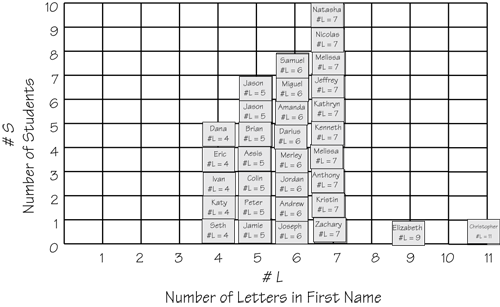
Figure 3: A bar graph for quantitative, discrete variables
ALGEBRA in the EARLY GRADES
We believe that from the earliest grades of elementary school, students can be acquiring … read more
We believe that from the earliest grades of elementary school, students can be acquiring the rudiments of algebra, particularly its representational aspects and the notion of variable and function. By emphasizing both the relationships among quantities and ways of representing these relationships, instruction can introduce students to the basic ideas of algebra as a generalization of arithmetic (National Research Council, 2001).
James Kaput (2008), an expert in algebra, suggests there are three strands of algebraic reasoning:
Strand 1. Study of generalized arithmetic and quantitative reasoning
Strand 2. Study of patterns, relations, and functions
Strand 3. Process of mathematical modeling
The Buying Giant Gumballs activity in Lesson 5 embodies these strands of algebra and is an exemplar of the kinds of experiences recommended by the National Research Council. In this activity and in other activities in this unit students use the models of graphs and tables to represent and use the relationships between the variables in the problem. Students also invent strategies to reason about the variables. This reasoning then leads to the development of more formal algorithms or generalized arithmetic.
MATH FACTS and MENTAL MATH
Multiplication Facts
This unit continues the review and assessment of the multiplication facts to develop mental math… read more
Multiplication Facts
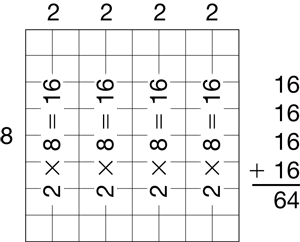
This unit continues a systematic review and assessment of the student's fluency with the multiplication facts. In this unit students will have opportunities to gain fluency with the multiplication facts for the square numbers. Students should be encouraged to reason from facts they know and to break the facts into factors they know. For example, to solve 8 × 8, use 2 × 8 = 16 and 16 + 16 + 16 + 16 = 64, so 8 × 8 = 64.
Resources
- Anghileri, J., and D.C. Johnson. “Arithmetic Operations on Whole Numbers: Multiplication and Division.” In Teaching Mathematics in Grades K–8: Research-Based Methods, T.R. Post, ed., pp. 146–189. Allyn and Bacon, Needham Heights, MA, 1992.
- Burns, M. “Introducing Division through Problem-Solving Experiences.” The Arithmetic Teacher: Mathematics Education through the Middle Grades, 38 (8), pp. 14–18, April 1991.
- Carpenter, T.P., E. Fennema, M.L. Franke, L. Levi, and S.B. Empson. Children's Mathematics: Cognitively Guided Instruction. Heinemann, Westport, CT, 1999.
- Carraher, D.W., and A.D. Schliemann. “Early Algebra.” F.K. Lester, Jr., ed. Second Handbook of Research on Mathematics Teaching and Learning. Information Age Publishing, Inc., Charlotte, NC, 2007.
- Kaput, J.J. Algebra in the Early Grades. Lawrence Erlbaum Associates, New York, NY, 2008.
- National Research Council. “Conclusions and Recommendations.” In Adding It Up: Helping Children Learn Mathematics. J. Kilpatrick, J. Swafford, and B. Findell, eds. National Academy Press, Washington, DC, 2001.
- Page, D.A. Maneuvers on Number Lines. Education Development Center, Newton, MA, 1976.
- Rothmell, E. C., and P.R. Trafton. “Whole Number Computation.” In Mathematics for the Young Child. National Council of Teachers of Mathematics, Reston, VA, 1990.
- Schliemann, A.D., D.W. Carraher, and B.M. Brizuela. “From Quantities to Ratio, Functions, and Algebraic Notation.” In Bringing Out the Algebraic Character of Arithmetic: From Children's Ideas to Classroom Practice. Lawrence Erlbaum Associates, Inc., Mahwah, NJ, 2007.