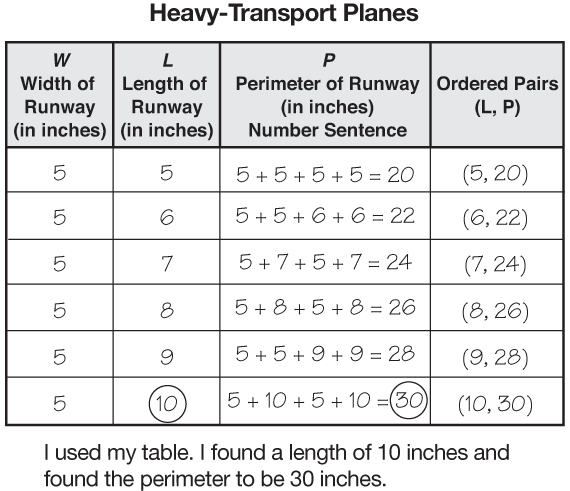
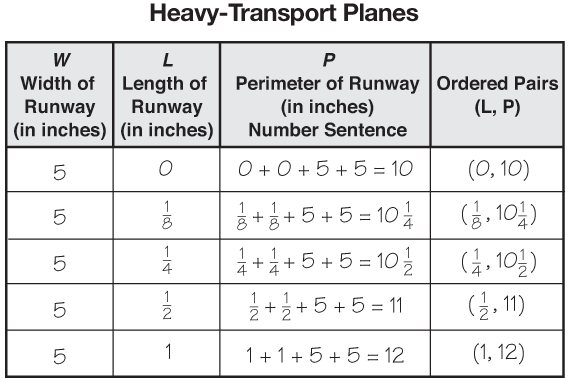
Data Patterns. Ask students to compare the patterns described in the data table for the Light Plane Runways to the data table they created.
- What is the same about the class data table for the light plane and your data? (Possible response: the perimeter goes up by two as the length goes up by one.)
- What is different? (Possible responses: the runway width; the perimeters are larger for the larger planes; the runways are longer.)
Making Predictions. Questions 9–11 in the Explore section of the Student Guide can be solved using the graph, the data table, or from models of the runways in question. Remind students that all these methods are valid and that all should yield the same answer for the same type of plane.
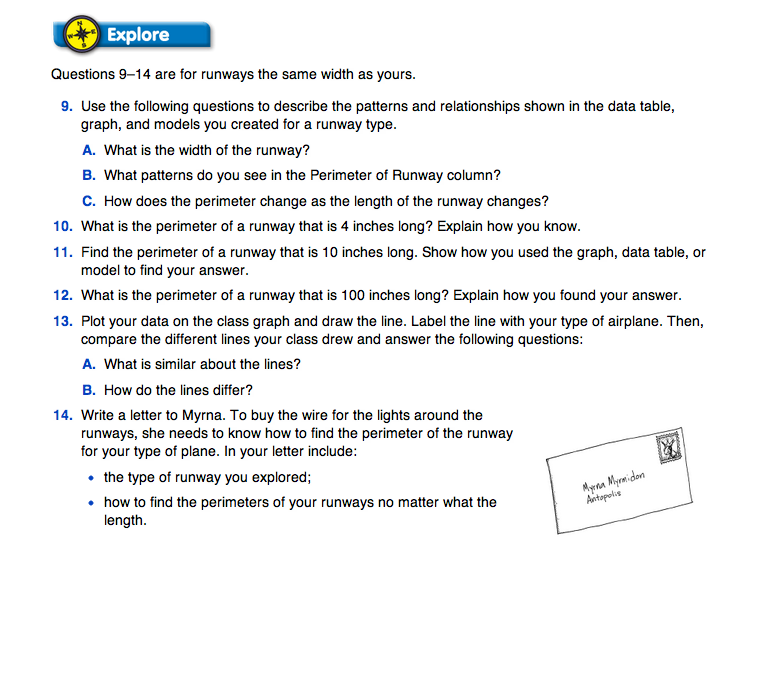
Question 9 asks students to describe the patterns and relationships in the data table for the runway they investigated. Encourage students to show those patterns in the data table and then connect those relationships to the graph and models of the runways.
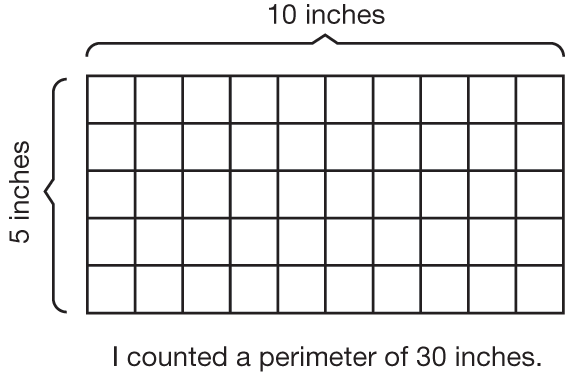
Questions 10 and 11 provide an opportunity to discuss how to show work when students use graphs or tables to solve the problem. Refer to Math Practices Expectations 2 and 5 on a display of the Math Practices page. Discuss a variety of strategies to find the perimeter of a runway that is 4 or 10 inches long. Ask students to demonstrate how to use a graph, a data table, and a model. See sample student responses in Figures 5, 6, and 7 for Question 11, and illustrate ways students can show how they arrived at their answer.
Ask students to use Math Practices Expectations 2 and 5 and what they have learned from the discus- sion to revise their responses to Question 11.
Generalize from Data. In Question 12, students will have to use the patterns they discussed to make a prediction outside of the data set. Encourage students to use and explain different strategies.
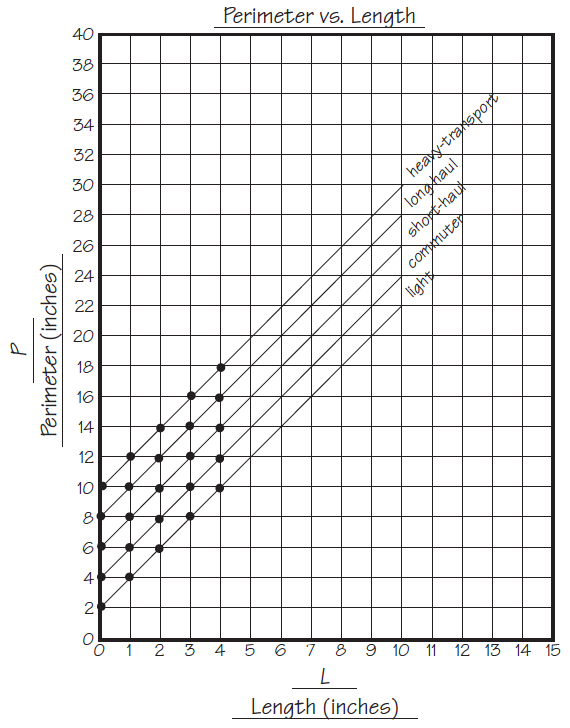
To make the class graph for Question 13, graph the lines using different colors on Centimeter Graph Paper, using poster-size graph paper, or a class display. See Figure 8 for a sample class graph.
Ask students to compare the lines:
- Describe the graphs. What do you notice about them? (Possible responses: all the lines go up by the same amount; they are parallel.)
- Why do the all lines slope uphill? What does that say about the relationship between the length of the runways and the perimeter? (The longer the runway for any plane, the larger the perimeter.)
- What is different about them? (They all cross the vertical axis in a different place; one is above another.)
- Where does the line for the light plane cross the vertical axis? For the commuter plane? For the short-haul jet? For the long-haul jet? For the heavy-transport plane? (P = 2 in., P = 4 in., P = 6 in., P = 8 in., P = 10 in.)
- What patterns do you see in these points? (Possible response: The points are the even numbers.)
- Do you see any other patterns?
- What do you notice about the width of the runway for each type of plane and the point where the line for that plane crosses the vertical axis? Think: What is the width for the light plane runway and where does the line cross the vertical axis? What is the width of the commuter plane runway and where does it cross the vertical axis? (The line for each plane's runway crosses the vertical axis at twice the width of the runway.)
- Which line is above all the others? (heavy-transport)
- Which line is below all the others? (light plane)
- Why is the line for commuter plane runways below the line for short-haul jets? (The width of the commuter plane runways is less than the width of the short-haul jet runways.)
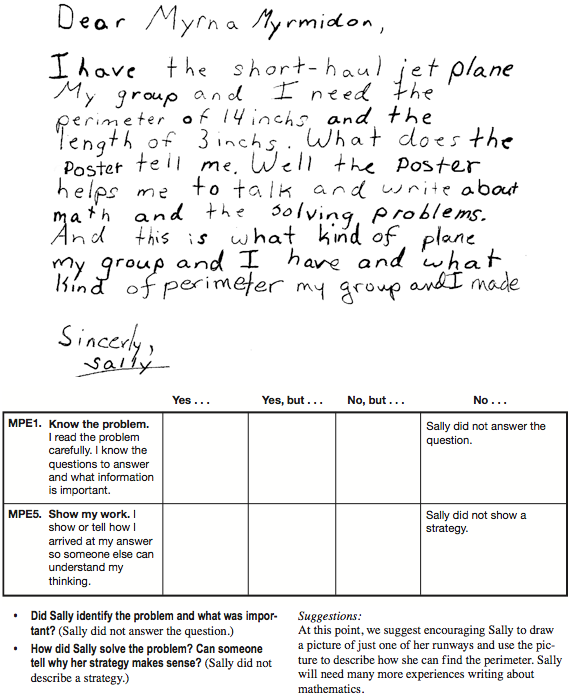
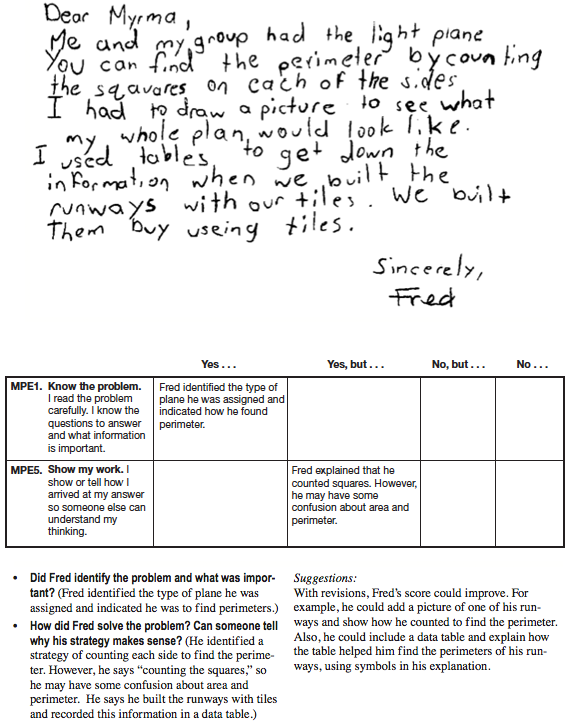
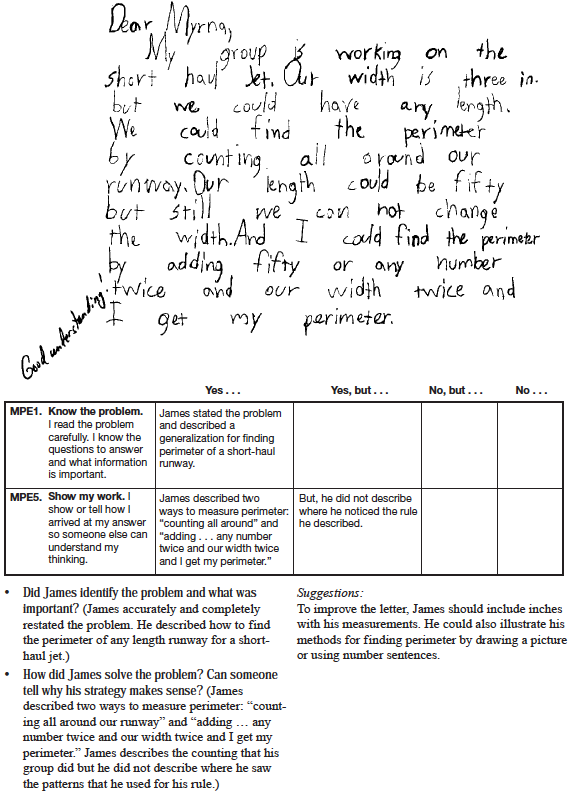
Communicate Mathematically. In Question 14, students are asked to write a letter to Myrna explaining how to find the perimeter of their runway no matter how long the runway. Encourage students to respond with a generalization, not just an example. Some students may realize two lengths and two widths build the perimeter. Others will discover that the length plus width is halfway around the perimeter. Some students may be able to express the relationship in symbols while others may use words or pictures.
Use a few samples of student work and Math Practices Expectations 1 and 5 to discuss and set expectations for what should be in Myrna's letter. Figures 10, 11, and 12 show three samples of student work reviewed with discussion questions and a completed corresponding Feedback Box. Record students' feedback on a display of the Math Practices 1 and 5 Feedback Box Master.

Use the following for students who may be ready for a challenge. When students compare the graphs in Question 13, ask:
- When the length of the runway for the light plane is close to 0 inch, why is the perimeter close to 2 inches?
- If the length of the runway were 0, an ant would not have to walk along the two lengths. How far would the ant travel to walk just two widths?
- Why does the line for heavy-transport runways go to (0,10)?
These questions address what happens when the length of a runway gets close to zero. You might think the perimeter goes to zero as well, but this does not happen. Students can follow patterns in the data table or graph to think about the question. If the length of a runway is one-half inch and the width is 5 inches, then the perimeter is 1/2 + 1/2 + 5 + 5 = 11 inches. If the length shrinks to one-fourth inch, then the perimeter is 10 1/2 inches. See Figure 9. If the length is one eighth inch, then the perimeter is 10 1/4 inches. Notice that when following the same pattern, as the length gets closer to zero, the perimeter gets closer and closer to 10 inches. As the length approaches zero, the perimeter gets closer to twice the width, not to zero. Note that this reasoning works mathematically. What happens when the length actually is zero (and there is no runway at all) is a question we leave to the philosophers.
As shown by these three letters, you can expect a wide range of abilities in your classroom. If your students have not had much experience writing about mathematics, use this lesson as an introduction. If your students have written about mathematics in previous grades, use this lesson as a review. In either case, this lesson serves to document students' current problem-solving and communication skills. Students will have many opportunities to improve their communication skills throughout the coming months.

The question in the Meeting Individual Needs box is an interesting and challenging problem for students to discuss. A rectangle cannot have a side length of 0. If the width were 5 inches, and the length were 0, then the “rectangle” would devolve into a line segment and cease to be a two-dimensional shape. However, mathematicians have found ways to think about what happens as the length gets very close to 0. In this case, by following the pattern in the data table in Figure 9, the perimeter gets very close to 10 inches. On a graph, this can be shown by putting an open circle on the point (0, 10).

Use the Perimeter vs. Length Lab Feedback Box Master to provide feedback on the corresponding lab with the following expectations:
- E1.
- Make a point graph.
- E2.
- Read a table or graph to find information about a data set.
- E4.
- Recognize and generalize geometric relationships in problems involving the area and perimeter of rectangles.
- E6.
- Find the perimeter of rectangles and irregular shapes by counting units and adding.
Use student responses to Question 14 to assess how well students know what is important in the problem [MPE1] and show their thinking [MPE5].
The Lesson 3 Workshop provides targeted practice with finding area and perimeter [E6] and recognizing and generalizing geometric relationships [E4].


