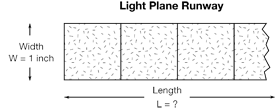
Students apply the TIMS Laboratory Method to analyze the relationship between side length and perimeter for rectangles. They generalize these ideas and communicate how to find perimeters of rectangles using pictures, symbols, or words. The context for the lesson is the design of an airport for Antopolis.
Content in this Lesson
- Finding the perimeter of rectangles and irregular shapes by counting units and adding [E6].
- Representing the variables and procedures of an investigation in a drawing.
- Making a point graph [E1].
- Drawing a best-fit line.
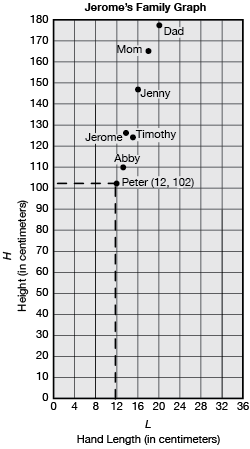
- Reading a table or point graph to find information about a data set [E2].
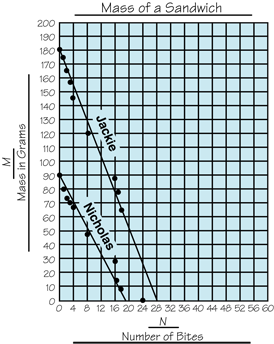
- Describing and comparing more than one data set represented on one graph.
- Modeling real-world situations with tables and point graphs.
- Translating between graphs, tables, and real-world situations [E3].
- Recognizing and generalizing geometric relationships of side length and the perimeter of a rectangle [E4].
- Finding the area of rectangles and irregular shapes by counting [E7].
- Making shapes (polygons) with given measurements (width, perimeter, or area) [E5].
- Knowing and understanding the important information in a problem [MPE1].
- Choosing strategies for solving problems involving data represented in graphs, tables, and with models [MPE2].
- Showing a solution for a problem involving representations of data [MPE5].
- Demonstrating fluency with the subtraction facts using the counting-up strategy [E8].
Assessment in this Lesson
| Assessment | Expectation Assessed | Math Practices Expectation Assessed |
|---|---|---|
|
Perimeter vs. Length Lab Student Guide Pages 54–58 with corresponding Feedback Box Teacher Guide - digital |
|
|
|
Perimeter vs. Length Lab Homework section Check-In: Questions 5–11 Student Guide Page 60 |
|
|
|
DPP Item J Area and Perimeter Teacher Guide - digital |
|
|
|
Home Practice Part 3 Teacher Guide - digital |
|
|
|
DPP Item E Subtraction Facts Quiz: Count-Ups Teacher Guide - digital |
|


