


Weather 1: Eye on the Sky
Est. Class Sessions: 1Developing the Lesson
Part 1: Collecting Weather Data
Describe the Sky. There are many weather variables that can be studied. Focusing on a single aspect of weather makes data collection and analysis more manageable for students. Engage students in a discussion about the different ways the sky may appear.
Ask:
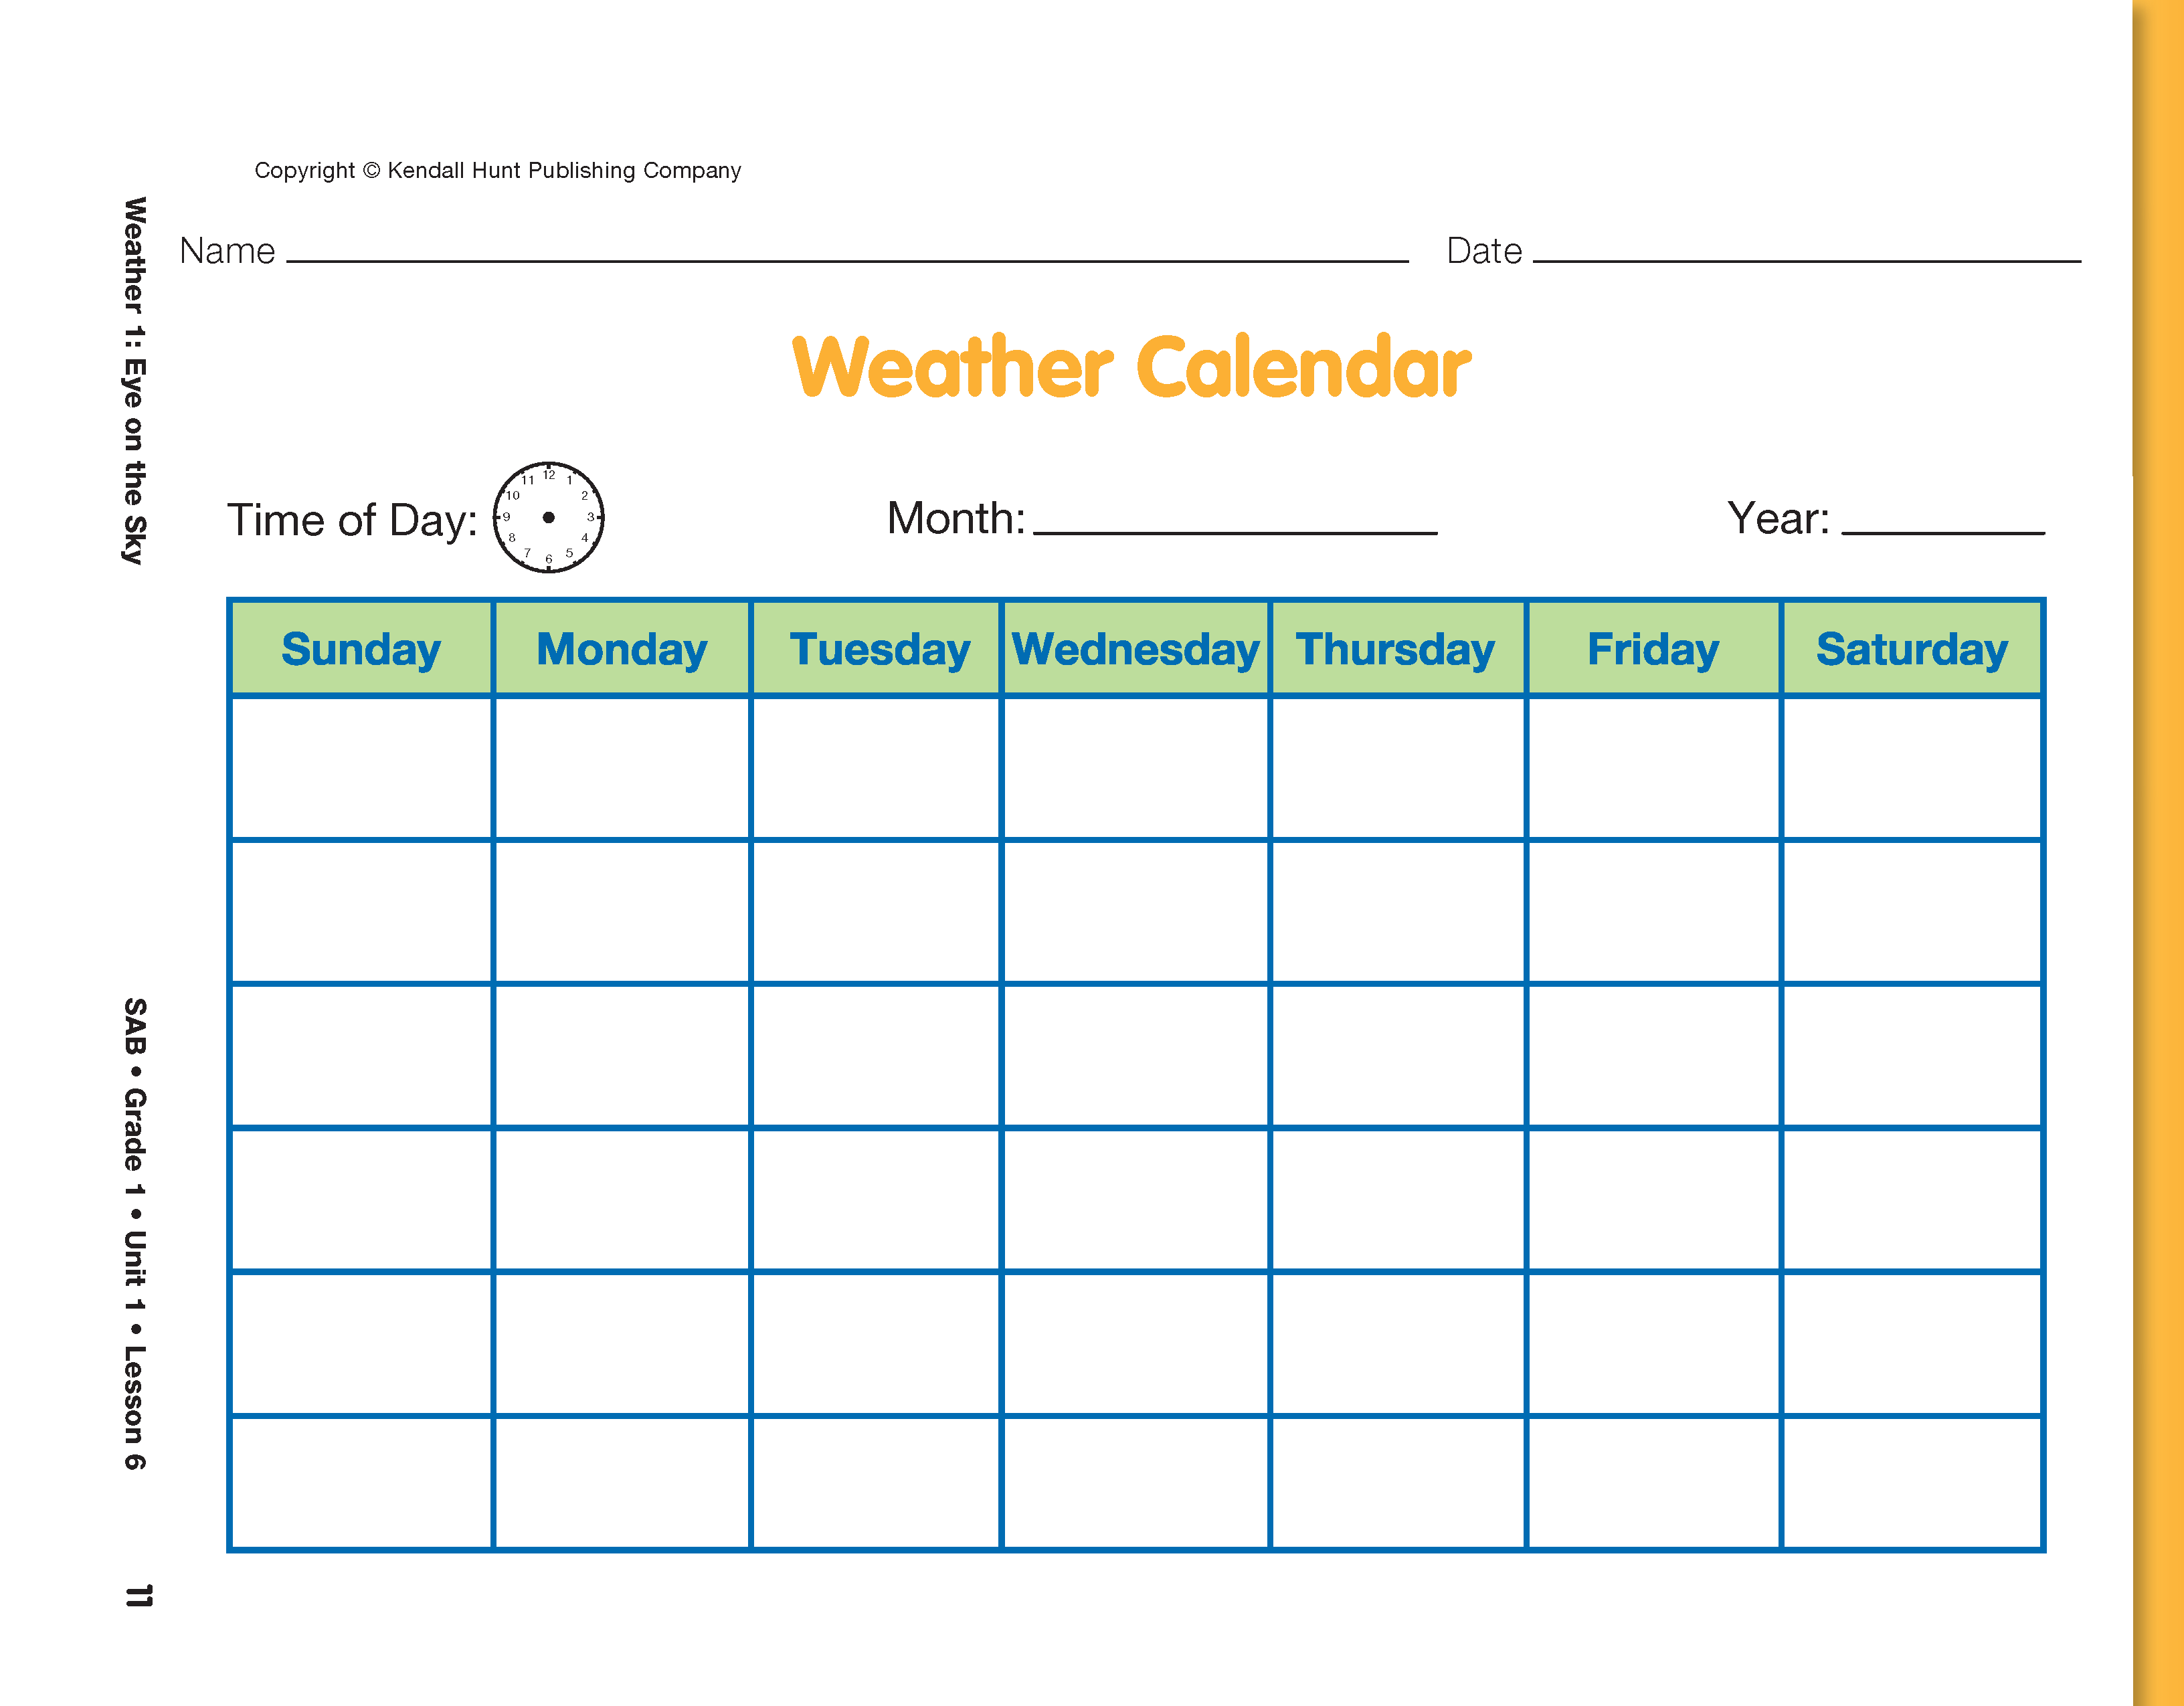
Prepare the Calendar. Display and direct students' attention to the Weather Calendar page. Students will record the data for each day of the month on this page. Using the display, demonstrate how to prepare the calendar. As students respond, write their answers on the display calendar as they label their own.
Ask:

Demonstrate how to write the numerals 1 and 2 in the correct boxes on the calendar for the first and second days of the month. Beginning on the first day of the month, point to each box on the calendar as you and the class count aloud to 30 or 31. Make sure students see that after Saturday, the numbering continues on the next row down.
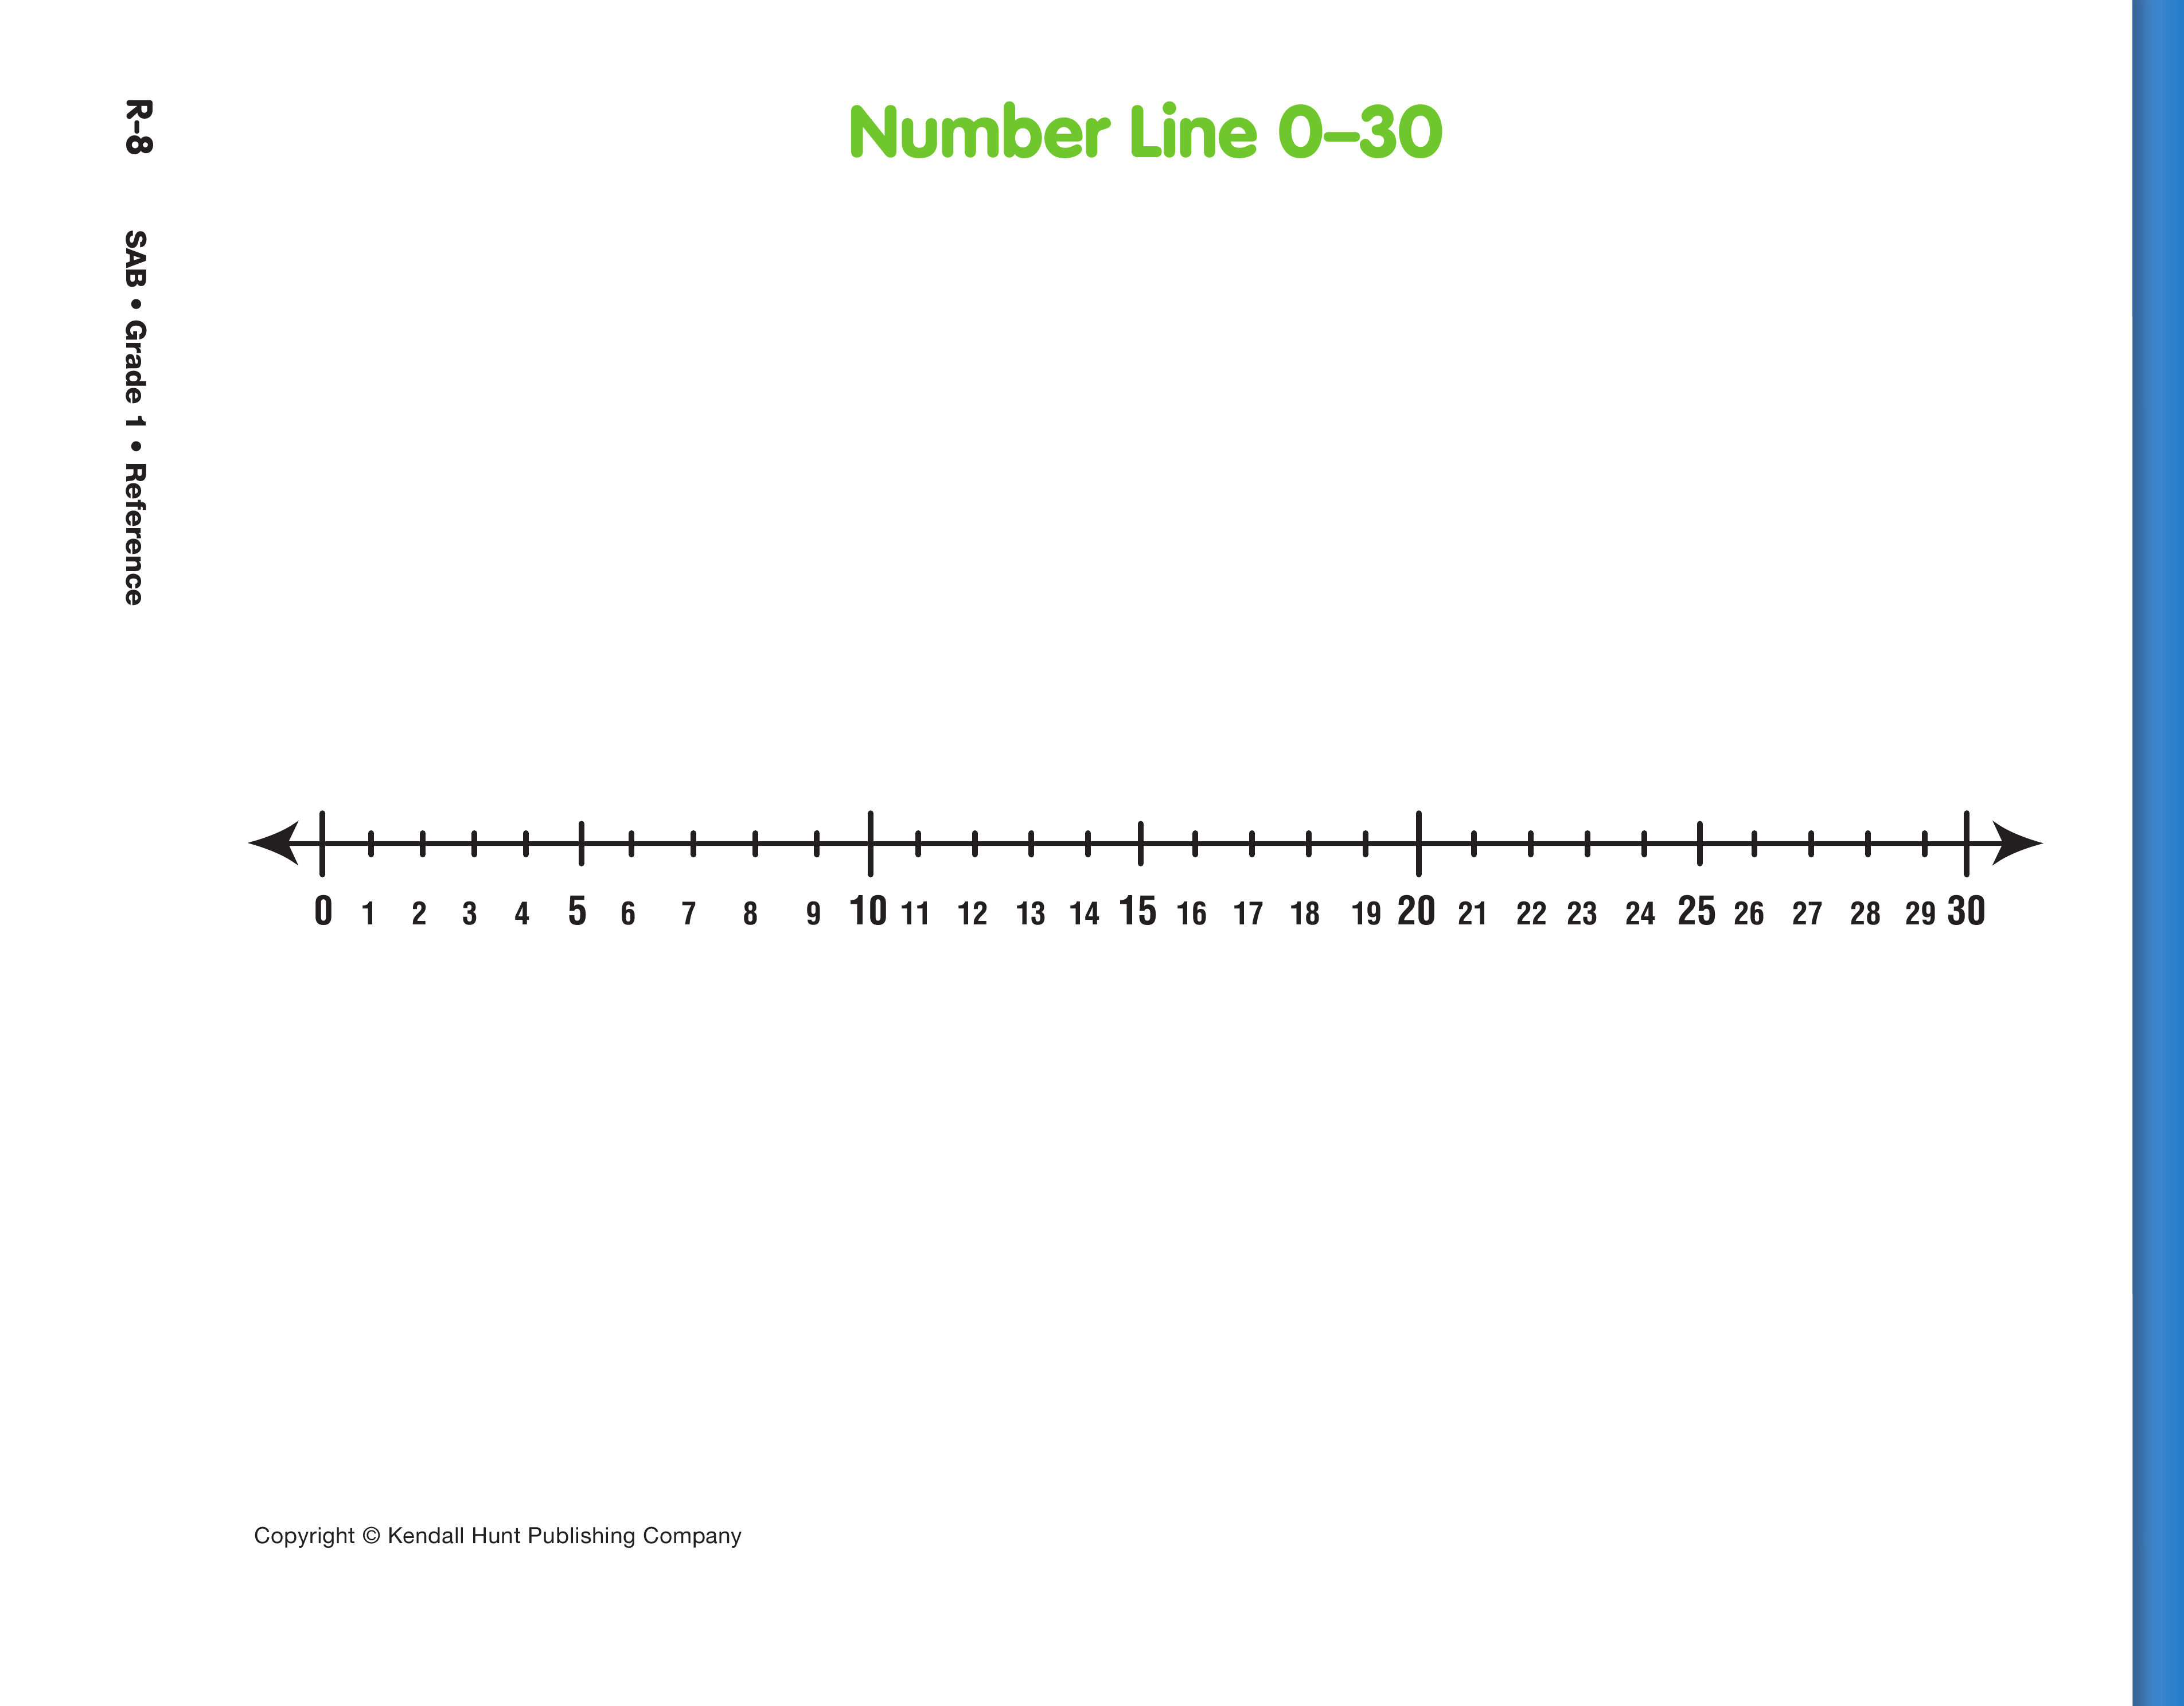
After reciting the numbers aloud, ask students to write the
remaining numbers for the dates in the boxes on their calendars.
They may refer to the Number Line 0–30 page in the
Student Activity Book Reference section for examples of the
numbers
0–30.

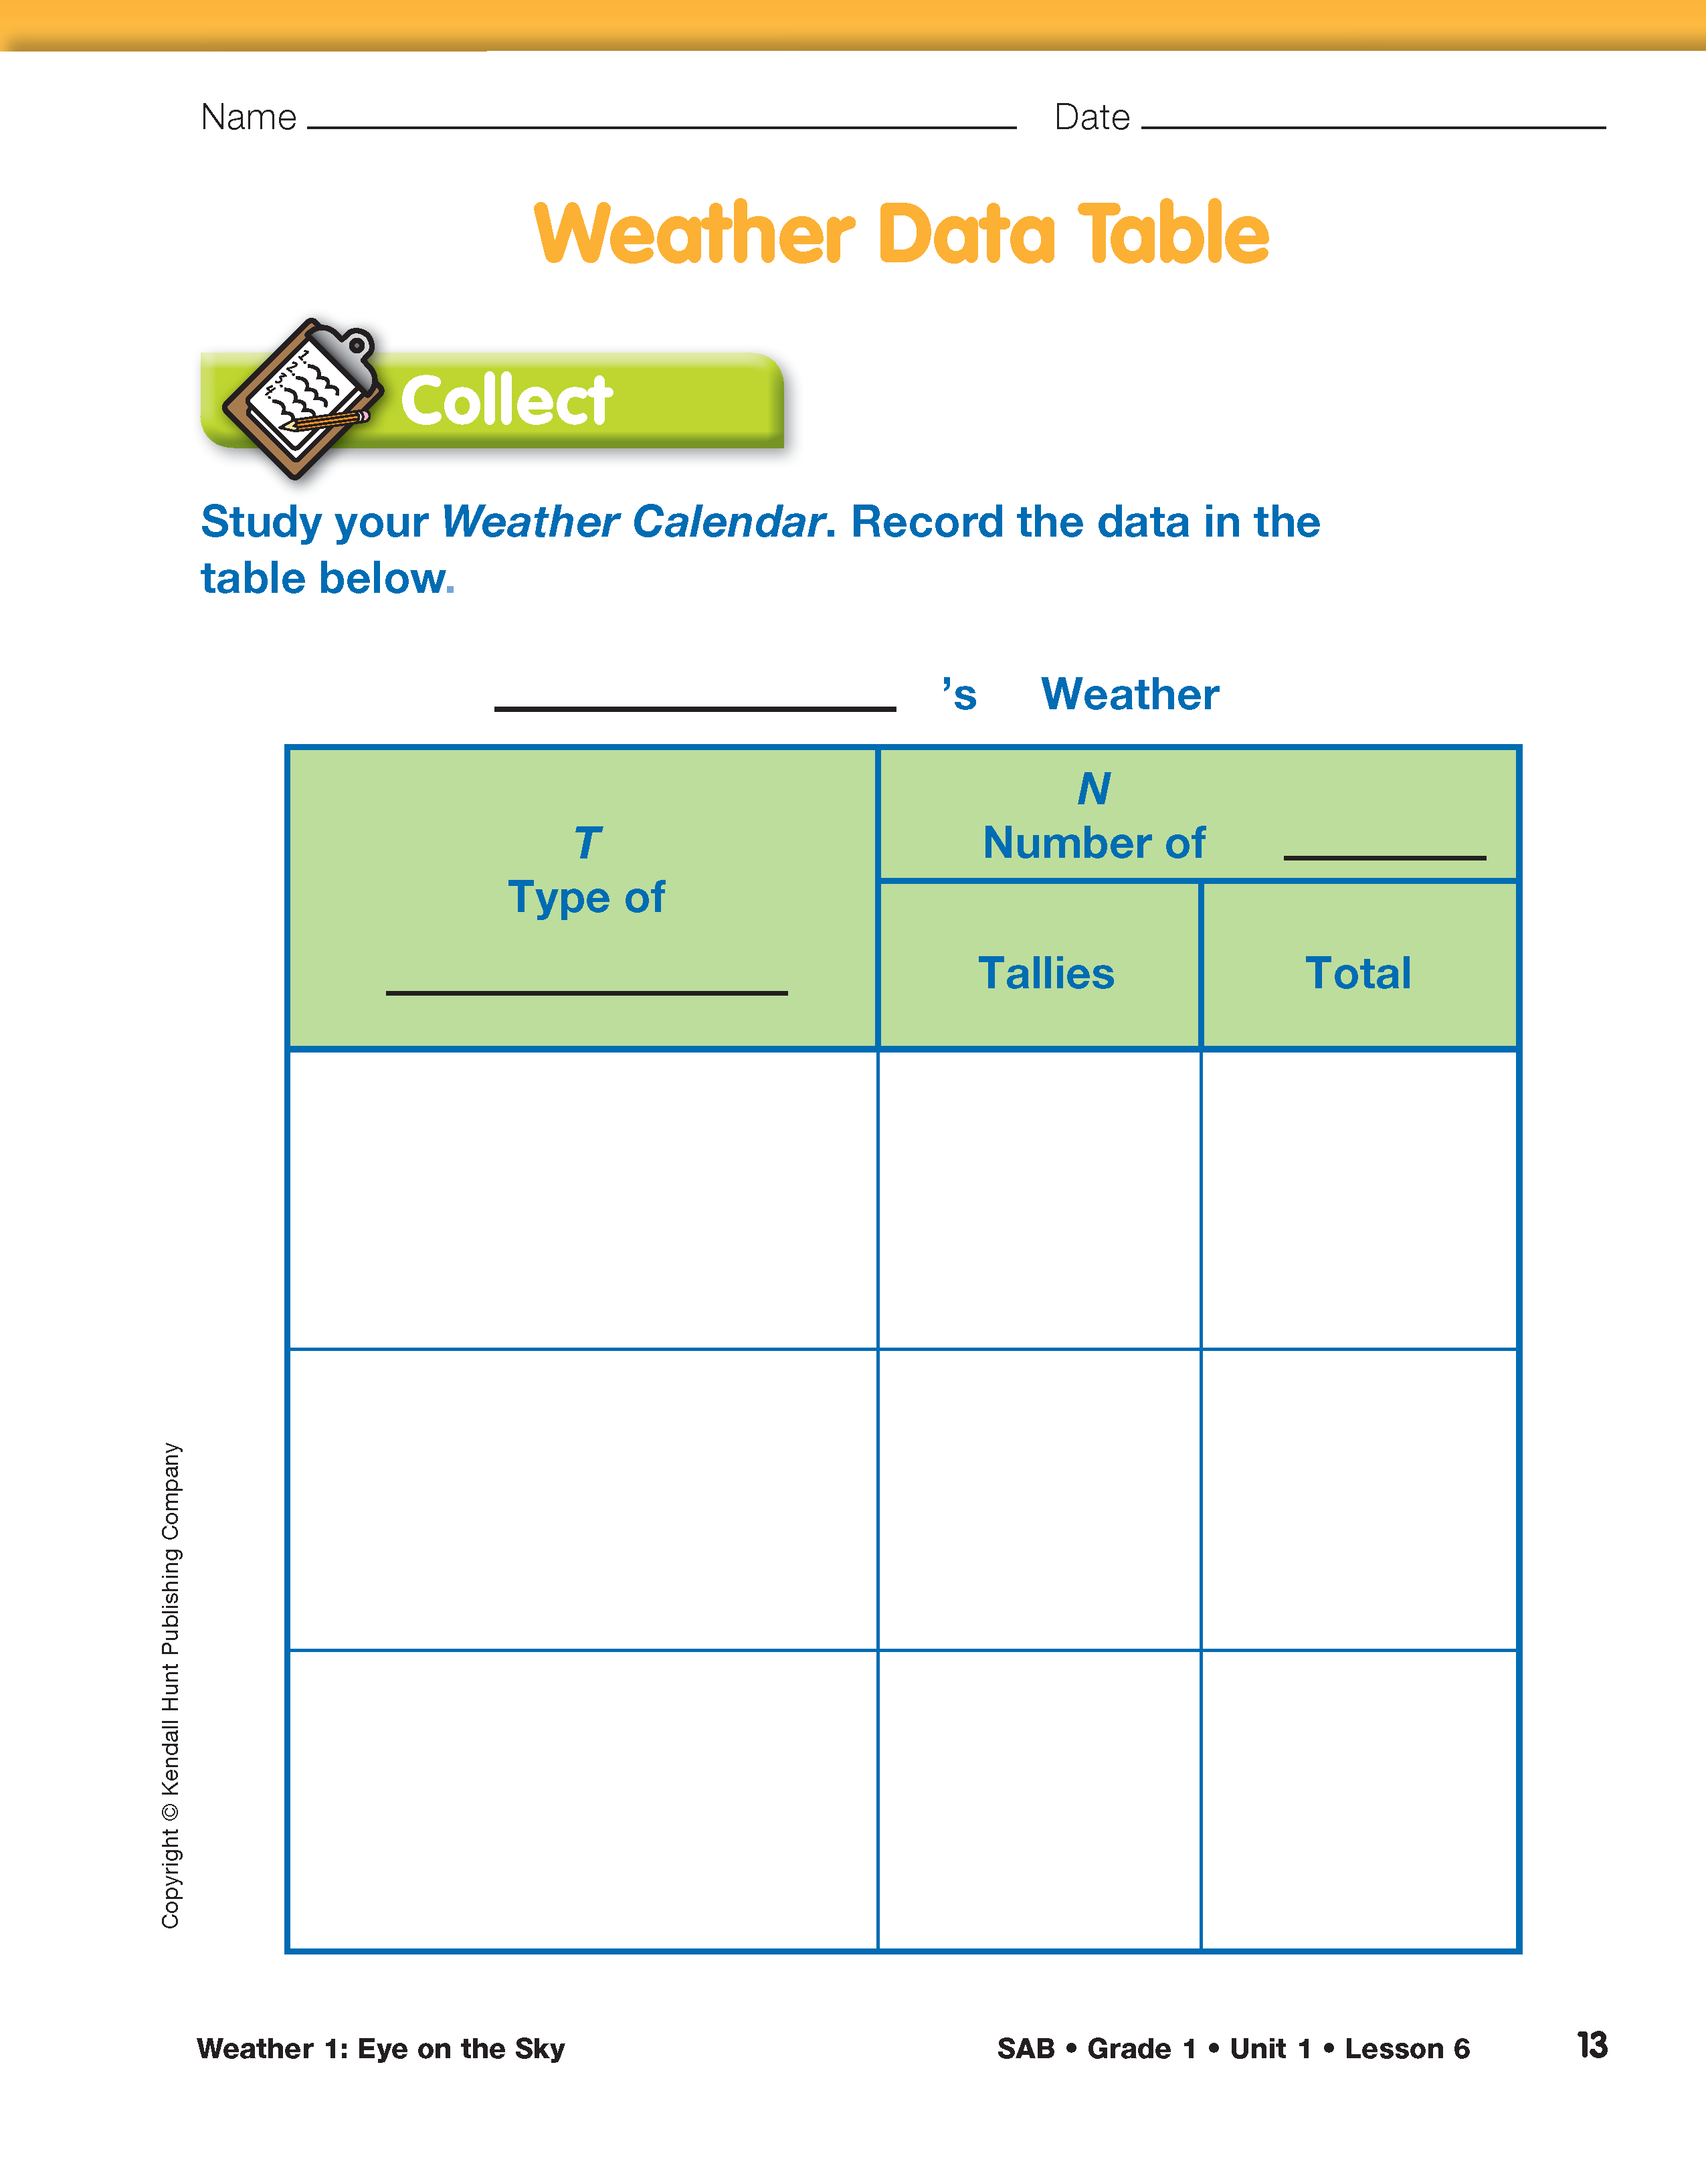
Prepare the Data Table. Display the Weather Data Table page. Students begin their data tables on the first day of data collection. Using the display, explain to students that the data table will help them organize their data. Demonstrate how to title the table, "[Month Name]'s Weather" and how to label the columns as students label their own. Write "Sky" on the blank in the heading for the first column and "Days" on the blank in the second column of the table. Ask students to draw symbols in the column headed "Type of Sky" for sunny, partly cloudy, and cloudy as shown in Figure 1.
Introduce the Variables. Tell students that some things change in an experiment (variables)and some things do not (fixed variables). See Content Note.
Ask:

Display the Weather Calendar page again and point out the small blank clock on the page. Students will collect data at approximately the same time each day.
Ask:
The class should decide on an appropriate time of day to make their weather observations. This is the fixed variable in the investigation. Demonstrate how to record the daily observation time on the blank clock as students draw the hands of the clock on their own pages.
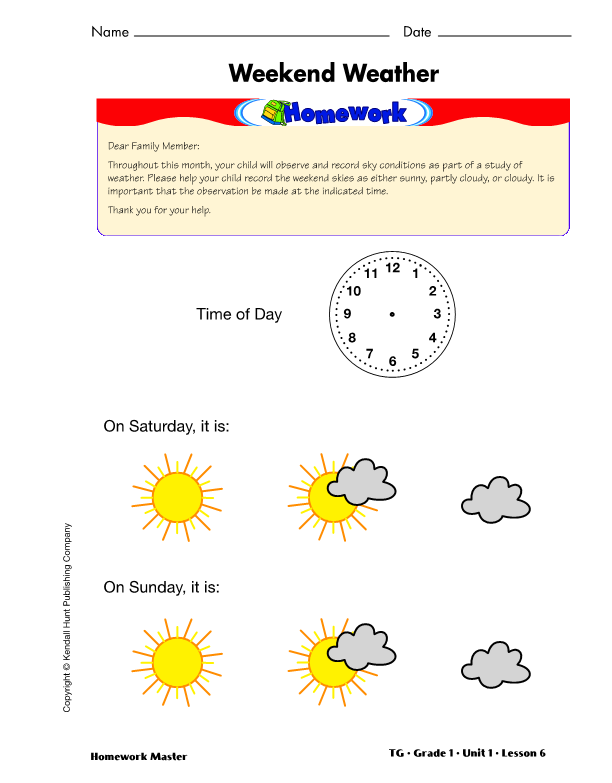
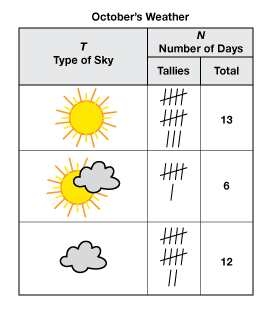
Conduct the Experiment. Each day, remind students to check the weather and agree on the type of sky. Students should record the type of sky on the appropriate day on the calendar using symbols. They should also place one tally mark in the corresponding row of the data table. Remind students that in the tally system, four strokes are crossed by a fifth to group the marks. These tally marks provide excellent practice for counting by fives. Figure 2 shows a completed sample data table. The Weekend Weather Homework Master can be assigned on Fridays and data can be shared on Mondays.