


Weather 1: Eye on the Sky
Est. Class Sessions: 1Developing the Lesson
Part 2: Graphing and Analyzing the Data at the End of the Month
Make a Bar Graph. At the end of the month, begin the process of graphing and analyzing the data. Have students count the tallies and complete the column labeled "Total" on their data tables. Ask students to look at their data tables and to share some of the things they learned from the data.
Ask:
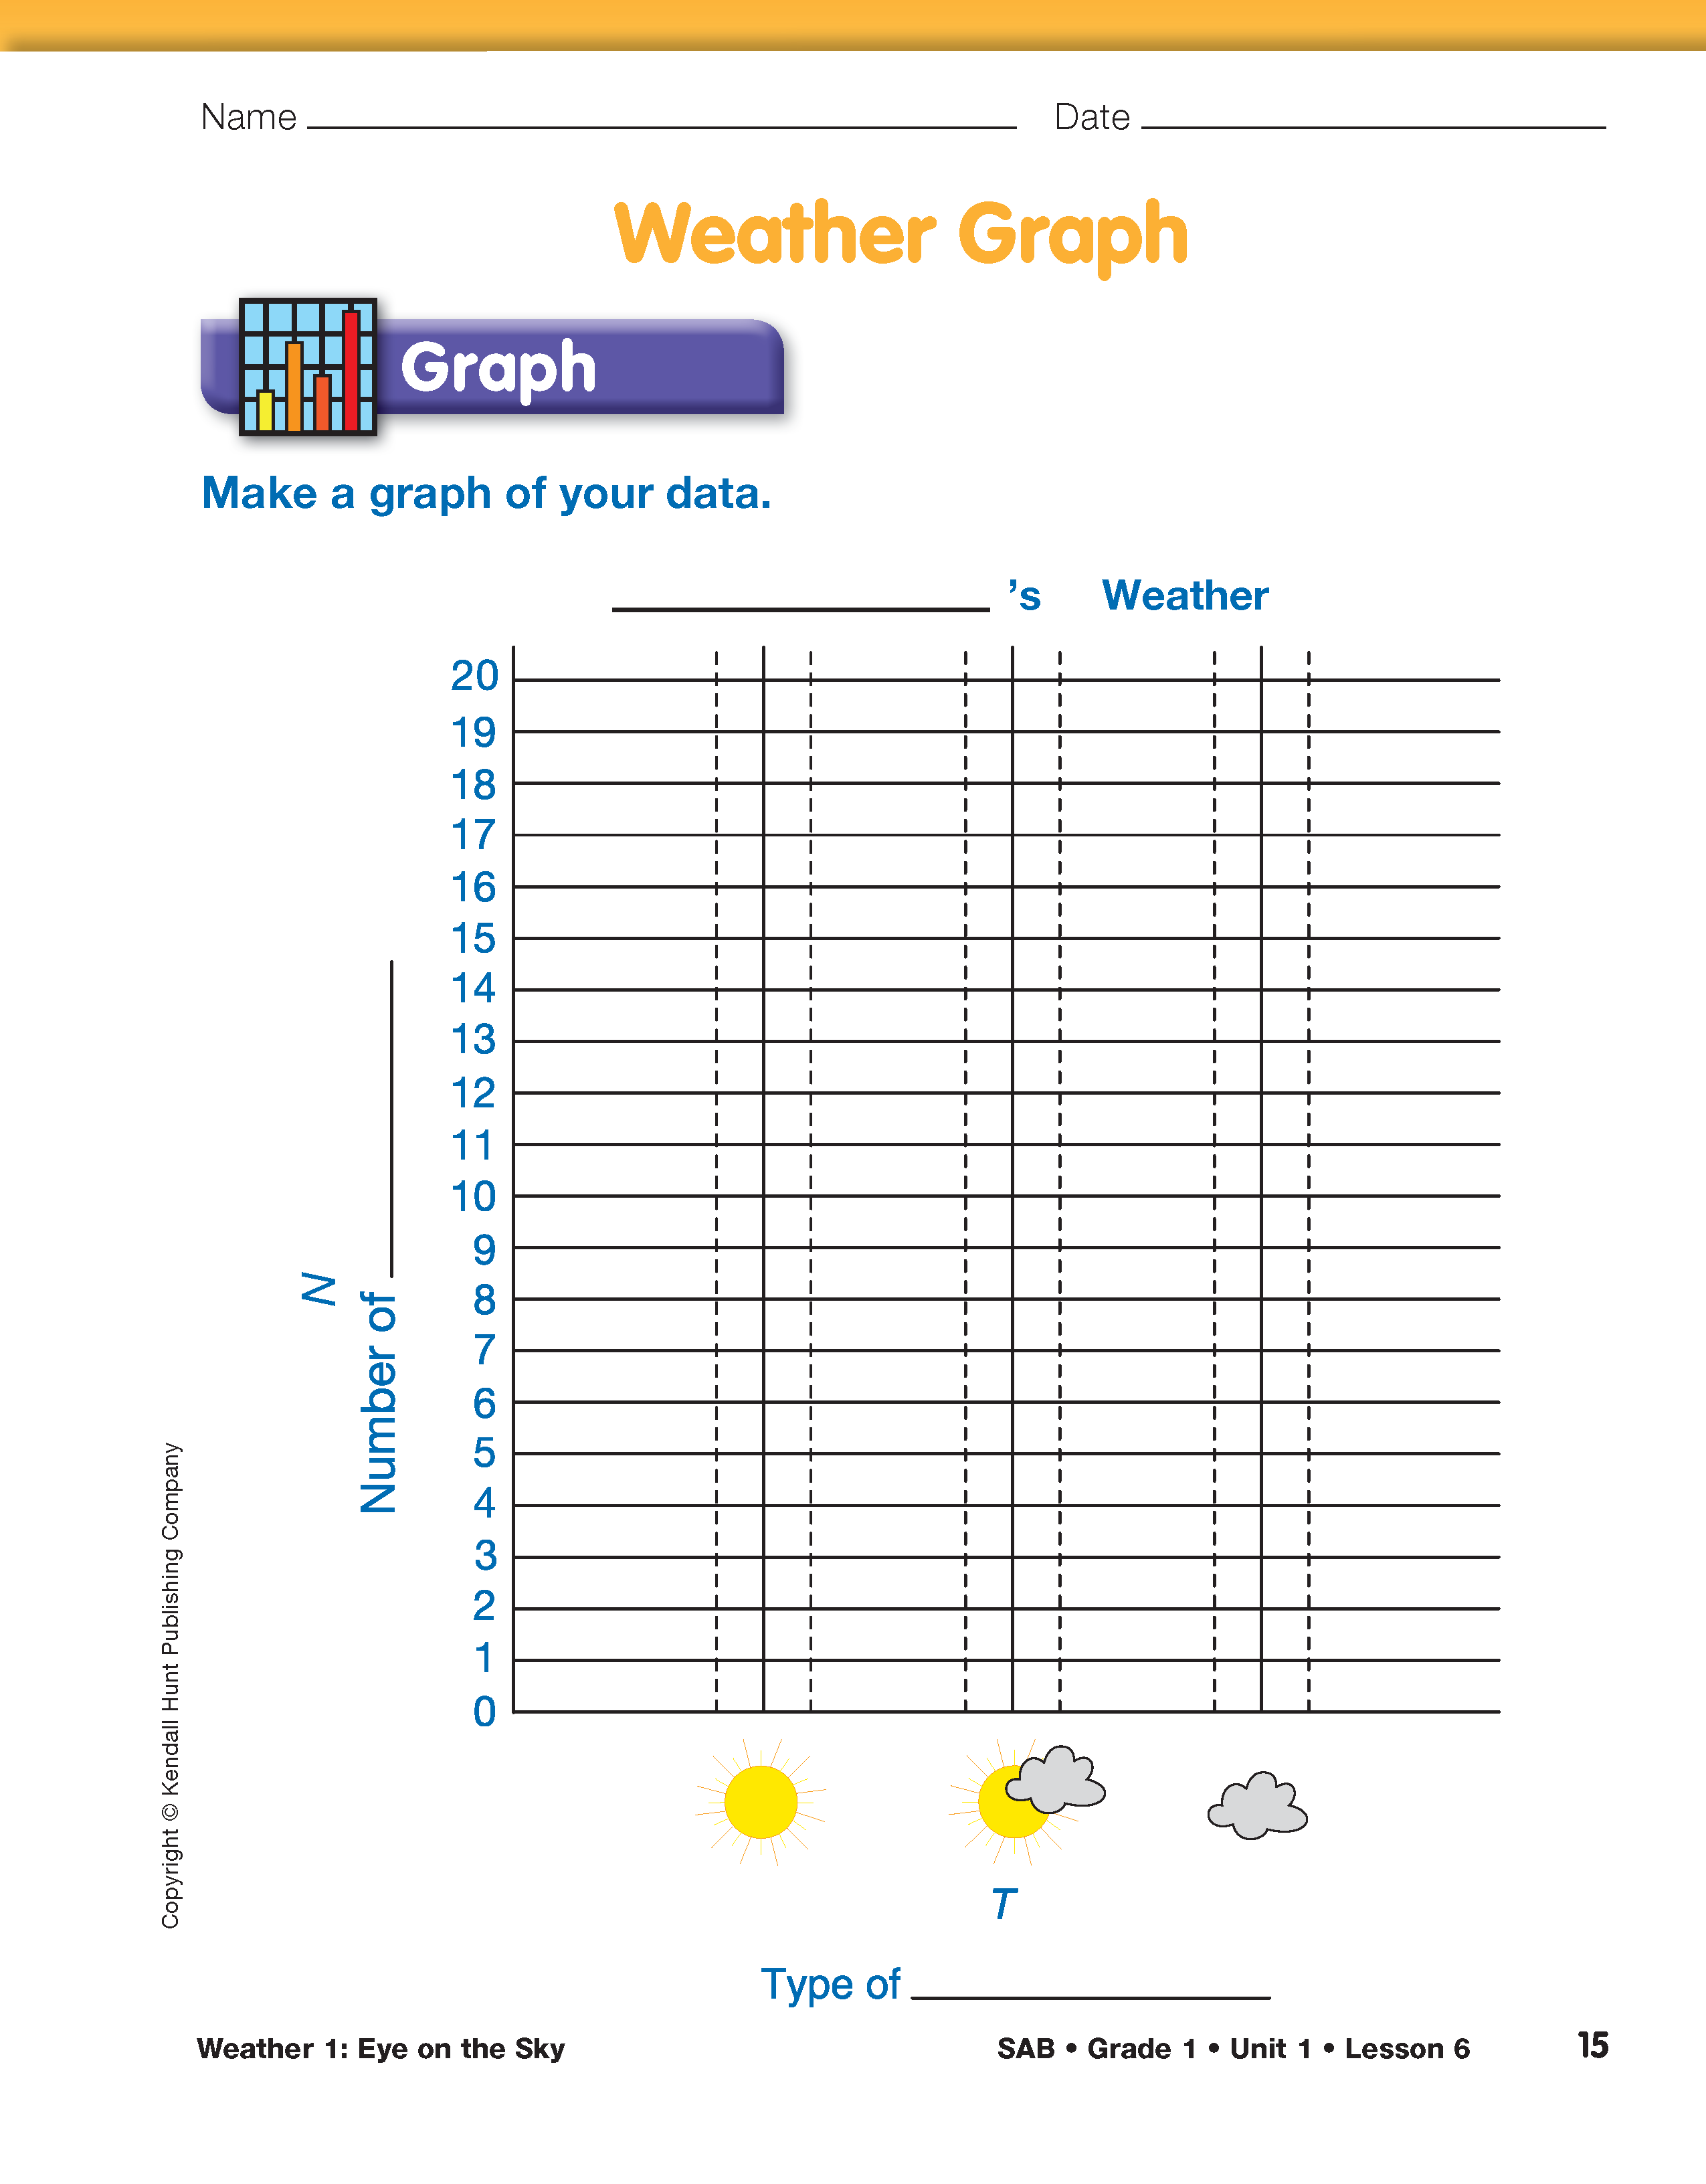
Tell students they will transfer their data from the Weather Data Table to the Weather Graph .Explain that the data table and the graph will show the same information in different ways. In a sense, the graph is a picture of the table.
Display and direct students' attention to the Weather Graph page. Adapt your instruction based on students' level of experience with graphs. See Content Note.


Title the graph "[Month Name]'s Weather." Tell students that the graph needs some labels. Highlight the connection between the data table and graph by reminding them that the same information on their data tables will need to be on their graphs
Point to the horizontal axis, and then the vertical axis on the display, respectively, and ask:
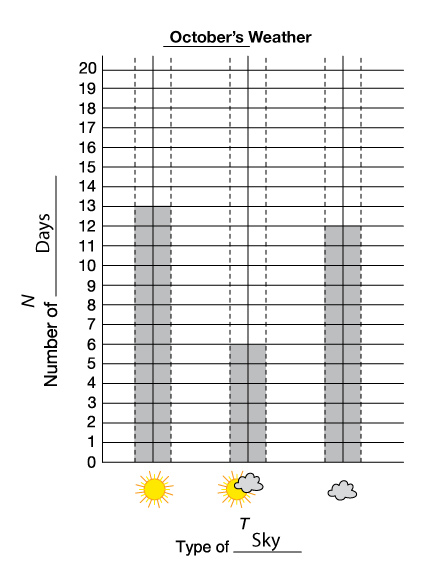
After the axes are labeled, demonstrate how to transfer the data from the table to the graph by drawing the first bar on the graph. Show students how to color each bar between the dotted lines as shown on the sample graph in Figure 3. Have students complete the other two bars on the graph as you demon-strate, or ask them to do so independently.
Analyze the Data. When the graphs are complete, make connections between the graphs and the data tables.
Ask:
Continue a discussion of the weather data using their graphs.
Ask:
To solve this problem, students must determine how many days are in half the month. Once they determine the value of "half," they only need to compare it with the number for the most common type of sky. They can solve this problem in a variety of ways. Possibilities include the following:
- Students can use 30 or 31 connecting cubes and try to make two equal towers, each of which represent one-half of the days of the month.
- Students can divide the number of weeks in half and interpret the extra days. This strategy allows students to work with smaller numbers.
- One of the more inventive solutions is to fold the calendar in half (horizontally or vertically) and count the number of days on one half.
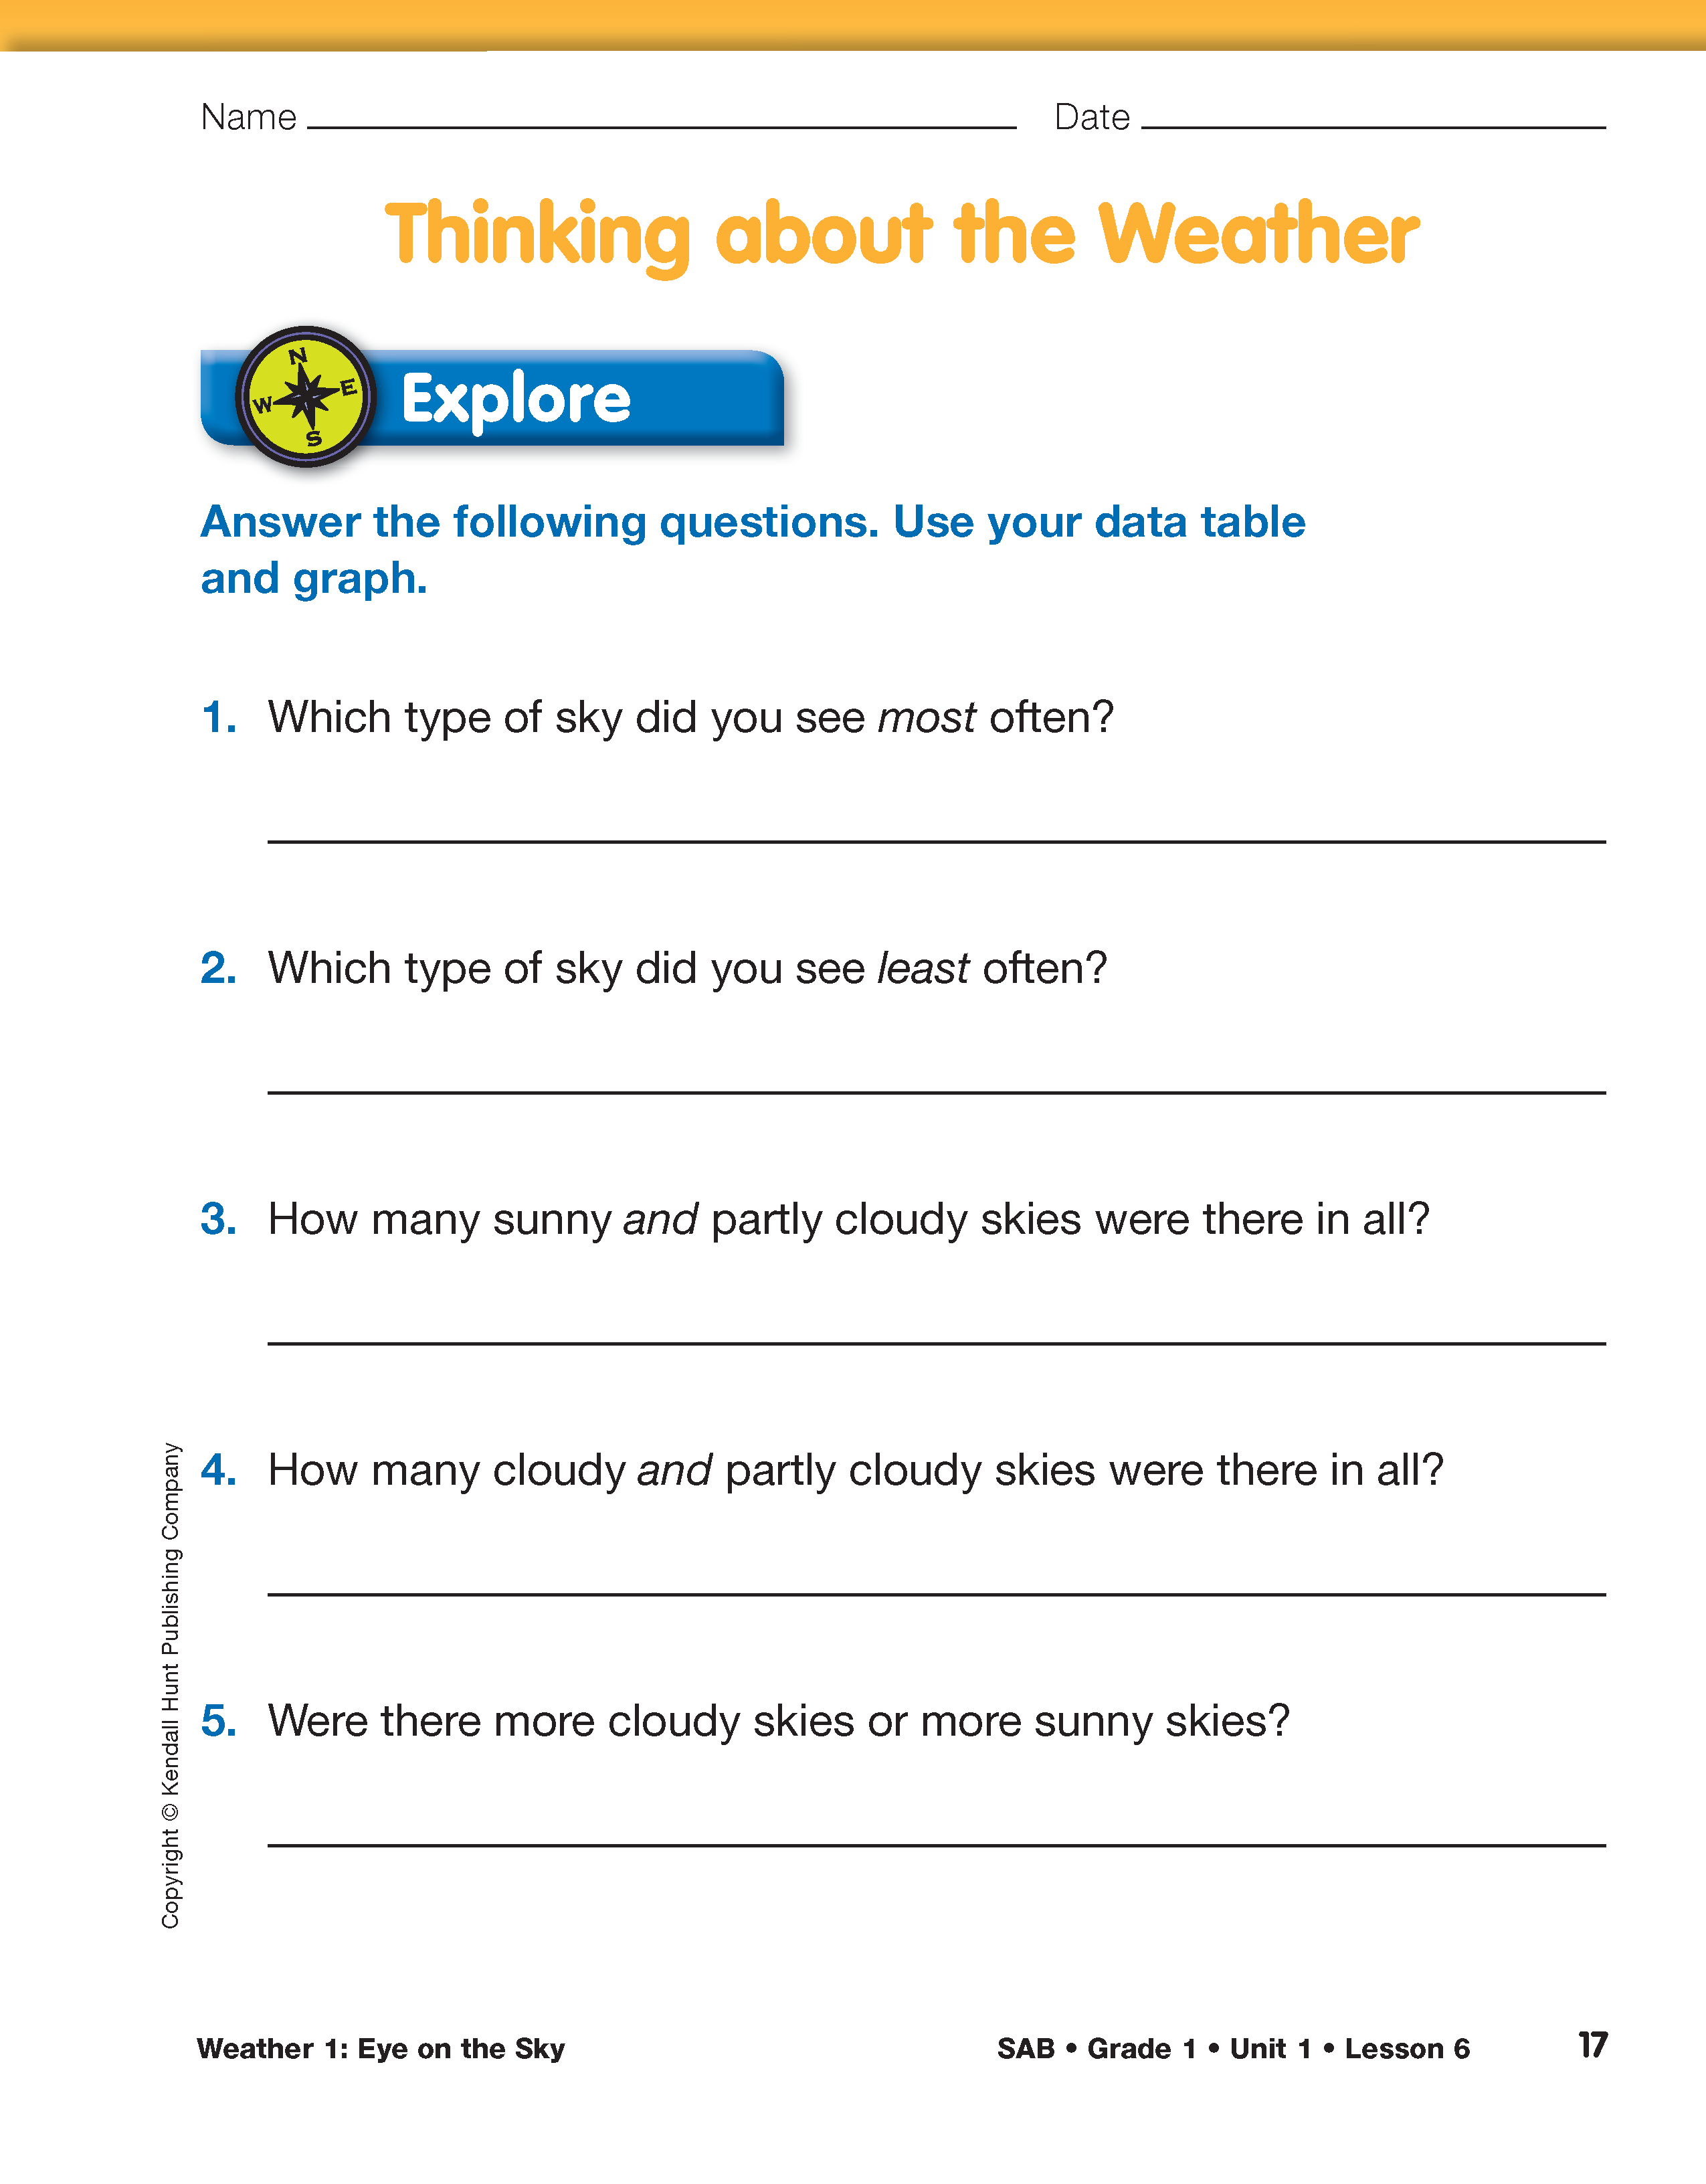
Have students share their strategies and solutions. Then assign the Thinking about the Weather page to student pairs. Students may use their data tables and graphs to answer the questions. Use the questions to guide further discussion about students' discoveries about the month's weather.