


Mapping Rain Forest Trails
Est. Class Sessions: 3Developing the Lesson
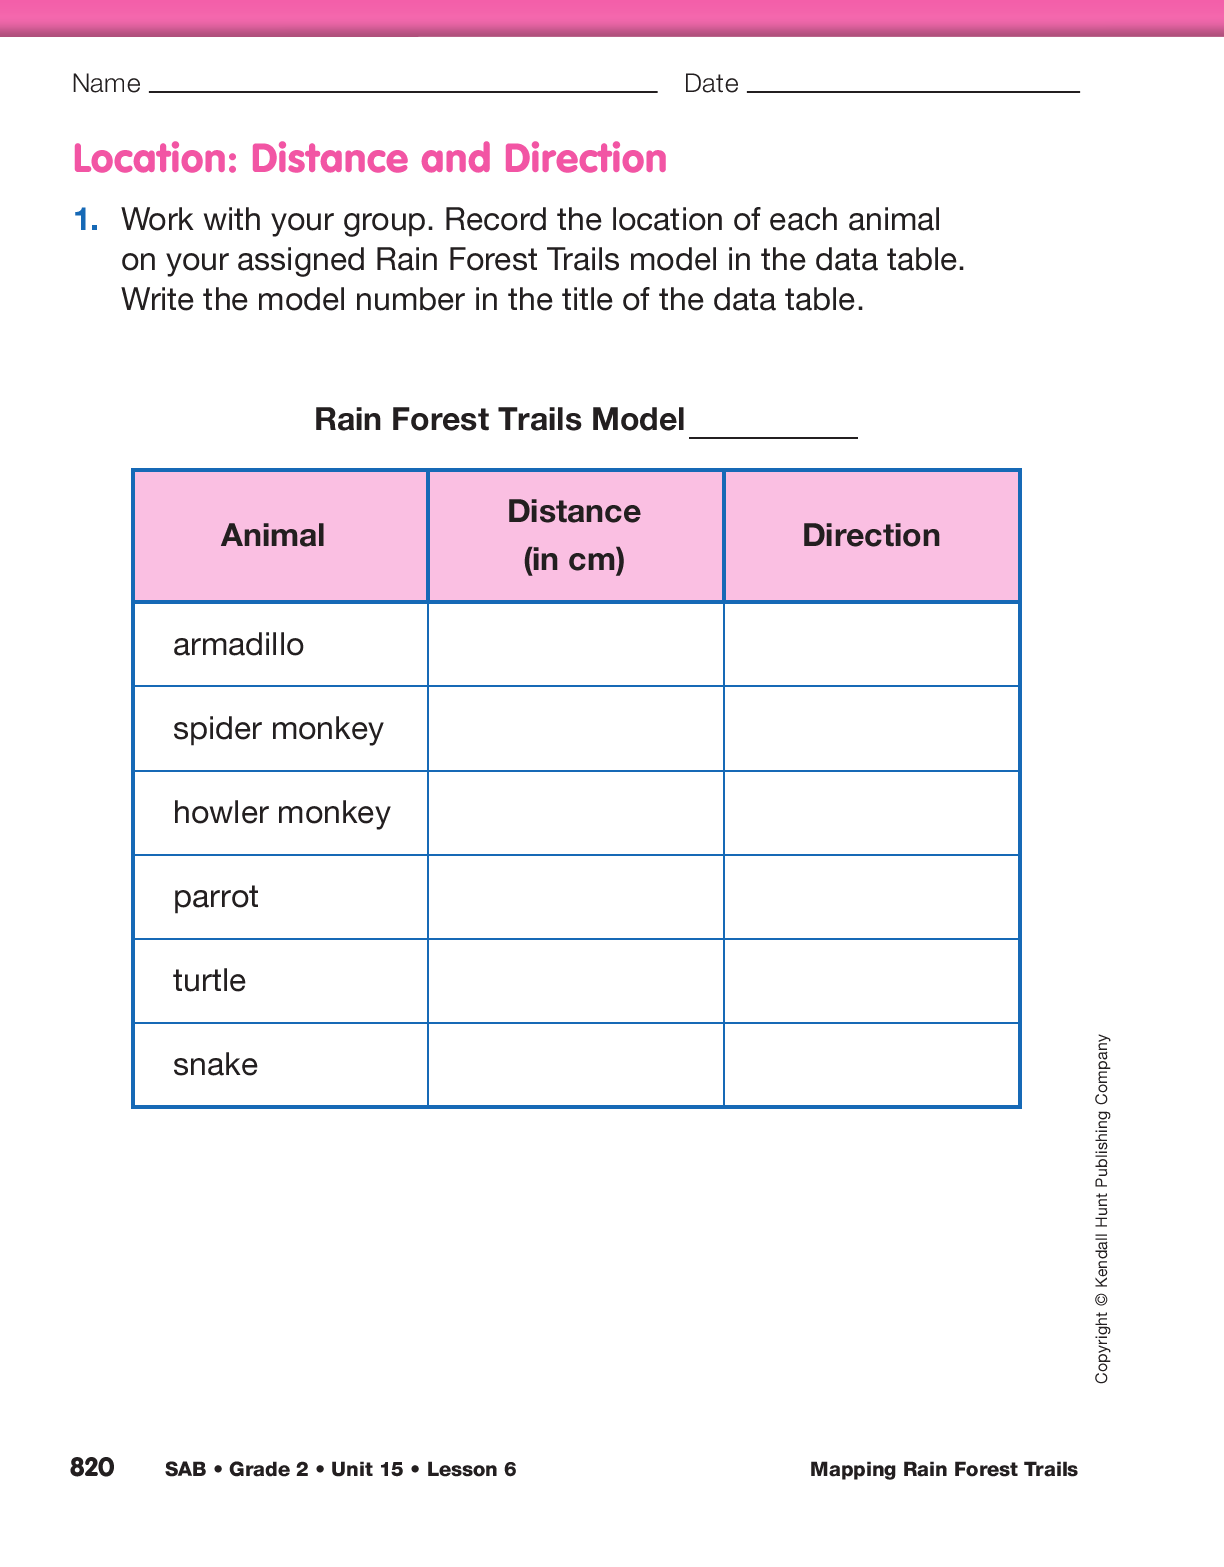
Part 2: Using Direction and Distance to Describe Location
Exchange Rain Forest Trails Models, Measure, and Record. The same groups that prepared the Rain Forest Trails models in Part 1 of this lesson should work together for this part of the lesson. Distribute one model to each group making sure no group is assigned the same model they prepared in Part 1. Help students visualize the next part of this lesson by telling them the following story:
Pretend you are a team of scientists studying animals in the rain forest. Two trails meet and cross at the place where you set up your camp. Your team of scientists wants to find out what kinds of animals live along these trails and where the animals are located in relation to your camp.
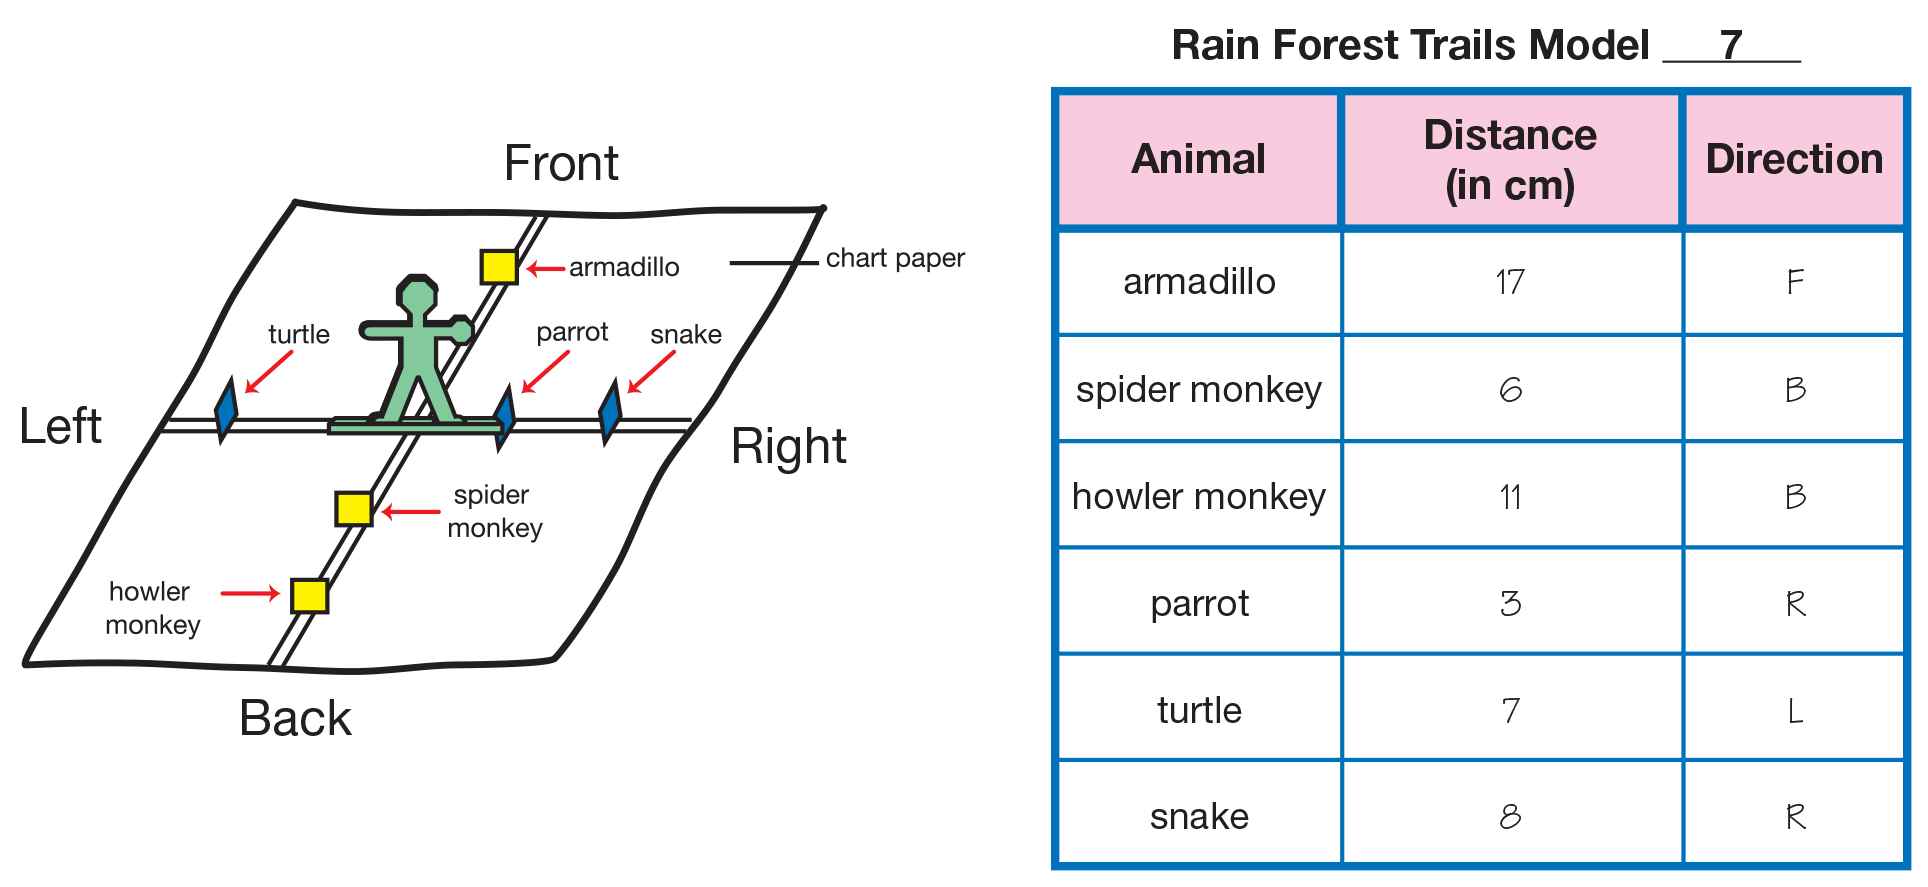
Direct students to the data table in the Location: Distance and Direction section of the Mapping Rain Forest Trails pages in their Student Activity Book. Explain that they will work as teams of “rain forest explorers” to locate the position of the animal pictures on the trails or axes of their assigned rain forest models. Have group members take turns measuring the distance of each animal from the origin using a centimeter ruler. Other group members can double-check the measurements for accuracy. Remind students to measure from the center of Mr. Origin. Emphasize that to precisely identify an animal’s location, they need to determine not only the animal’s distance from the origin but also its direction from the origin. Each group member will record the location of each animal on his or her own data table. Figure 2 shows a complete data table using data that matches the display model.
Once students have identified the animals’ locations on their data tables, distribute the appropriate Key for Rain Forest Trails to each student group so they can check their answers.
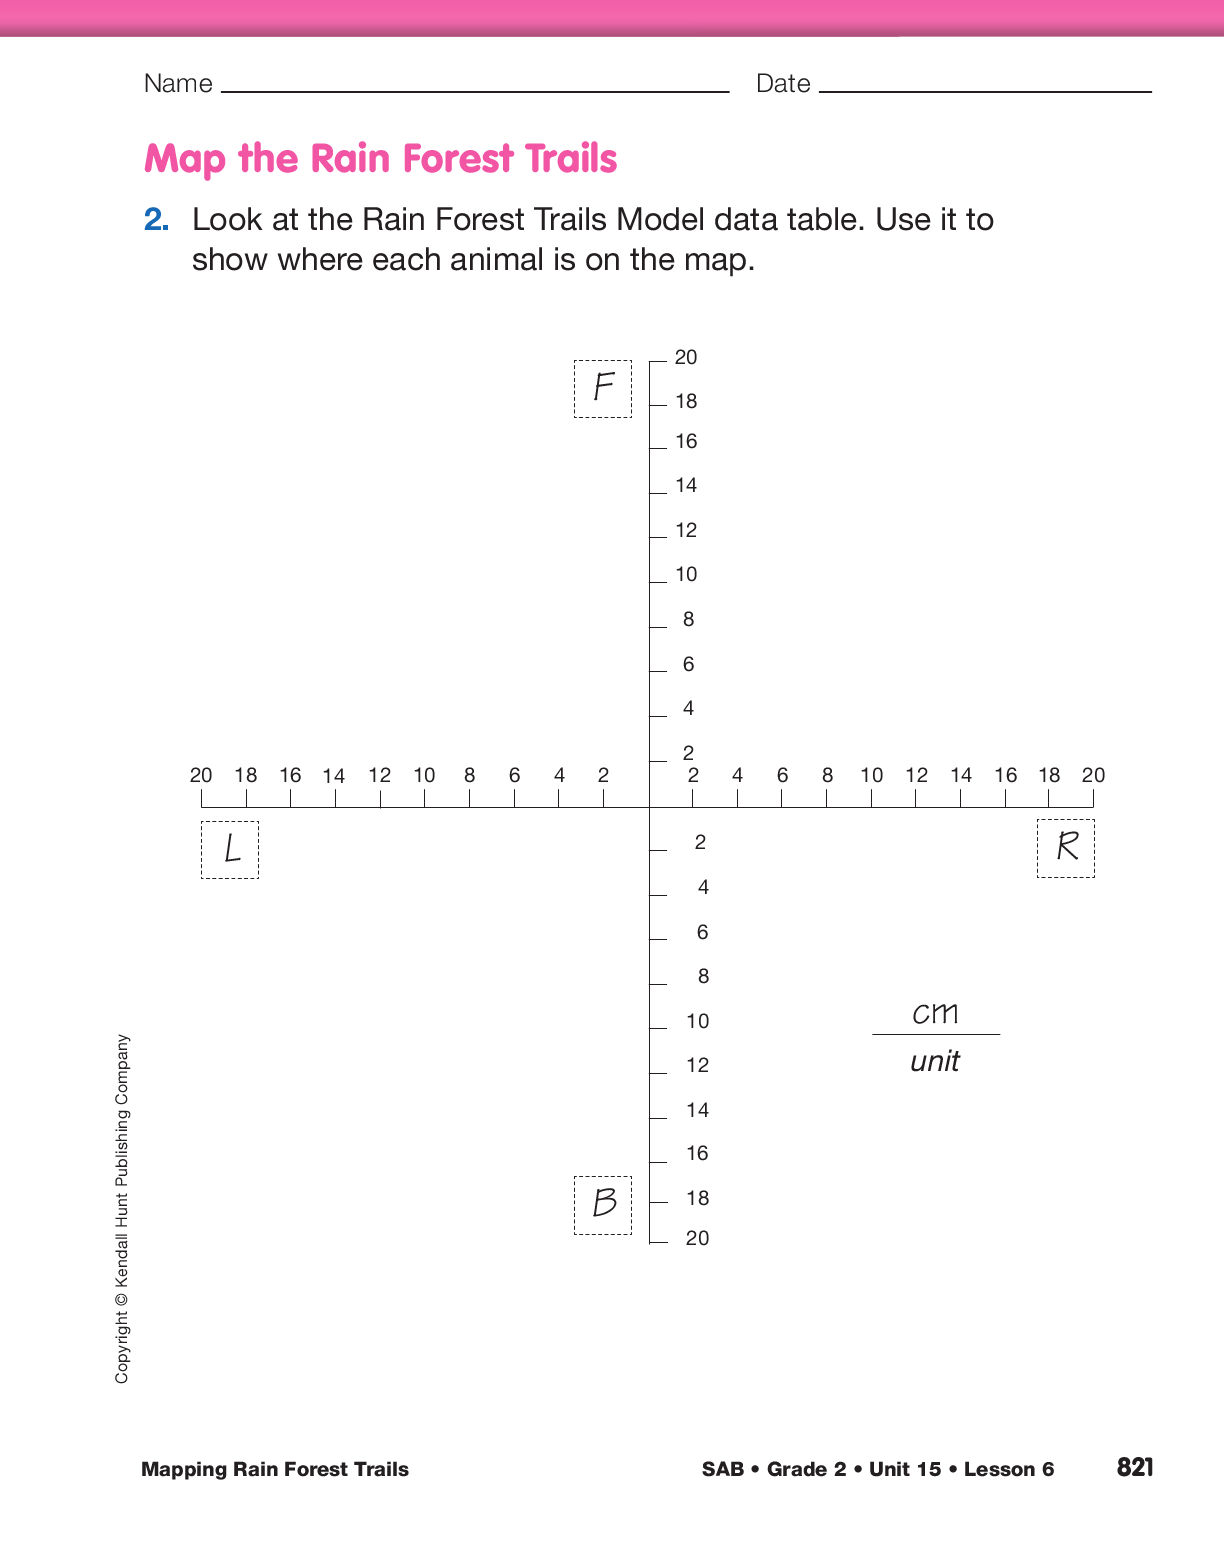
Map the Rain Forest Trails. Help students create a map with the location of each animal plotted along the two perpendicular axes of their assigned Rain Forest Trails model. To develop a meaningful context for making and using maps, continue the story you began earlier in the lesson:
You and your team of researchers have returned home from the rain forest. You want to help others understand where you found each of the animals in relation to your camp. You decide to make a drawing or map to represent what you found.
Ask:
Display the Map the Rain Forest Trails section of the Mapping Rain Forest Trails pages in the Student Activity Book. Ask students to look at the display and compare it to your display Rain Forest Trails model.
Ask:
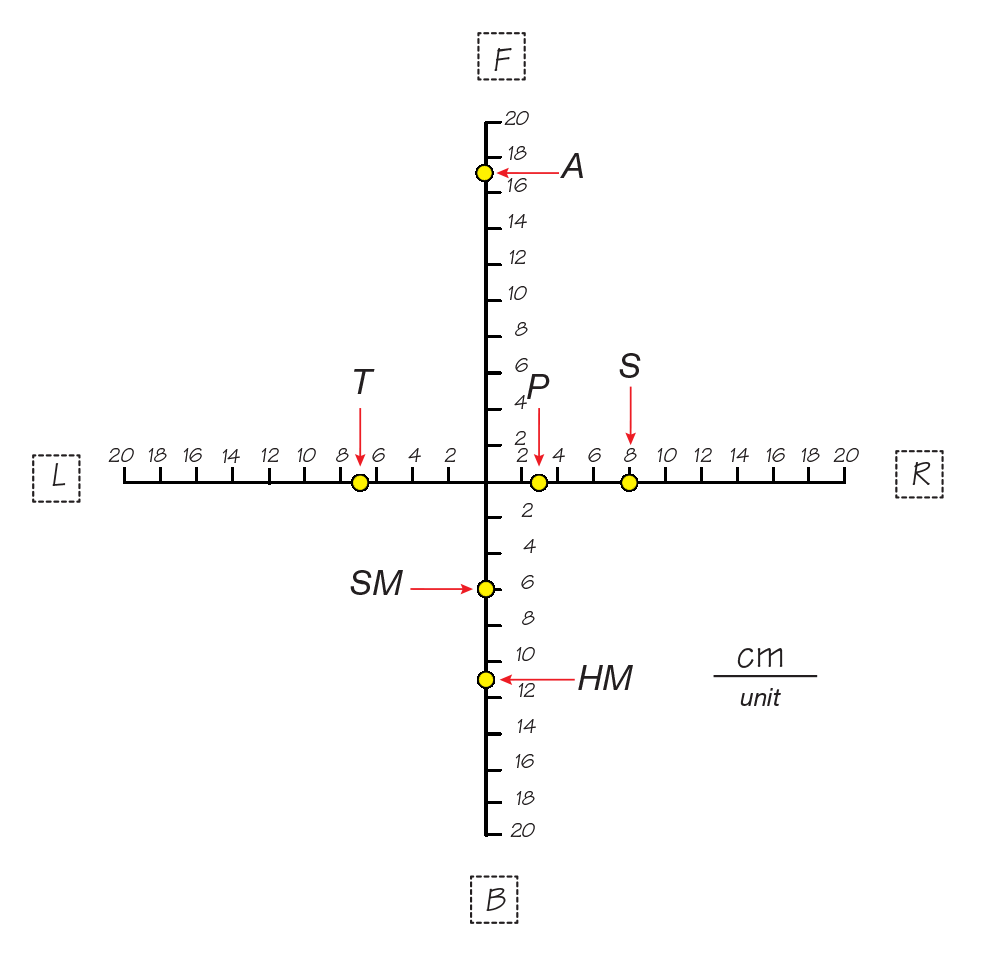
Students are now ready to plot and label the points where the animal pictures are located on their maps. Tell students to use abbreviations to label the locations of the animals. See Figure 3 for abbreviations and a completed sample map using the data from your display model.
- A (armadillo)
- SM (spider monkey)
- HM (howler monkey)
- P (parrot)
- T (turtle)
- S (snake)