Students should complete Questions 12–13 independently.
These questions encourage students to compare
their family to other families in the class.
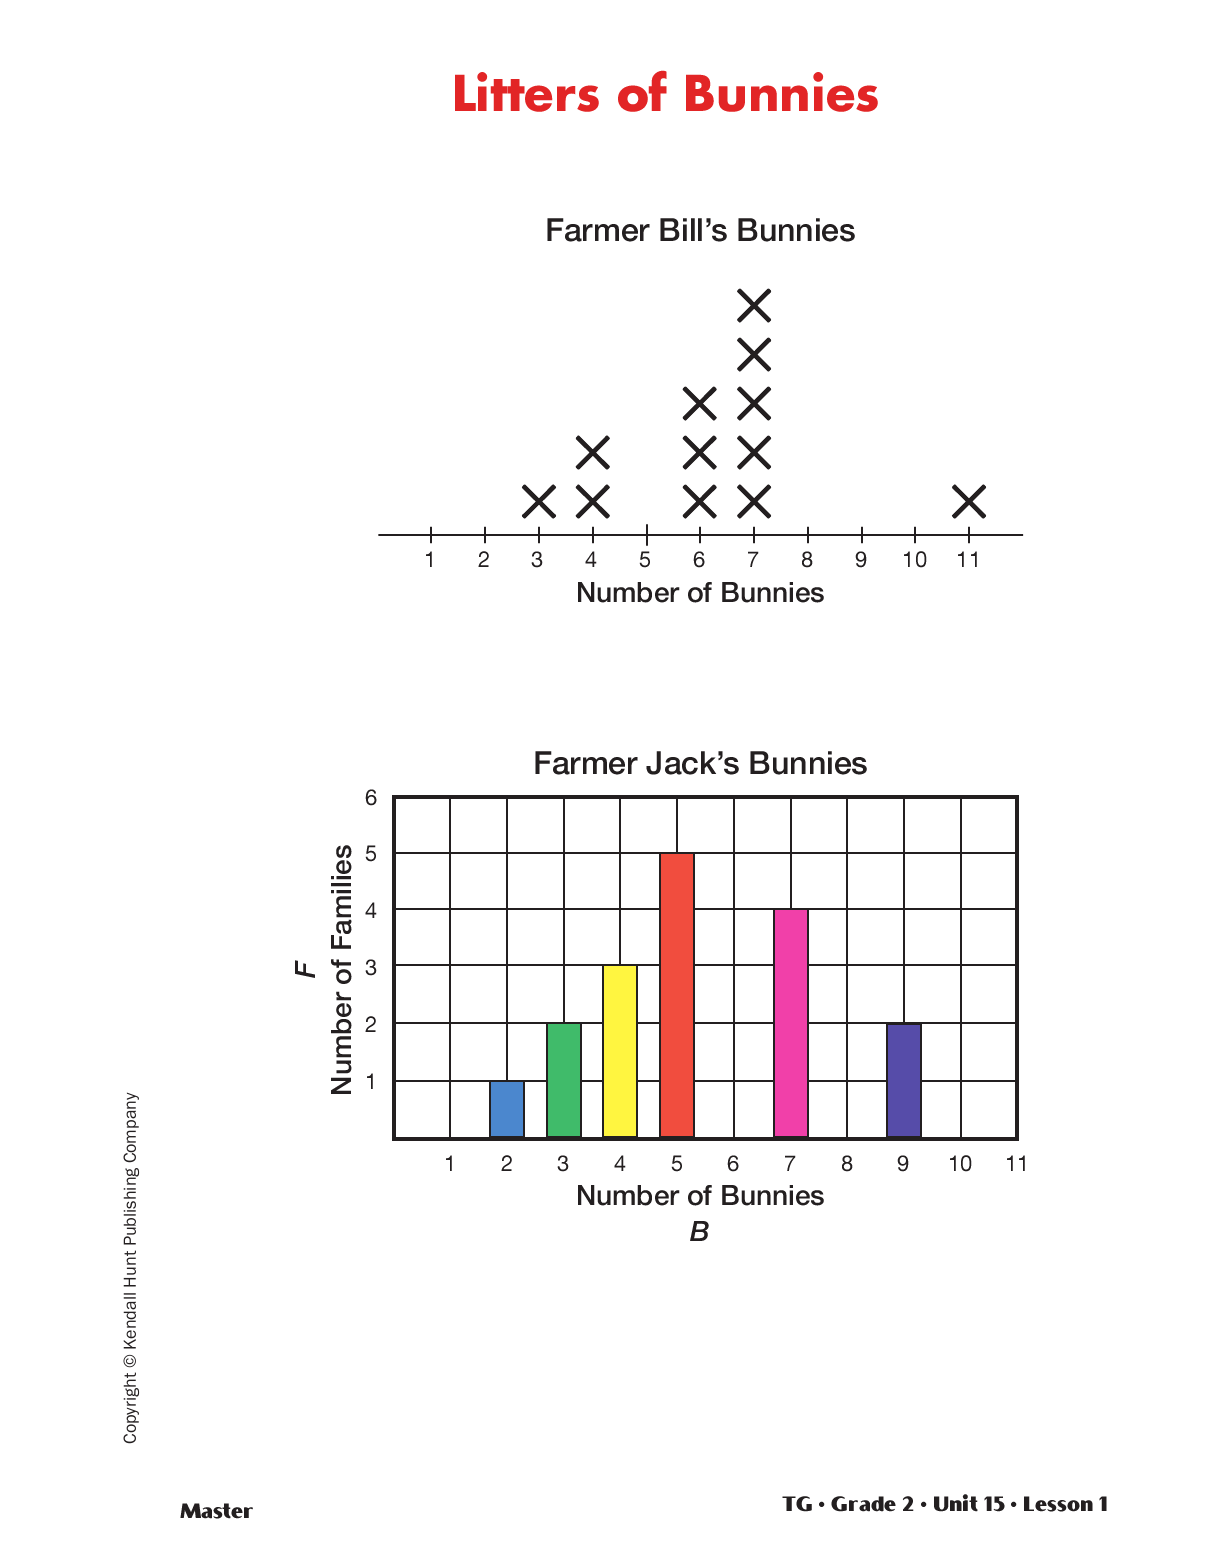
Display the Litters of Bunnies Master. Compare the
line plot and bar graph, then pose the questions that follow. Encourage students to support their predictions
with the data represented in the line plot or graph.
You may wish to share with students that rabbit offspring are
called kits or kittens. For our purposes we chose to call the
offspring “bunnies“ to keep the language simple and
consistent with the idea of kids in a family.
- What is the most common number of bunnies a
rabbit might have in a litter? How do you know?
(5 to 7 is the most common number of bunnies in a litter.)
- Is it more likely that a rabbit might have more than
4 or fewer than 4 bunnies? Explain your thinking.
(It is more likely to have more than 4 bunnies in
a litter. Only 6 families on both farms together
had fewer than
4 bunnies in a litter. Many more
families had more than
4 bunnies in a litter.)
- The data shows the bunnies born on each farm
last month. Who will have more bunnies next
month, Farmer Bill or Farmer Jack? How do you
know? (Possible responses: Farmer Jack will
have more bunnies next month. I added
3 + 8 + 18 + 35 + 11 = 75 for Farmer Bill and
2 + 6 + 12 + 25 + 28 + 18 = 91 for Farmer
Jack; 91 is much more than 75 so I thought that
might happen again. The line plot shows 12 families
on Farmer Bill’s farm and the graph shows
17 families on Farmer Jack’s farm so it is more
likely that 17 families will have more bunnies
than 12 families.)
- What tools did you use to help you answer this question? (Possible response: a 200 Chart or number line)
Explore students’ strategies for determining values to add for both the line plot and graph to find the
total number of bunnies for each farm as well as how they determined the number of families on each farm.
Revisit Student Predictions.
Refer students’ attention
to the list of predictions about the most common
number of children collected at the start of the lesson.
- How close were your predictions?
- Why do you think your prediction was off? (Possible response: I was basing my prediction on a small set of families.)
- In the story we learned that Betty was an only
child. If she were a member of our class, would her family be unusual? Explain your thinking.
- If another student moved into our class, do you think it would be very likely or very unlikely that
the new classmate’s family will have five or more children. How do you know?
- Predict how many children would be in the new classmate’s family. Tell how our data helped you decide.
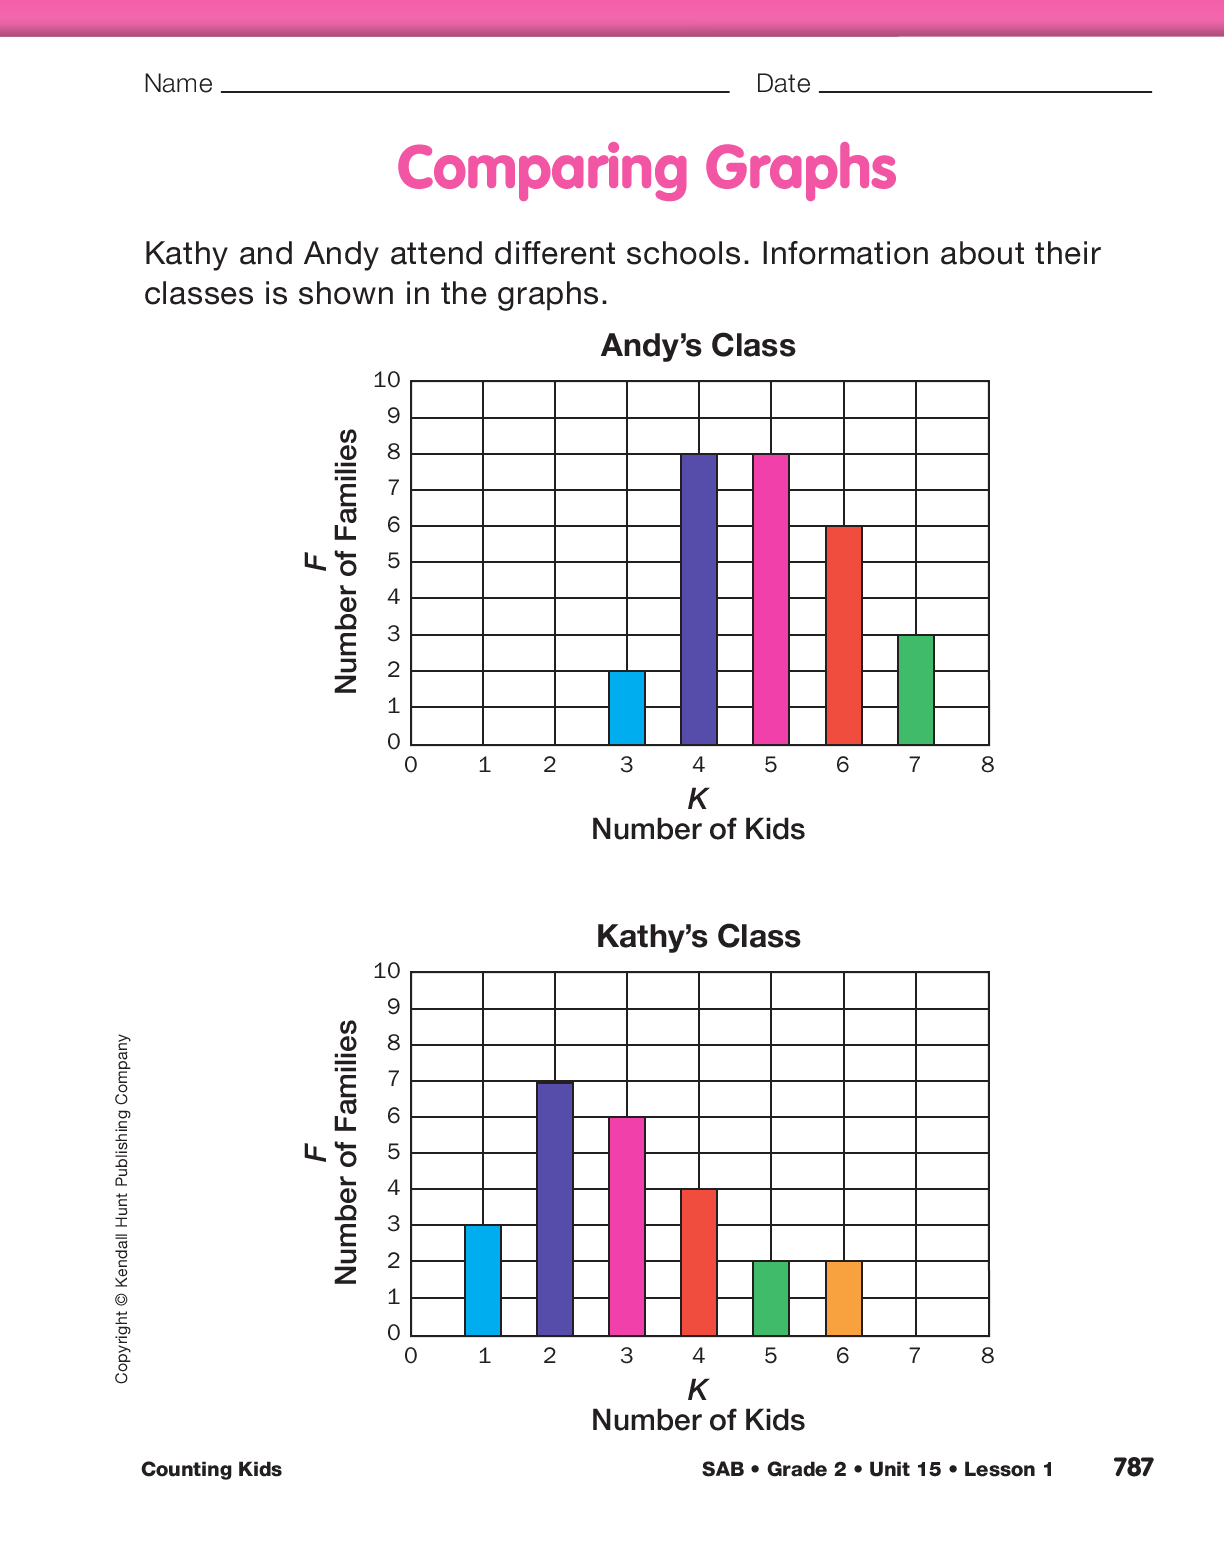
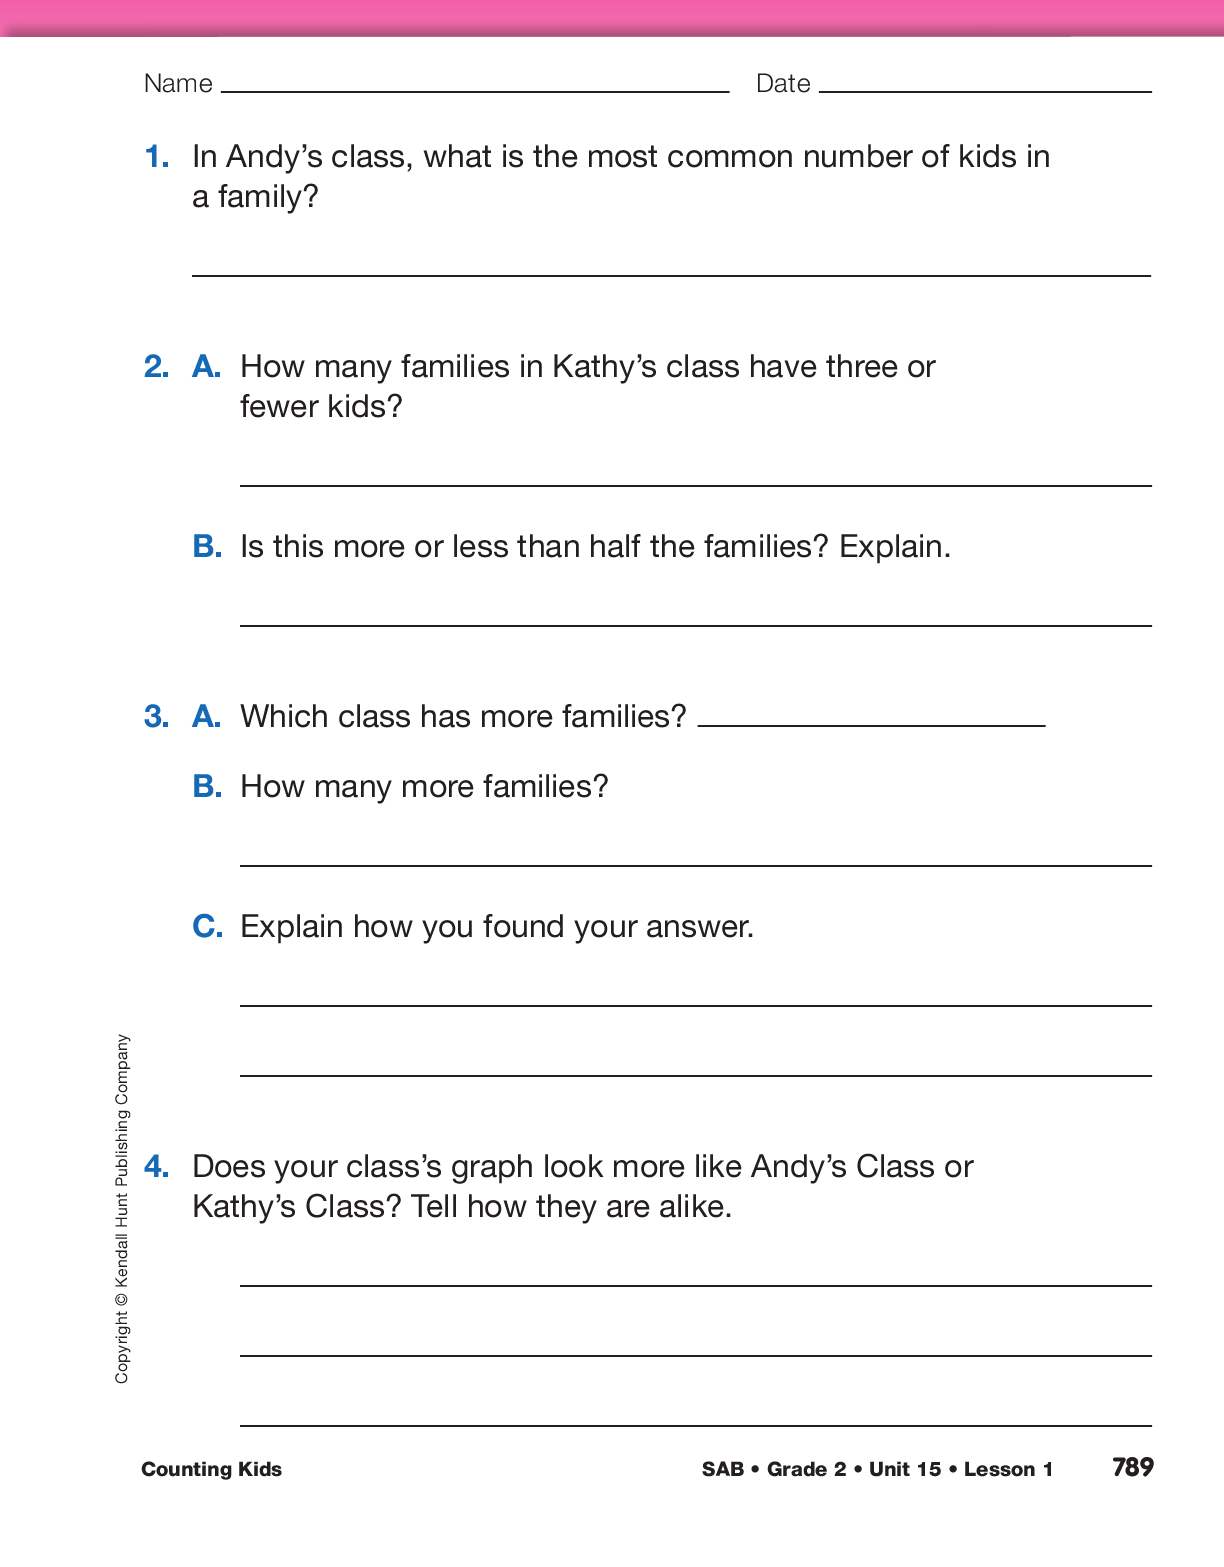
Ask students to complete the Comparing Graphs
pages in the Student Activity Book independently.
Students are asked to interpret and compare bar
graphs of students in two different classrooms.
Students will need to have their Counting Kids
graphs available to answer Question 4.
Use the Comparing Graphs pages in the Student Activity Book to assess students’ abilities to read a table, bar graph, or line
plot to find information about a data set [E6] and make predictions and generalizations using patterns in tables and graphs [E7].