Collect Survey Data in a Line Plot.
Explain to students
that their individual data needs to be combined
as data for the whole class. Give each student a self-adhesive
note to record his or her name and the number
of kids in his or her family. As students finish,
ask them to place their self-adhesive note above the
appropriate number on the line plot you prepared.
See Materials Preparation. See Figure 3 for a sample
line plot.
Once the line plot is complete, ask prompts
similar to the following:
- How many families are shown on the line plot? How do you know?
- Does that match the number of students in the class?
- How many kids are represented on our line plot? How do you know?
- Why doesn’t this match the number of self-adhesive notes?
- According to our data, what is the most common number of kids in a human family?
Line Plots and Bar Graphs. Line plots are used to represent
frequency distribution (how often something happens). Line
plots work well for small amounts of data but become
cumbersome for larger data sets. A bar graph can also be
used to represent frequency with the added advantage of a
vertical axis to make it easier to analyze larger sets of data.
Graph Data. Review with students how a line plot
and a bar graph are similar and different. Then discuss
how they could transfer the data from the class
line plot to a graph. Students should recognize that
both have a horizontal axis but the line plot does not
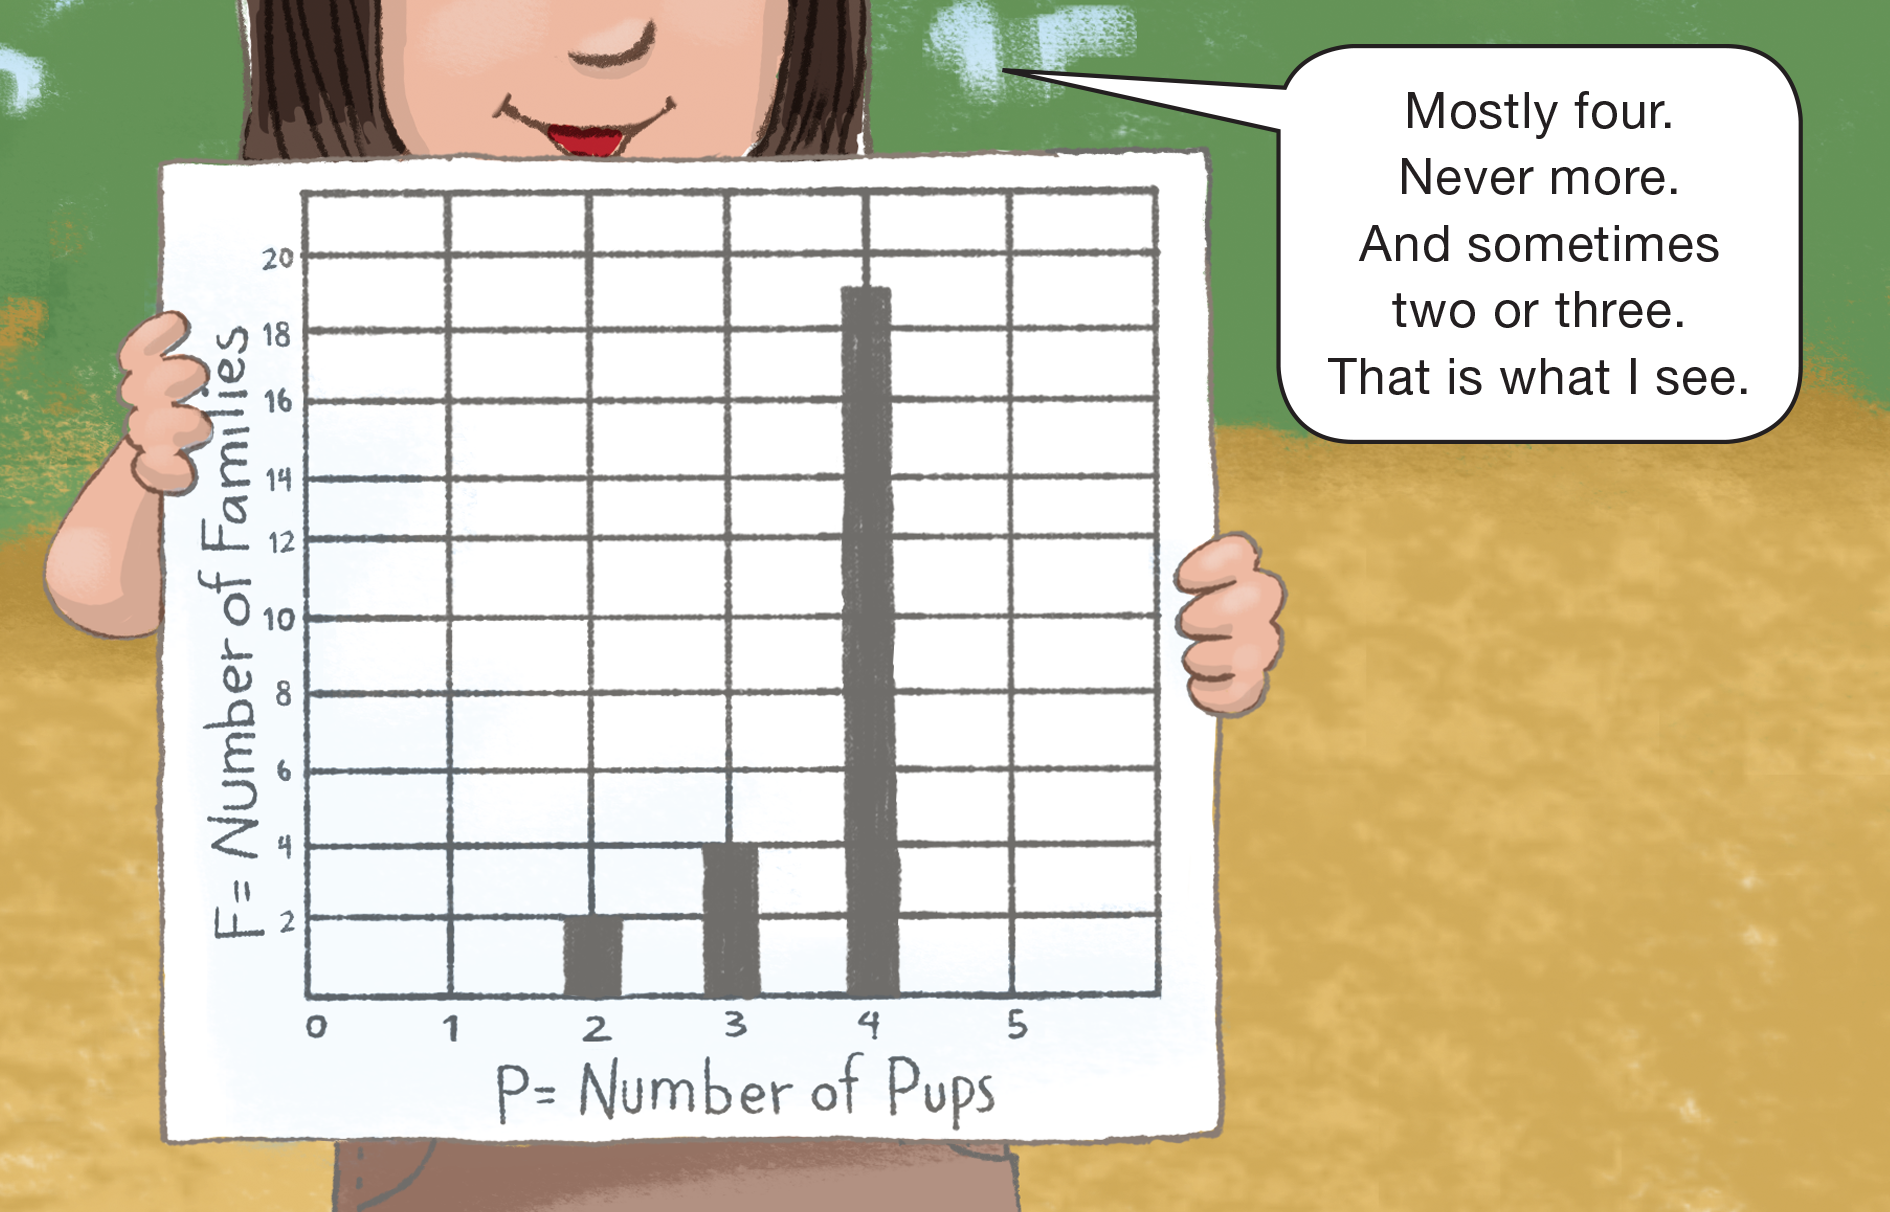
have a vertical axis. Display Betty’s graph from the
“Armadillo Families” story in the Adventure Book.
- How did Betty label the horizontal axis on her graph? (number of pups)
- What is the smallest number of pups in her data? (Possible response: 0 pup or 2 pups)
- What is the smallest number of kids in our class
data? (Possible response: 1 kid)
- Based on our class data, could we have zero kids
in a family? (Possible response: No, since each of
the students is a kid, each family in the class data
will have at least one kid.)
- What if you do a survey asking all the people in
the school to count the number of kids in their
house, would zero make sense? (Possible
response: Yes, [Mrs. Johnson] does not have any
kids in her house.)
You may need to explain that “Number of Kids”
goes on the horizontal axis because they know the
values of that variable ahead of time and “Number
of Families” goes on the vertical axis because that is
what they found out. This scientific convention
makes it easier for scientists to communicate with
each other.
Refer to Betty’s graph again and ask:
- How did Betty number the vertical axis? (She counted by 2s.)
- Why didn’t she count by ones? (Possible
response: There is too much data. If she counted
by ones there would not have been enough room
on her paper for all the data.)
- How should you number the vertical axis on your
graph? (Possible responses: by 2s because there
are more than 10 families with 2 kids; or by 1s
because none of our bars will go higher than 10)
Have students make a bar graph on the graph paper
in the Graph section of the Counting Kids pages in the Student Activity Book. The bar graph should look
very similar to the line plot. See Figure 4 for a sample graph.
While students are working circulate and ask:
- How did you scale the vertical axis?
- What is the smallest number of kids in a family?
- What is the largest number of kids in a family?
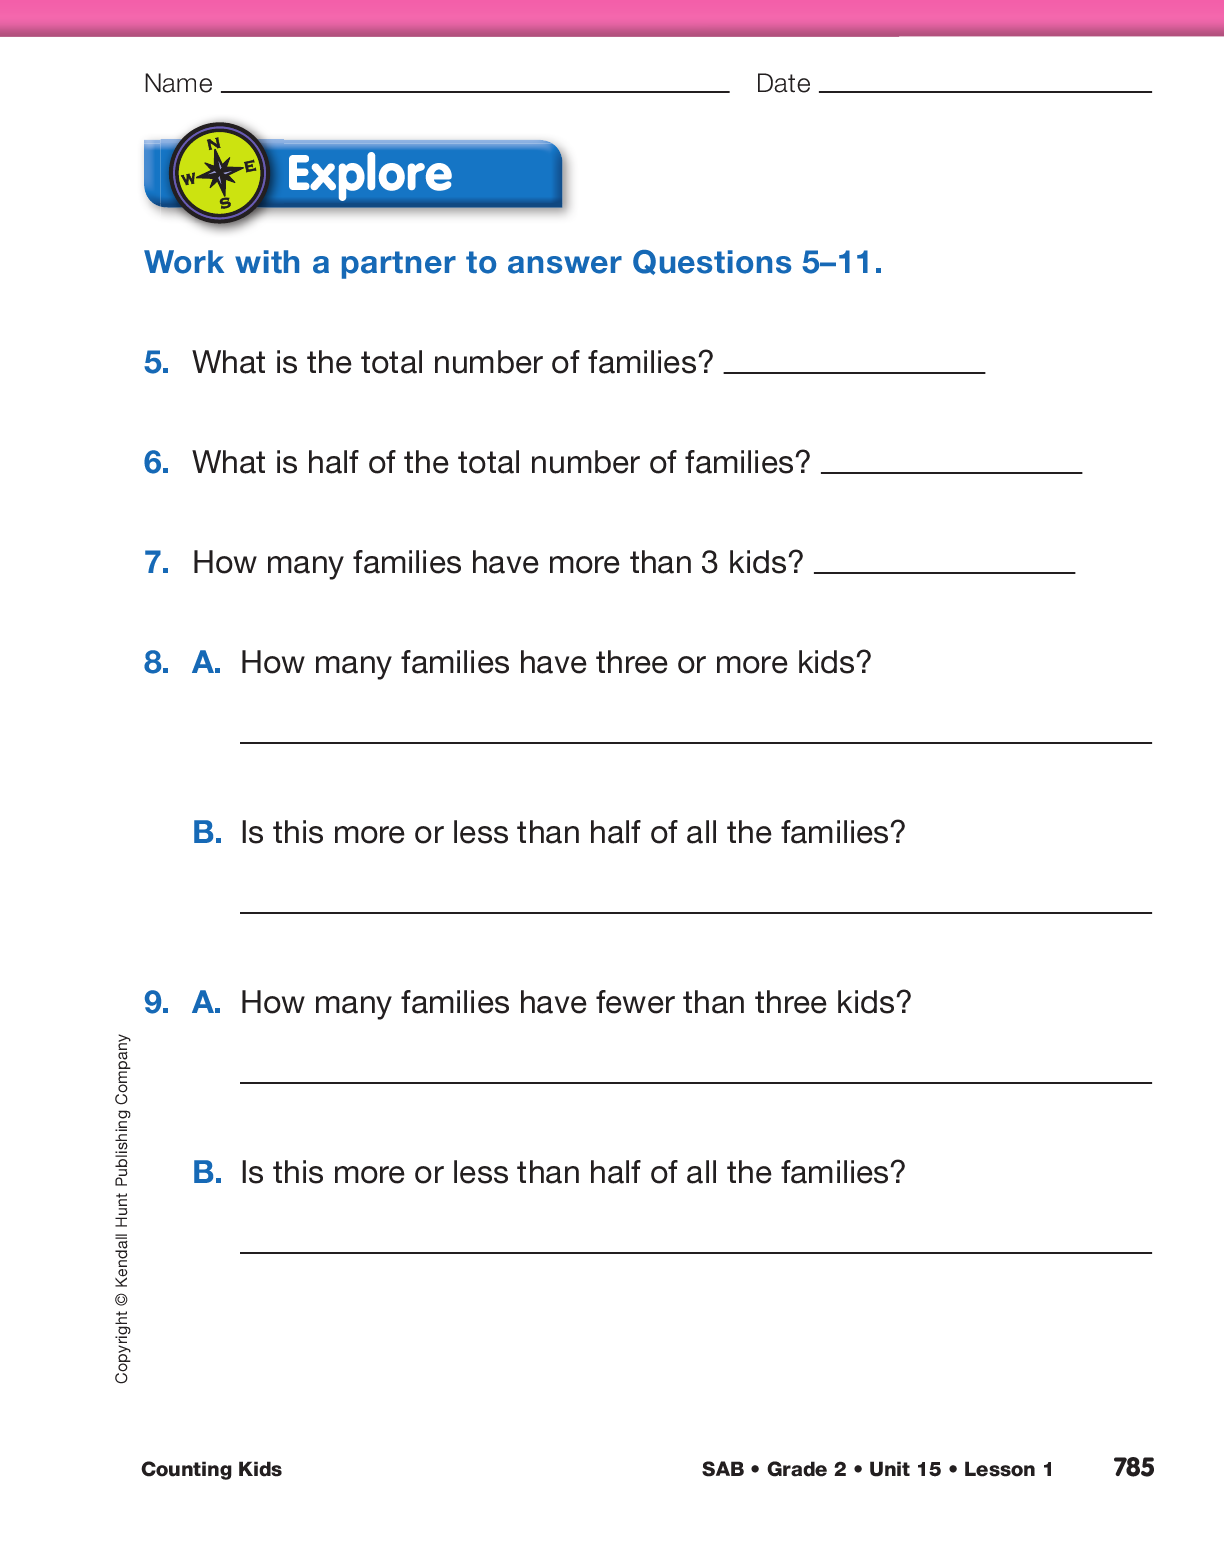
Explore Data. As students complete the graph, direct them to work with a partner to complete Questions 5 – 11
in the Explore section of the Counting Kids pages. As students are working, identify
students to share their solution strategies to each question during a class discussion. When most students
have completed these questions, review and discuss solutions by asking the identified students to share their solutions.
In particular, discuss the differences between the range of a data set and the
most common in a data set by discussing Questions 10–11.
- How did you determine the range of the number of
kids? (The first bar is above 1 and the last bar is
above 7 so the range of kids in our families is
one to seven.)
- What does the range tell us about the families in
our class? (It tells us that one kid is the smallest
number of children in some of our families and
seven is the most number of kids in some of our
families.)
- How did you decide what is the most common
number of kids in a family? (The tallest bar tells
us what number of kids is most common; that’s
3 kids for our class.)
- How is that different from the range of the number
of kids in a family in our class? (Most common
means most of our families have 3 kids. Range is
all the numbers of kids a family in our class
might have from smallest to greatest number of
kids.)