


Counting Kids
Est. Class Sessions: 2–3
In the Adventure Book story, Armadillo Families, Professor Robinson and his daughter Betty study the number of pups in armadillo families in the Brazilian rain forest, setting the context for students to survey their classmates about the number of children in the families of students in their class. Students then analyze their survey data represented in a line plot and bar graph.
Content in this Lesson
- Making a table, bar graph, or line plot to find information about a data
set [E5]. - Reading a table, bar graph, and line plot to find information about a data
set [E6]. - Making predictions and generalizations using patterns in tables and
graphs [E7].
Daily Practice and Problems A–D

Materials for Students
| Daily Practice and Problems | Lesson | Homework | Assessment | ||
|---|---|---|---|---|---|
Student Books |
Student Activity Book |
|
|
||
| Adventure Book |
|
||||
Teacher Resources |
Teacher Guide - digital |
Supplies for Students
3 × 3–inch self-adhesive note
desk number line (0–100)
Materials for the Teacher
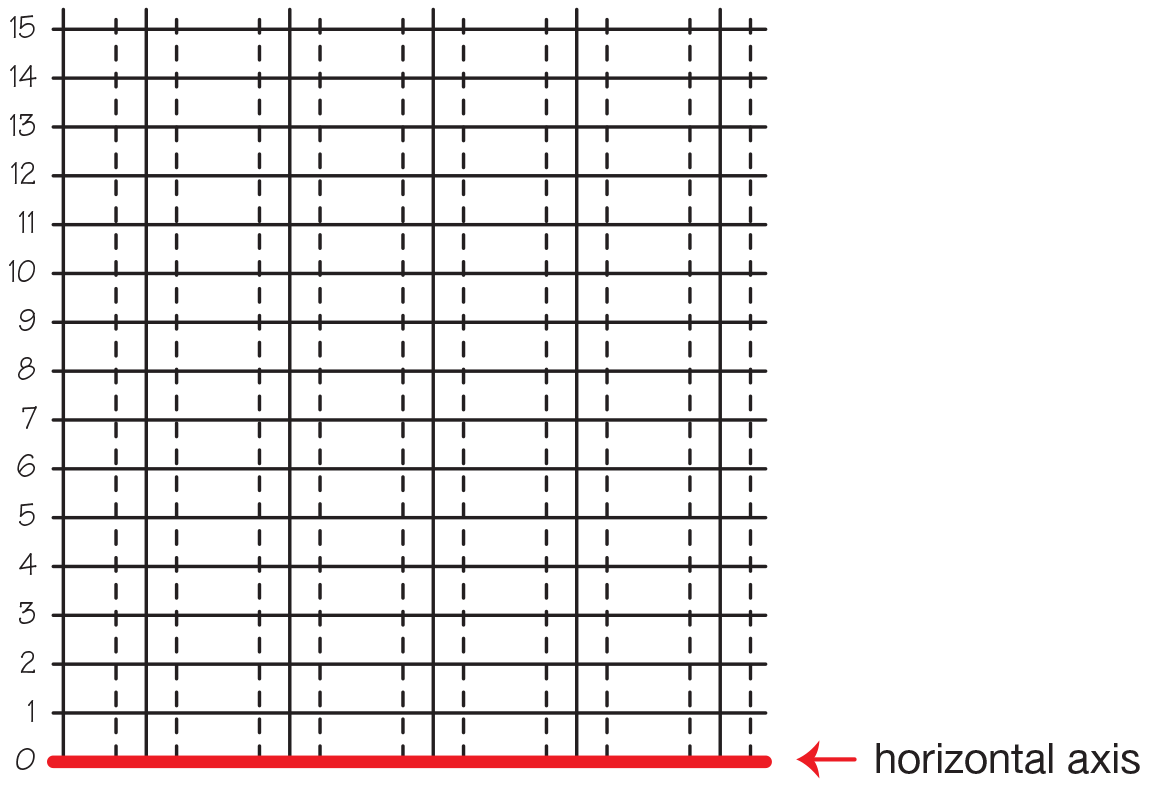
Display of the Horizontal Graph in the Graph section of Counting Kids (Student Activity Book) Page 784Display of Litters of Bunnies Master (Teacher Guide)
Unit 15 Assessment Record
world map or globe
chart paper
Materials Preparation
Make a Line Plot. Make a line plot on the board or on chart paper. See Figure 1. Leave enough room so self-adhesive notes can be placed above each number.
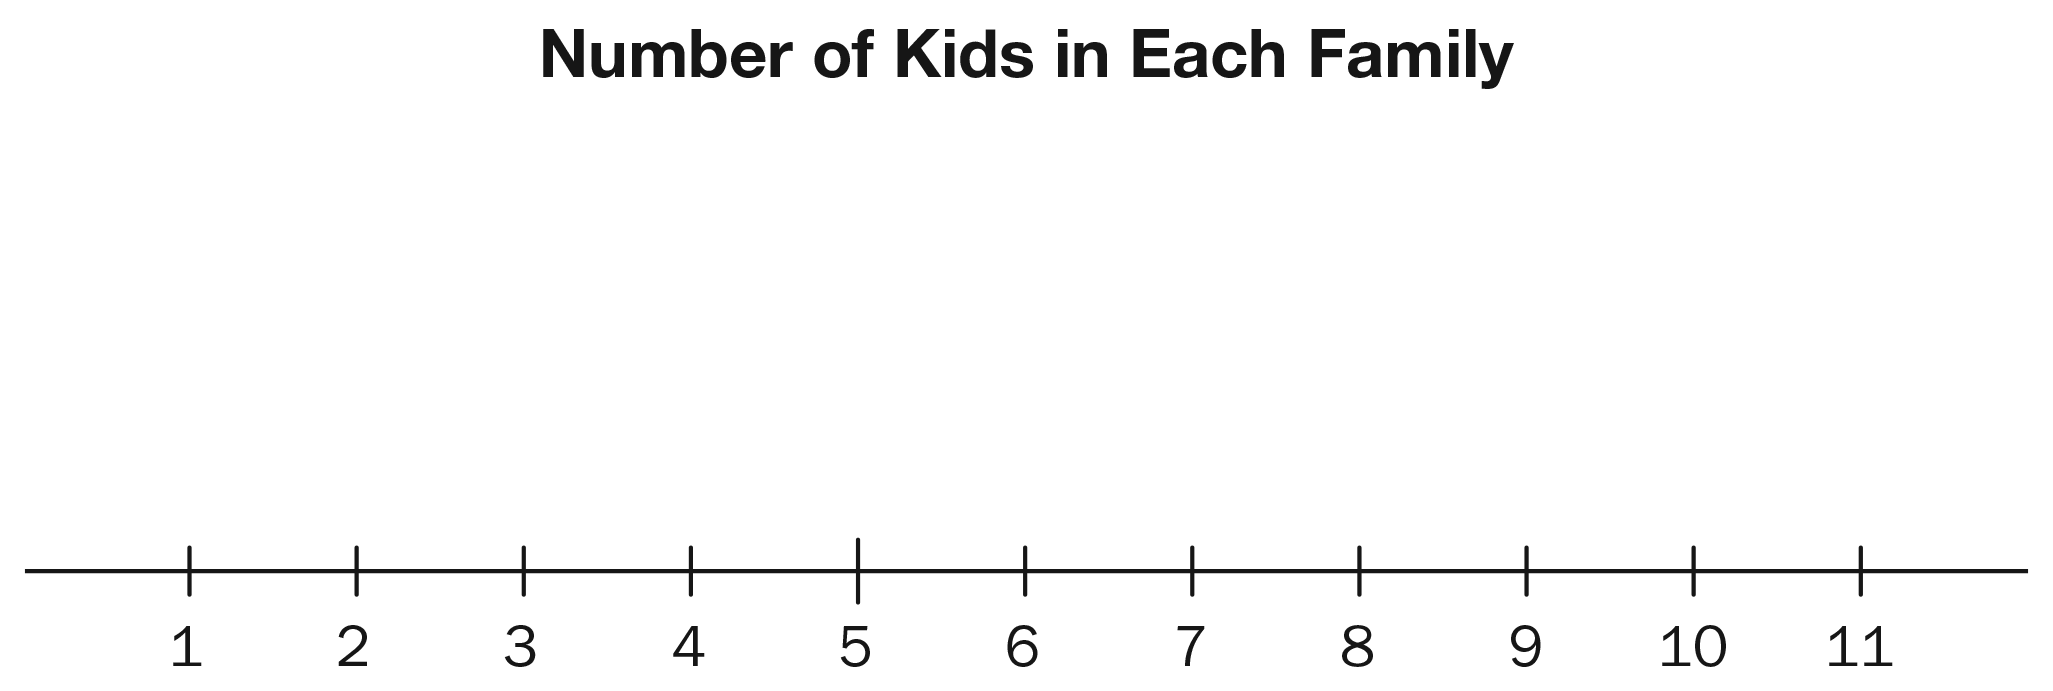
Figure 1: Blank line plot to collect number of kids in each family
Assessment in this Lesson
| ASSESSMENT | EXPECTATION ASSESSED |
|---|---|
|
Comparing Graphs Student Activity Book Pages 787–789 |
|