You may choose to begin the lesson using the class's big question, chosen variable, and data, and then use the Student Guide pages to review terms, formalize procedures, and extend the discussion further. Alternatively, you may begin with the Student Guide pages and use the information and example of Mr. Moreno's book club as a lead-in for the class's data collection activity.
Define Variables. This lesson involves posing questions and then gathering and analyzing data to answer them. Begin by reviewing the activities in Lesson 1. Remind students that in Lesson 1 Blanca gathered data about shoes in the class for a reason.
- What question was Blanca trying to answer? For what purpose? (Blanca was trying to find out what kinds of shoes her classmates were wearing, so she could convince her mother to let her wear flats to school.)
Have students think about questions that they have about the class—things they would like to know more about each other.
- What would you like to know about our class? For what purpose?
Make a list of the students' questions. Narrow the list by asking:
- What questions can be answered with data? (Possible responses: What are our families like? Where do students live?)
- What kind of numerical data can be collected to answer one of these questions? (Possible response: number of brothers, number of sisters, number of family members, number of times I have moved; number of blocks I live from school or number of miles I live from school)
- For what purpose would we gather this information? (Possible response: to get to know one another)
Ask students to discuss in small groups what big question they want to investigate and which numerical variable to study to answer the question.
Then bring the class back together and ask:
- What question is our class trying to answer? For what purpose?
Have the class choose one “big question” to investigate together.
In the discussion that follows, we use a classroom example where the students came up with the big question, “How much does our class like animals?” In this example, the students want to show the teacher how much they like animals so that they can persuade the teacher to get a class pet.
It is important to remind students to distinguish numerical variables, which represent quantities, from categorical variables, which represent qualities. Students may have the misconception that eye color is a numerical variable because you can count the number of students with brown eyes. One general rule of thumb is that numerical variables are graphed using numbers on the horizontal axis, whereas categorical variables are graphed using words on the horizontal axis.
- What numerical variables can we study that will help us answer our question? (Possible responses: the number of pets each student has, the number of times each student has been to the zoo, an estimate of the number of books each student has read about animals, an estimate of the number of television shows about animals each student has watched in the past month)
Even though the class chooses only one variable to be measured, ask why they think it is helpful to investigate more than one variable for a single question.
It is important that the numerical variable you select be well defined. For example, if you choose to collect data on number of pets, you will need to define this variable.
- Does a student who has an aquarium count all the fish in the tank or do fish count as one pet?
- If you collect data on the number of books students have read, how is a book defined?
- Do picture books count or only chapter books?
- Should magazines be included as well?
- How much of a book should students have read in order to count it in their data?
For our example, we will use data about the number of pets as a way to measure how much the class likes animals.
Find the Median and Mode. Each student writes his or her own value for the chosen variable on a self-adhesive note. The students should write their numbers as large as possible with a marker.
Ask five students to say their numbers aloud for the first variable to demonstrate variation in the values from student to student.
- Do you think that we can answer our question knowing these five values? (Possible response: No, we need more data from more students.)
- If we list the number of pets that each student has, will that help us answer the question? (Possible response: Yes, but it won't tell us everything about our big question.)
- How can we find out what is typical or representative for our class?

Average. In everyday language we use average to describe what is normal or typical. In mathematics, the average is a single value that is used to represent a set of numbers. For example, the average grade for a student is one number that is used to represent all of his or her grades. Statisticians call averages measures of central tendency because they are numerical values that tend to lie in some sense in the middle of a data set.
The arithmetic mean is the most commonly used average. If a student spells 18, 19, 10, 14, and 19 words correctly on a series of five spelling tests, the student's mean number correct is (18 + 19 + 10 + 14 + 19) ÷ 5, which equals 16.
The mode is the most common value, so the mode for this set of data is 19. It is possible for data sets to have more than one mode or to have no mode. For example, the data set 4, 9, 6, 7, 4, 9, 3, 5 has two modes (4 and 9) and the data set 4, 9, 8, 5, 2, 7, 3 has no mode.
The median is the number exactly in the middle of the scores. To find the median of an odd number of scores, arrange the scores from smallest to largest and choose the middle number. The median score for the spelling tests (10, 14, 18, 19, 19) is 18 since there are two values smaller than 18 and two values larger than 18. If a student takes an even number of tests, the median is not as obvious since there is not one middle piece of data. If a student earns scores of 10, 14, 18, and 19 on four tests, his or her median score is 16. In this case, we look at the two middle pieces of data (14 and 18) and the median is the number halfway between these two numbers (16). If a student earns scores of 10, 13, 18, and 19 on the four tests, the median score is 15.5, since it is midway between 13 and 18.
These questions lead to a discussion of the average value for a data set. See the Content Note. Advise students that they will learn how to use one number to describe what is typical in a set of numbers.
- What do you think it means if a student says she scores an average of 3 goals per game? (Possible response: She means that she usually or typically scores 3 goals in each game.)
- Could she score 4 or 5 goals in a game and still say she scores an average of 3 goals per game? (yes) Explain your thinking. (Possible response: If she scores an average of 3 goals per game she can still have some games when she scores less than 3 goals or more than 3 goals. The typical score is just three goals.)
Explain to students that they are going to practice finding an average called the median. Illustrate the procedure for finding the median by asking five students to display their self-adhesive notes showing the number of pets they have at home. Ask students to arrange themselves from the least number of pets to the greatest number of pets.
Ask students to identify the value in the middle and tell them that value is called the median value in this data set. It is one value that can represent the entire data set because it is in the middle of all the values.
Then have seven different students come to the front of the class, display their self-adhesive notes and ask:
- Now which value is in the middle? How do you know? (There are three values on each side.)
- What is the median value for of this data set?
As students answer the question, remind them to label their answer and not just give a number. In our example, students might say, “2 pets” instead of “2”.
Demonstrate the procedure again, this time asking six students to display their data.
- Now which student is in the middle? (There are no students in the middle or there are two students in the middle.)
- How do you know? (There are three students on each side with no one in the middle. Or, there are two students on each side and two in the middle.)
Discuss with students that in a data set with an even number of data points, the median is the value in the middle of the two middle points. If the two middle values are the same, then that value is the median of the data set. If the two middle values are different, then the median is the number midway between those two values. For example, if the two middle values are both 3, then 3 is the median for the data set. If the two middle values are 3 and 4, then 31/2 or 3.5 is the median for the data set.
Now ask all of the students in the class to stand. Have the students line up showing their notes with their own data in order from least to greatest. Use the same procedure to find the median value for the whole class.
- Now which number of pets is the middle value? How can we find out?
Students can count off alternating from the ends until the middle student is identified. Draw an arrow on a self-adhesive note and attach it to the median value.
If there is an even number of students, ask:
- What number is the median?
Have one of the two middle students hold the arrow between them to show that the median lies between the two.
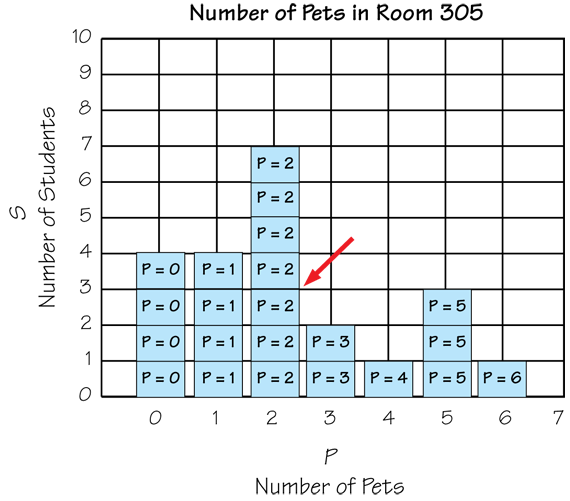
Draw the axes for a bar graph on a large piece of square-inch grid paper, a laminated wall chart, or a display. Ask students to help you write a title and the labels for the horizontal axis. This should be labeled with all the possible values for your numerical variable. Scale the vertical axis by numbering grid lines that are the same height as the self-adhesive notes. Figure 1 shows a bar graph for the variable Number of Pets.
Starting with the student holding the smallest value and proceeding in order, have students post their notes in the appropriate columns to create a bar graph of the data. Post the arrow indicating the location of the median on the appropriate place on the graph. Ask students to identify the median value of the data set and find it on the graph.
- How can you describe where the median is? (Possible response using the sample data in Figure 1: It is in the middle of the tallest bar.)
- Does it look like it is in the middle of the data? Why or why not? (There are more bars on the right side but all those bars are smaller than the bars on the left. We know it is in the middle because we put the numbers up in order from smallest to largest, so the arrow points to the number in the middle of all the numbers.)
- Does it surprise you where the arrow ended up? Why or why not?
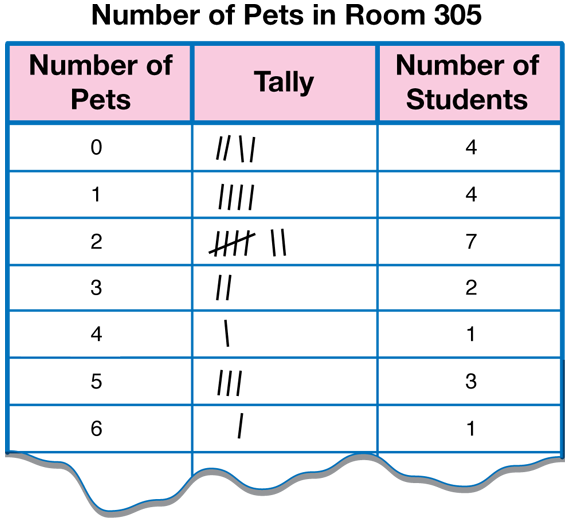
Collect Frequency Data in a Table. Draw a three-column data table on the board, on chart paper, or on a display with your class's values in the left column as shown in Figure 2. For each value, ask how many students had that value. Ask for a show of hands. For each student, mark a tally on the table.
For example, if 7 students had 2 pets, ask:
- How many students had the value of 2 for the Number of Pets variable? (7 students)
- How many self-adhesive notes were put on the graph above the 2? (7 notes)
- How many tallies are in the data table? (7 tallies)
Mark an arrow pointing to the tally mark that is the median.
Ask students to compare the table with the graph they made with self-adhesive notes.
- How are the two representations alike? Different? (Possible response: They both show the same data. The tallies are like the bars, more tallies mean longer bars. They are different because in the table, the numbers are in the columns and on the graph they are on the axes.)
- Which value is the most common (the mode)? How do you know? (The mode is 2 pets because the largest bar is for 2 pets.)
- How many students have that number of pets? (7 students)
- Show me where to find that number of students on the graph. (Look at the tallest bar and see how far up it goes and look at the vertical axes to find the number of students.)
- Which representation do you find easier to read? Why?
- Which representation, the graph or data table, makes it easier to find the mode? The median? Why do you think so?