


Searching the Forest
Est. Class Sessions: 4Developing the Lesson
Part 3: Searching the Forest Lab
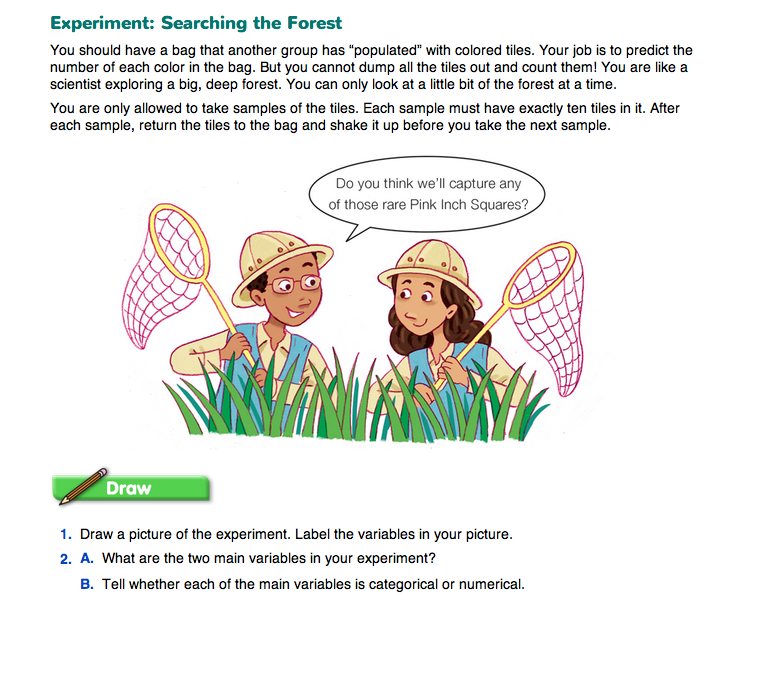
Identify Variables and Draw a Picture. Begin the experiment by distributing a “populated” bag to each group, reminding students not to look into their bags. Make sure each group receives a different bag than the one they populated. Ask students to read the short vignette that is found on the Experiment: Searching the Forest section in the Student Guide.

Tell the groups that their task is to determine what recipe was used to fill their bag without looking into the bag or counting all of the tiles.
Use these or similar prompts to start a discussion comparing their task with Betty's task in the story “A Matter of Survival.”
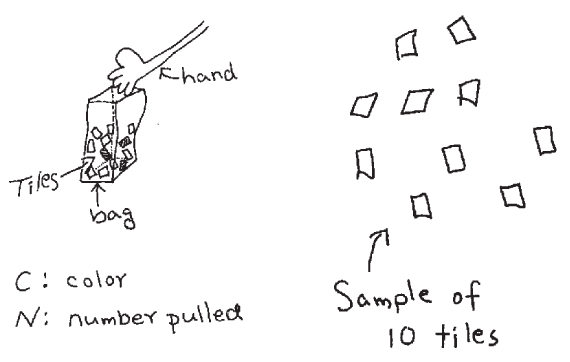
Students will pull samples of ten tiles from a bag and use their data to make predictions about the populations of tiles in the bag. The Experiment: Searching the Forest section in the Student Guide leads students through the four phases of the TIMS Laboratory Method for this lab.

Question 1 asks students to draw a picture to illustrate the procedure and to identify the key variables in the experiment. This is the first step in the TIMS Laboratory Method.
Before students begin their picture, ask:
Each student should complete his or her own picture and complete Question 2 independently. However, once they are finished, encourage students to share their completed work with the students in their group and revise as needed. Figure 1 shows a sample picture for this lab.
Collect and Organize Data. The next step in the TIMS Laboratory Method is the collection of data. In Question 3, students are directed to take three samples with ten tiles in each sample. Each time, they sort the tiles by color and record the number of each color using the data table on the Searching the Forest Lab pages in the Student Activity Book. Though students are working in a small group to collect their data, each student should complete his or her own data table. After each sample, all tiles should be returned to the bag and mixed thoroughly. In Question 4, students are asked to explain why they shake the bag between each sample. This will ensure that the sampling is “fair” and that conclusions about the contents of the bag are unbiased.
As students are working, circulate and engage individual groups in conversations about the process of the lab. Ask them to think about what a particular sample may mean for the total numbers.
Use the following prompts:
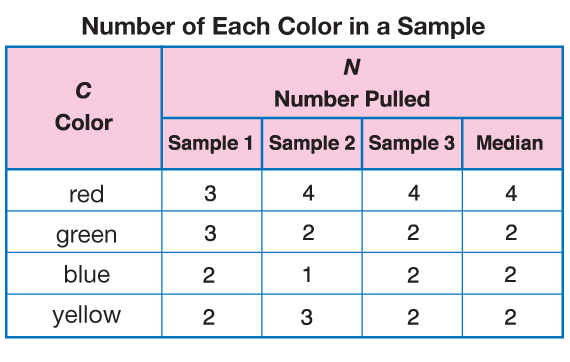
After students finish the sampling, they find the median number of tiles pulled for each color in Question 5. Figure 2 shows typical data.
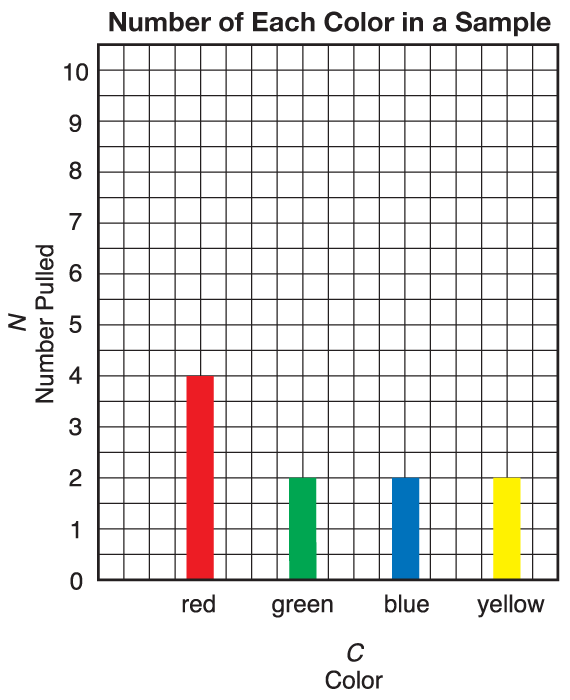
Graph the Data. In Questions 6, each student will use centimeter graph paper to make a bar graph of the data. Before they begin, ask each group to discuss what should be included on a graph.
These discussion prompts can be used to help facilitate this discussion.
Figure 3 shows an example of a bar graph based on the data in Figure 2. The median number of tiles pulled determines the height of each bar.
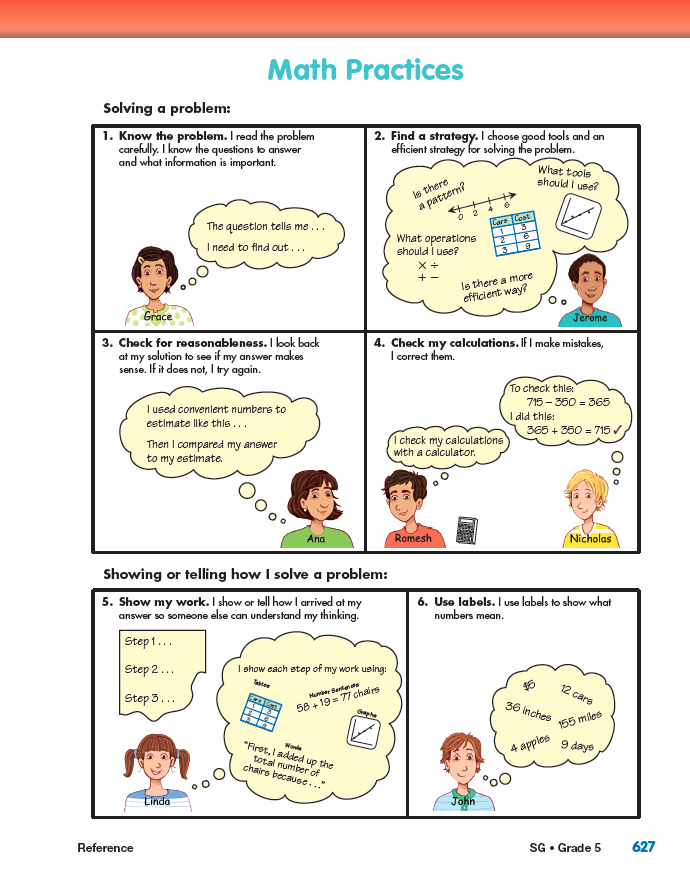
Analyze the Data. The last step in the TIMS Laboratory Method is the analysis of the data. Questions 7–13 guide students through this analysis. You may choose to have students answer these questions independently; however, encourage them to check their thinking with their other group members as they work. Before students begin, direct them to the Math Practices page in the Student Guide Reference section. Explain that students will be focusing on Math Practices 1, 2, and 5 as they work on these questions.
After each group has read through these three math practices, ask:
Questions 7–8 require literal comprehension of the data. The answers can be found simply by examining the data table or the graph. Since the answers can be found in more than one way, these questions present an opportunity to emphasize that there are usually many ways to solve a problem, although all correct solution methods should yield the same answer. You might contrast this agreement with the case of answers based on different data: Group 1's answers based on their data may not agree with Group 2's answers based on their data, but both groups might still be correct.
Questions 9–12 are the heart of the lab. Students predict the number of tiles of each color in their bags using the data they collected. Students will use different strategies to extrapolate from their data to the total number for each color. This lab does not present a trivial problem and can provide the basis for creative and deep mathematical thinking.
Encourage groups to discuss among themselves how they will use their data to make their estimates. You may want to allow them to try out different combinations and ask you to check with the recipe and tell them whether they are right or not. Then, if they are wrong, they can go back to the problem and continue to analyze it. Discourage groups from guessing quickly, then counting the numbers in the bag. Once the actual numbers in the bag are known, the opportunity is past for deep reasoning about the mathematics involved.
Some possible strategies are discussed here. There is also a discussion of difficulties that arise when the data collected from the sampling does not fit neatly into the scheme of multiples of ten. Be sure to allow students ample time to think about and discuss what their data may mean in terms of the total numbers.
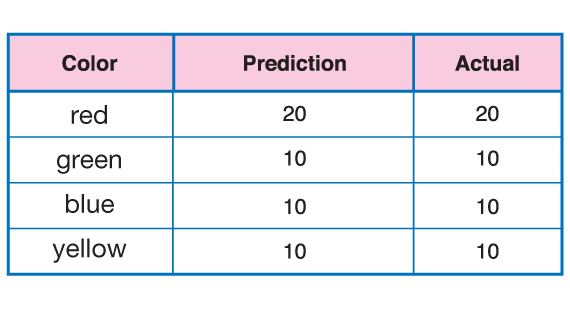
Some students may use a concrete approach such as using actual tiles to make five copies of the median sample. This will usually yield 50 tiles, thus satisfying one of the constraints on the population of tiles in the bag. Next, the requirement that the number of each color be a multiple of 10 can be met by trading tiles of one color for tiles of another. The resulting set of tiles is the prediction for the contents of the bag. A more abstract way to solve the problem is to multiply the medians by five.
When students have recorded their predictions, they open the bag and count the tiles to check their predictions. A table of predictions based on the data in Figures 2 and 3 is shown in Figure 4.
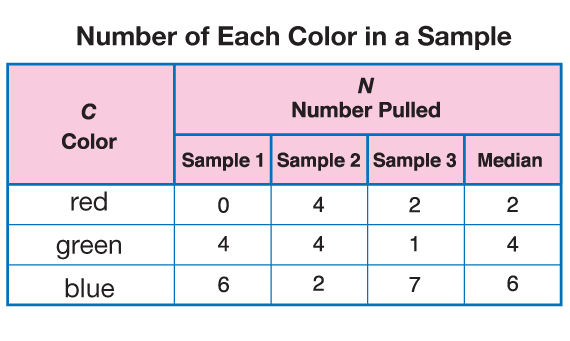
In certain cases, however, the reasoning required in Question 9 can be quite involved. The problem can be especially hard if the sum of the medians is not 10 or if some medians are odd. For example, consider the data in Figure 5.
The median sample there is two red, four green, and six blue tiles. In this case, the sum of the medians is 12, so that multiplying by five yields 60 tiles—but there are only 50 tiles in the bag, so this simple method fails. One way to solve the problem is to think it through logically. Since there are so many blue tiles in the median sample, we can assume there are at least 20 blues in the bag. There could also be 30 blues in the bag, but 40 would be too many, since there are two other colors in the bag.
So there are two cases to consider: 20 blues in the bag and 30 blues in the bag. Case 1: If there are 20 blues, then the other 30 tiles must be shared by red and green. Based on the medians for these colors (2 red and 4 green), 10 red and 20 green is more reasonable than 20 red and 10 green. In this case, the best prediction for the contents is 10 red, 20 green, and 20 blue. Case 2: If there were 30 blue tiles in the bag, then there would have to be 10 each of red and green, since both red and green appear in the samples. The prediction for the contents of the bag in this case is 10 red, 10 green, and 30 blue.
Similar reasoning is required if some of the medians are odd, since multiplying odd numbers by 5 yields numbers that are not multiples of 10. But this contradicts the requirement that the number of each color tile in the bag be a multiple of 10. So, in these cases also, students will need to use mathematical reasoning to make their predictions. In these less straight-forward situations, allowing students to make more than one prediction is advisable, as long as reasons are given for each prediction.
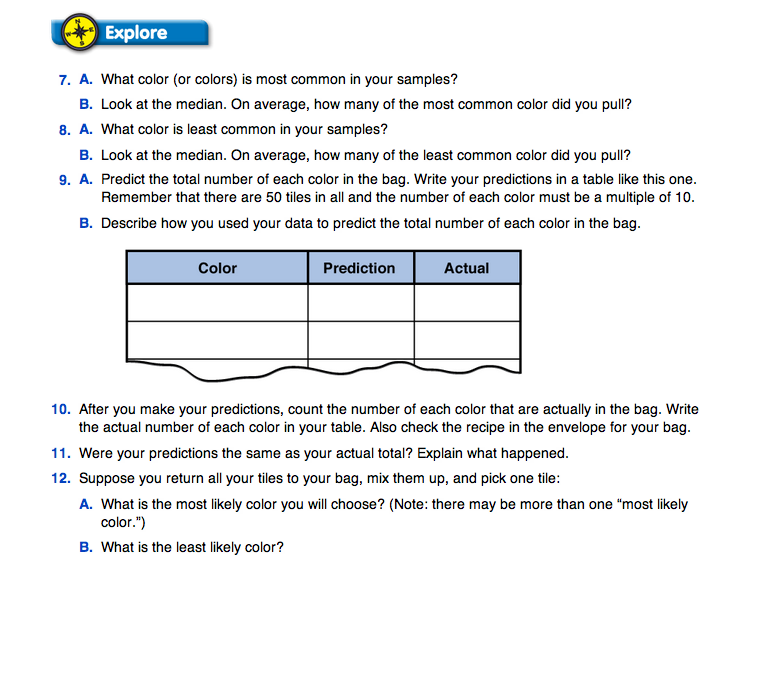
Question 12 asks students to predict the most likely and least likely outcomes for picking one tile from their bags, basing their predictions on the total configurations of colors.
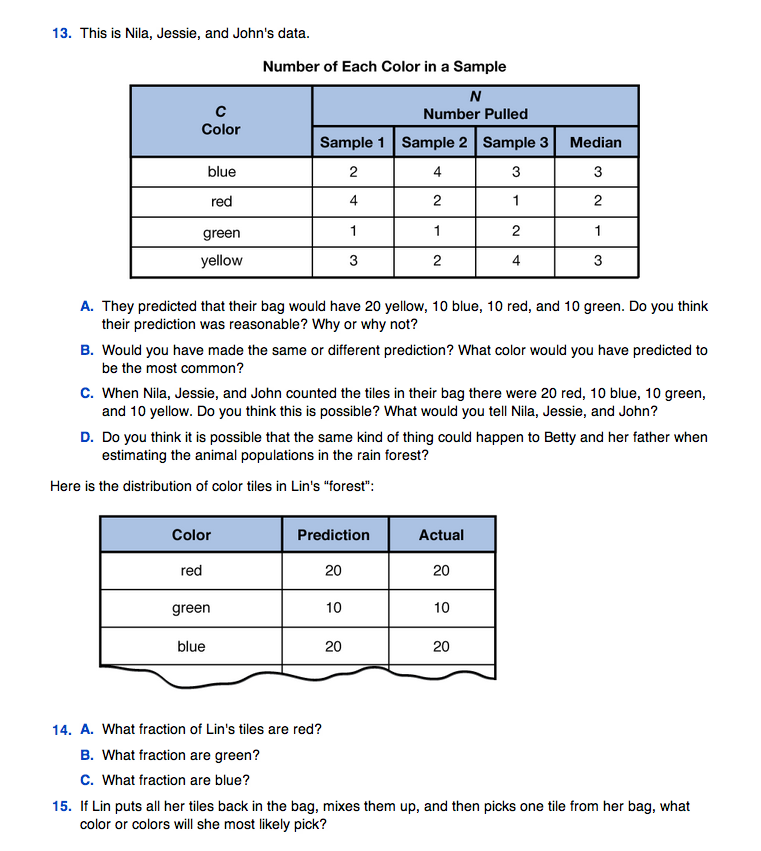
Question 13 presents a scenario in which the students collected and analyzed their data appropriately and made reasonable predictions based on their data, but their predictions were incorrect because their samples were not representative of the actual numbers in the bag. Ask students whether this is something that could happen using samples to predict totals. Discuss the fact that it is possible for a random sample to be skewed and therefore lead to flawed estimates and predictions. It is to avert such errors that several samples are taken. A sampling technique is a useful tool for scientists, but it is not foolproof.
Have students share their strategies and solution paths with the rest of the class. Ask questions about why they chose a particular strategy or rationale. Have students describe strategies that worked and those that did not. Encourage other students to ask questions or comment on the reasonableness of particular strategies. Students may say they just “guessed” the totals, but may in fact have used interesting reasoning to decide upon their “guesses.”
Follow up with questions like:
Questions 14–15 review fractions using the context of the lab.