After students have completed Questions 1–9 on the Analyzing Data pages of the Student Guide, ask:
- How can finding the median or mode help you better understand and use data? (Possible response: The median and mode can help you tell what is typical when you have several data points to describe the same thing.)
- What is the difference between the median and the mode? (Possible response: The median tells you the number that is in the middle of all the data points and the mode tells you the data point that occurs most frequently in the data.)
- How can you decide whether the median or the mode better represents the data? (Possible response: You need to look at all the data to decide which one is better.)
Direct students to the Problem Solve with Data pages in the Student Activity Book. Explain that students will complete Check-In: Questions 1–4 independently to demonstrate how well they understand and can use data to solve problems. Before students begin their work, direct them to the Math Practices page in the Student Guide Reference section or to the display of the Math Practices page. Ask students to read Math Practices Expectations 1 and 5 carefully and to think about how these two practices can help guide their work.
After students have had a minute or two to read and to think about these practices, ask them to turn to a partner and discuss each practice before asking:
- What do you have to think about as you are reading each problem? What words do you need to be mindful of? (Possible response: You need to make sure you understand if a question is asking for the median or the mode, so you find the correct one. You need to be careful that you do not miss any of the numbers that are listed in a data set when you are finding the median or mode.)
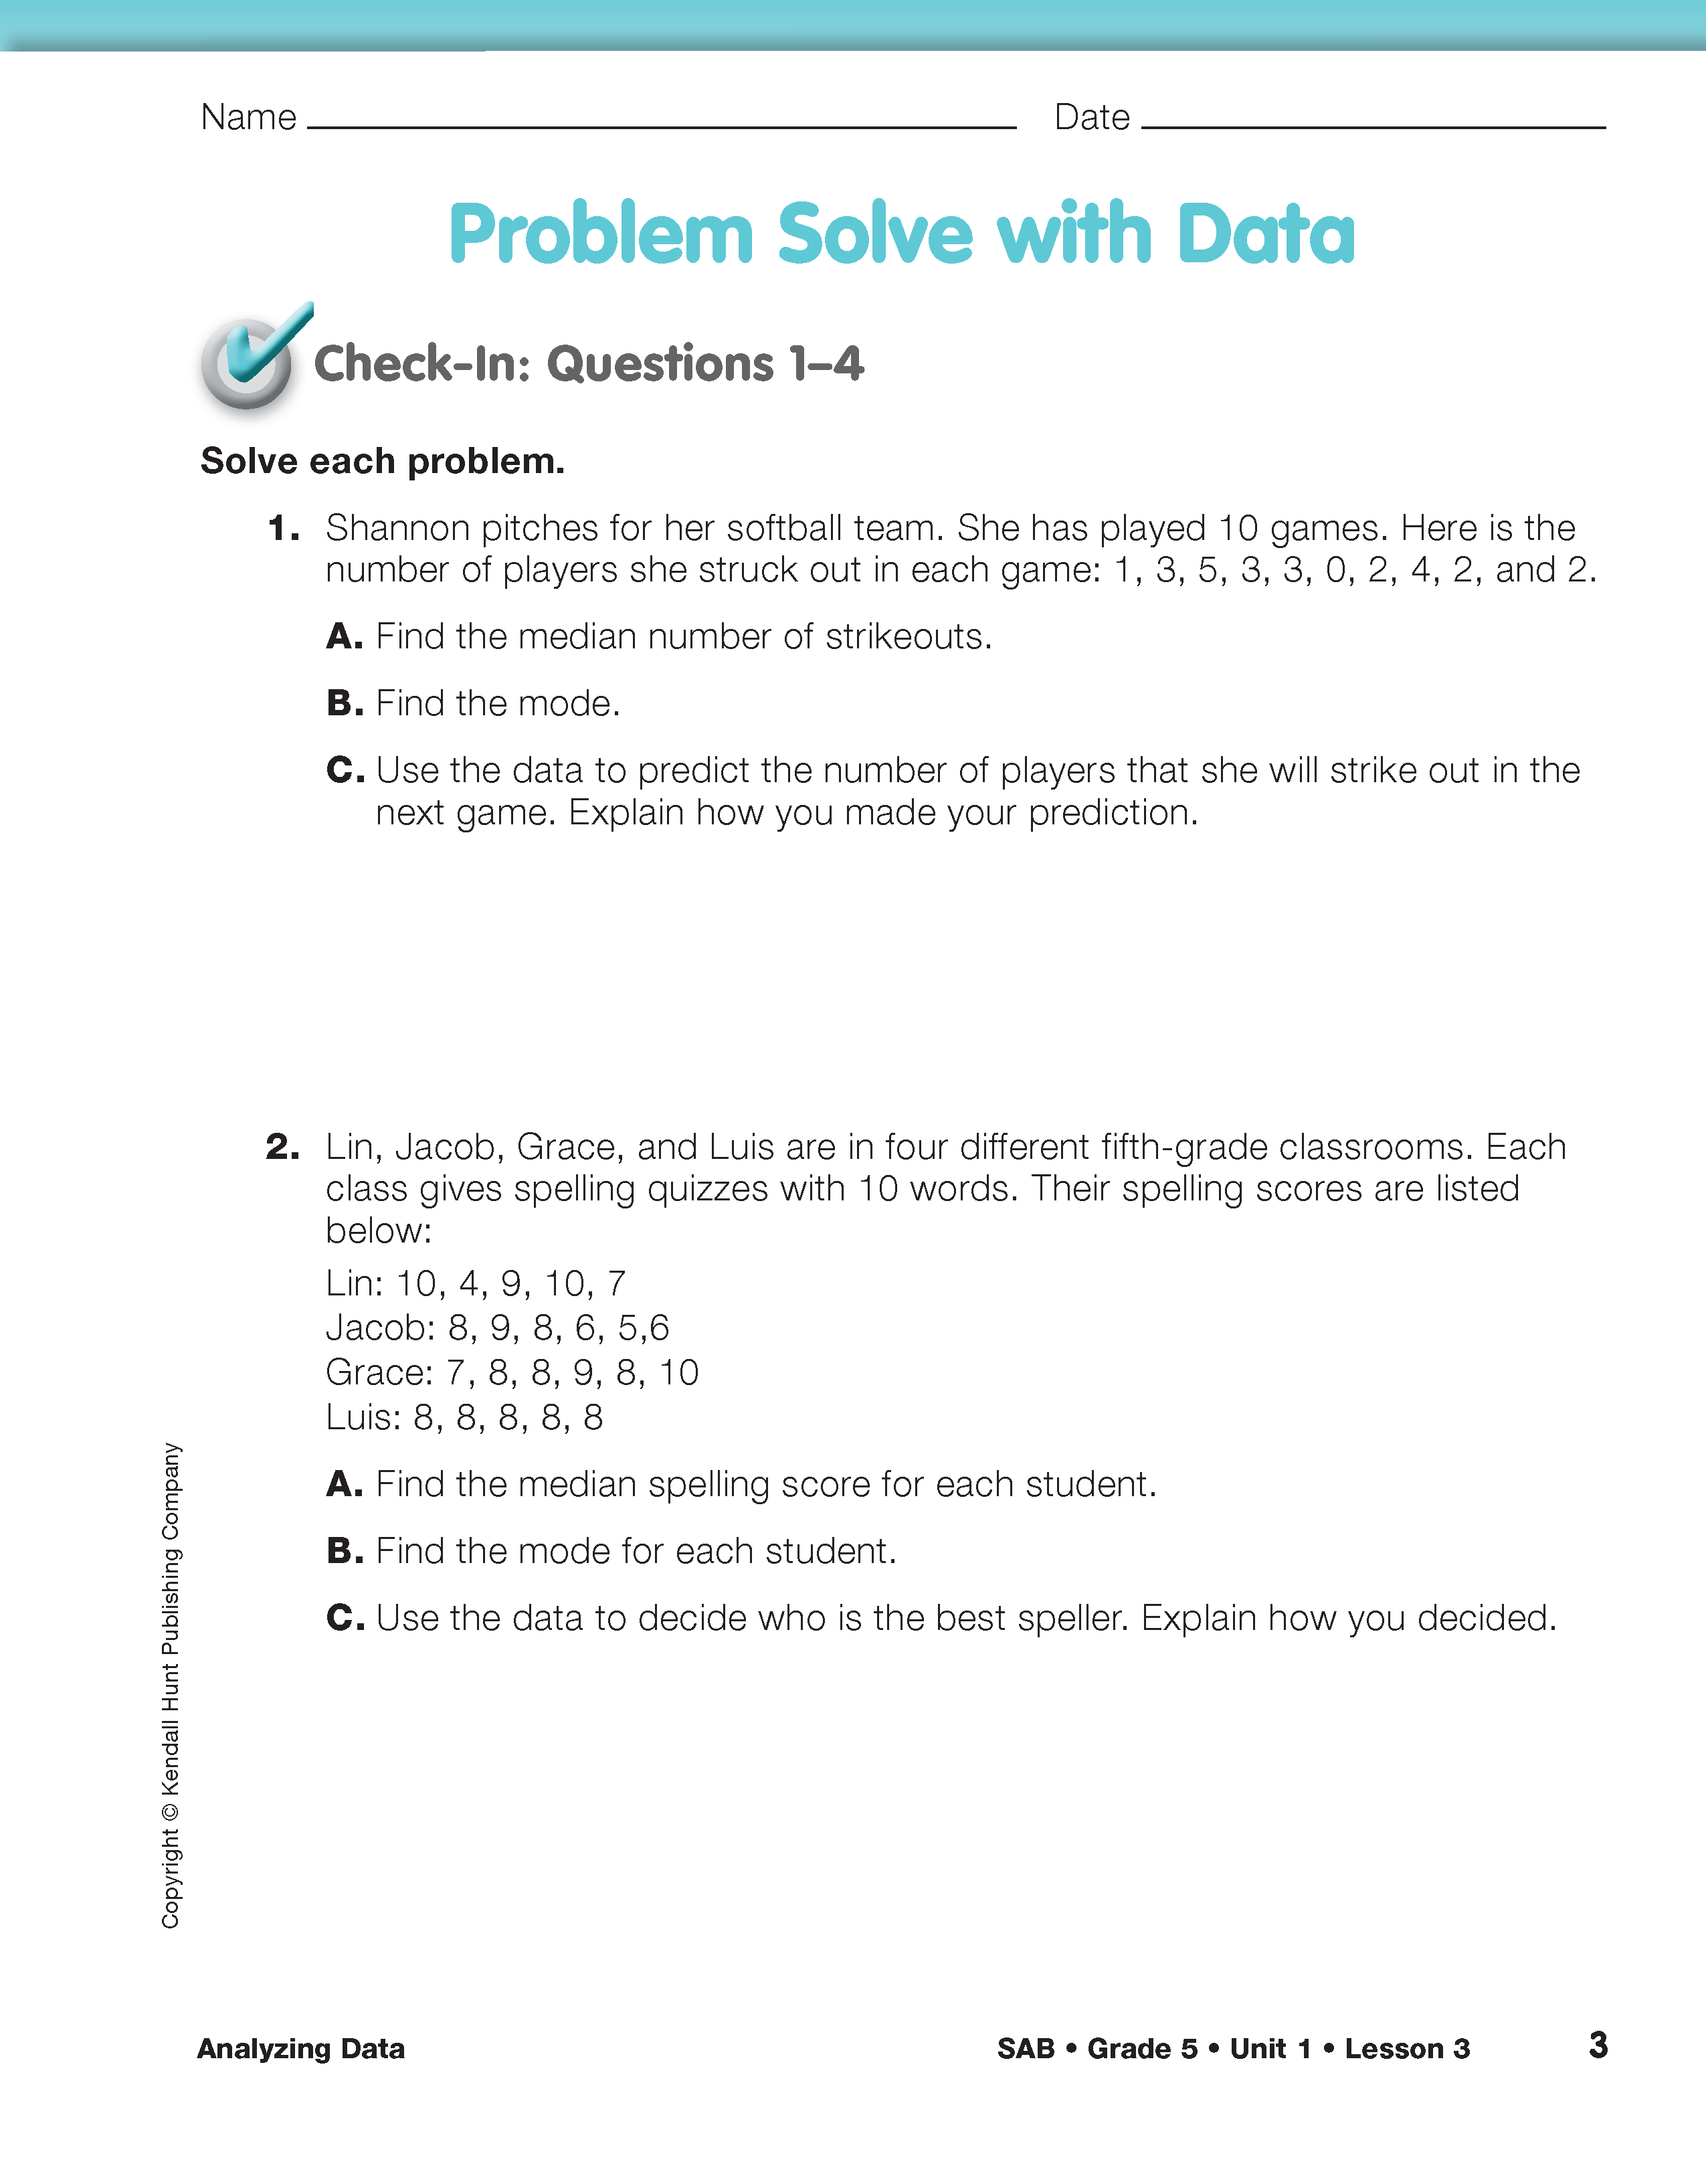
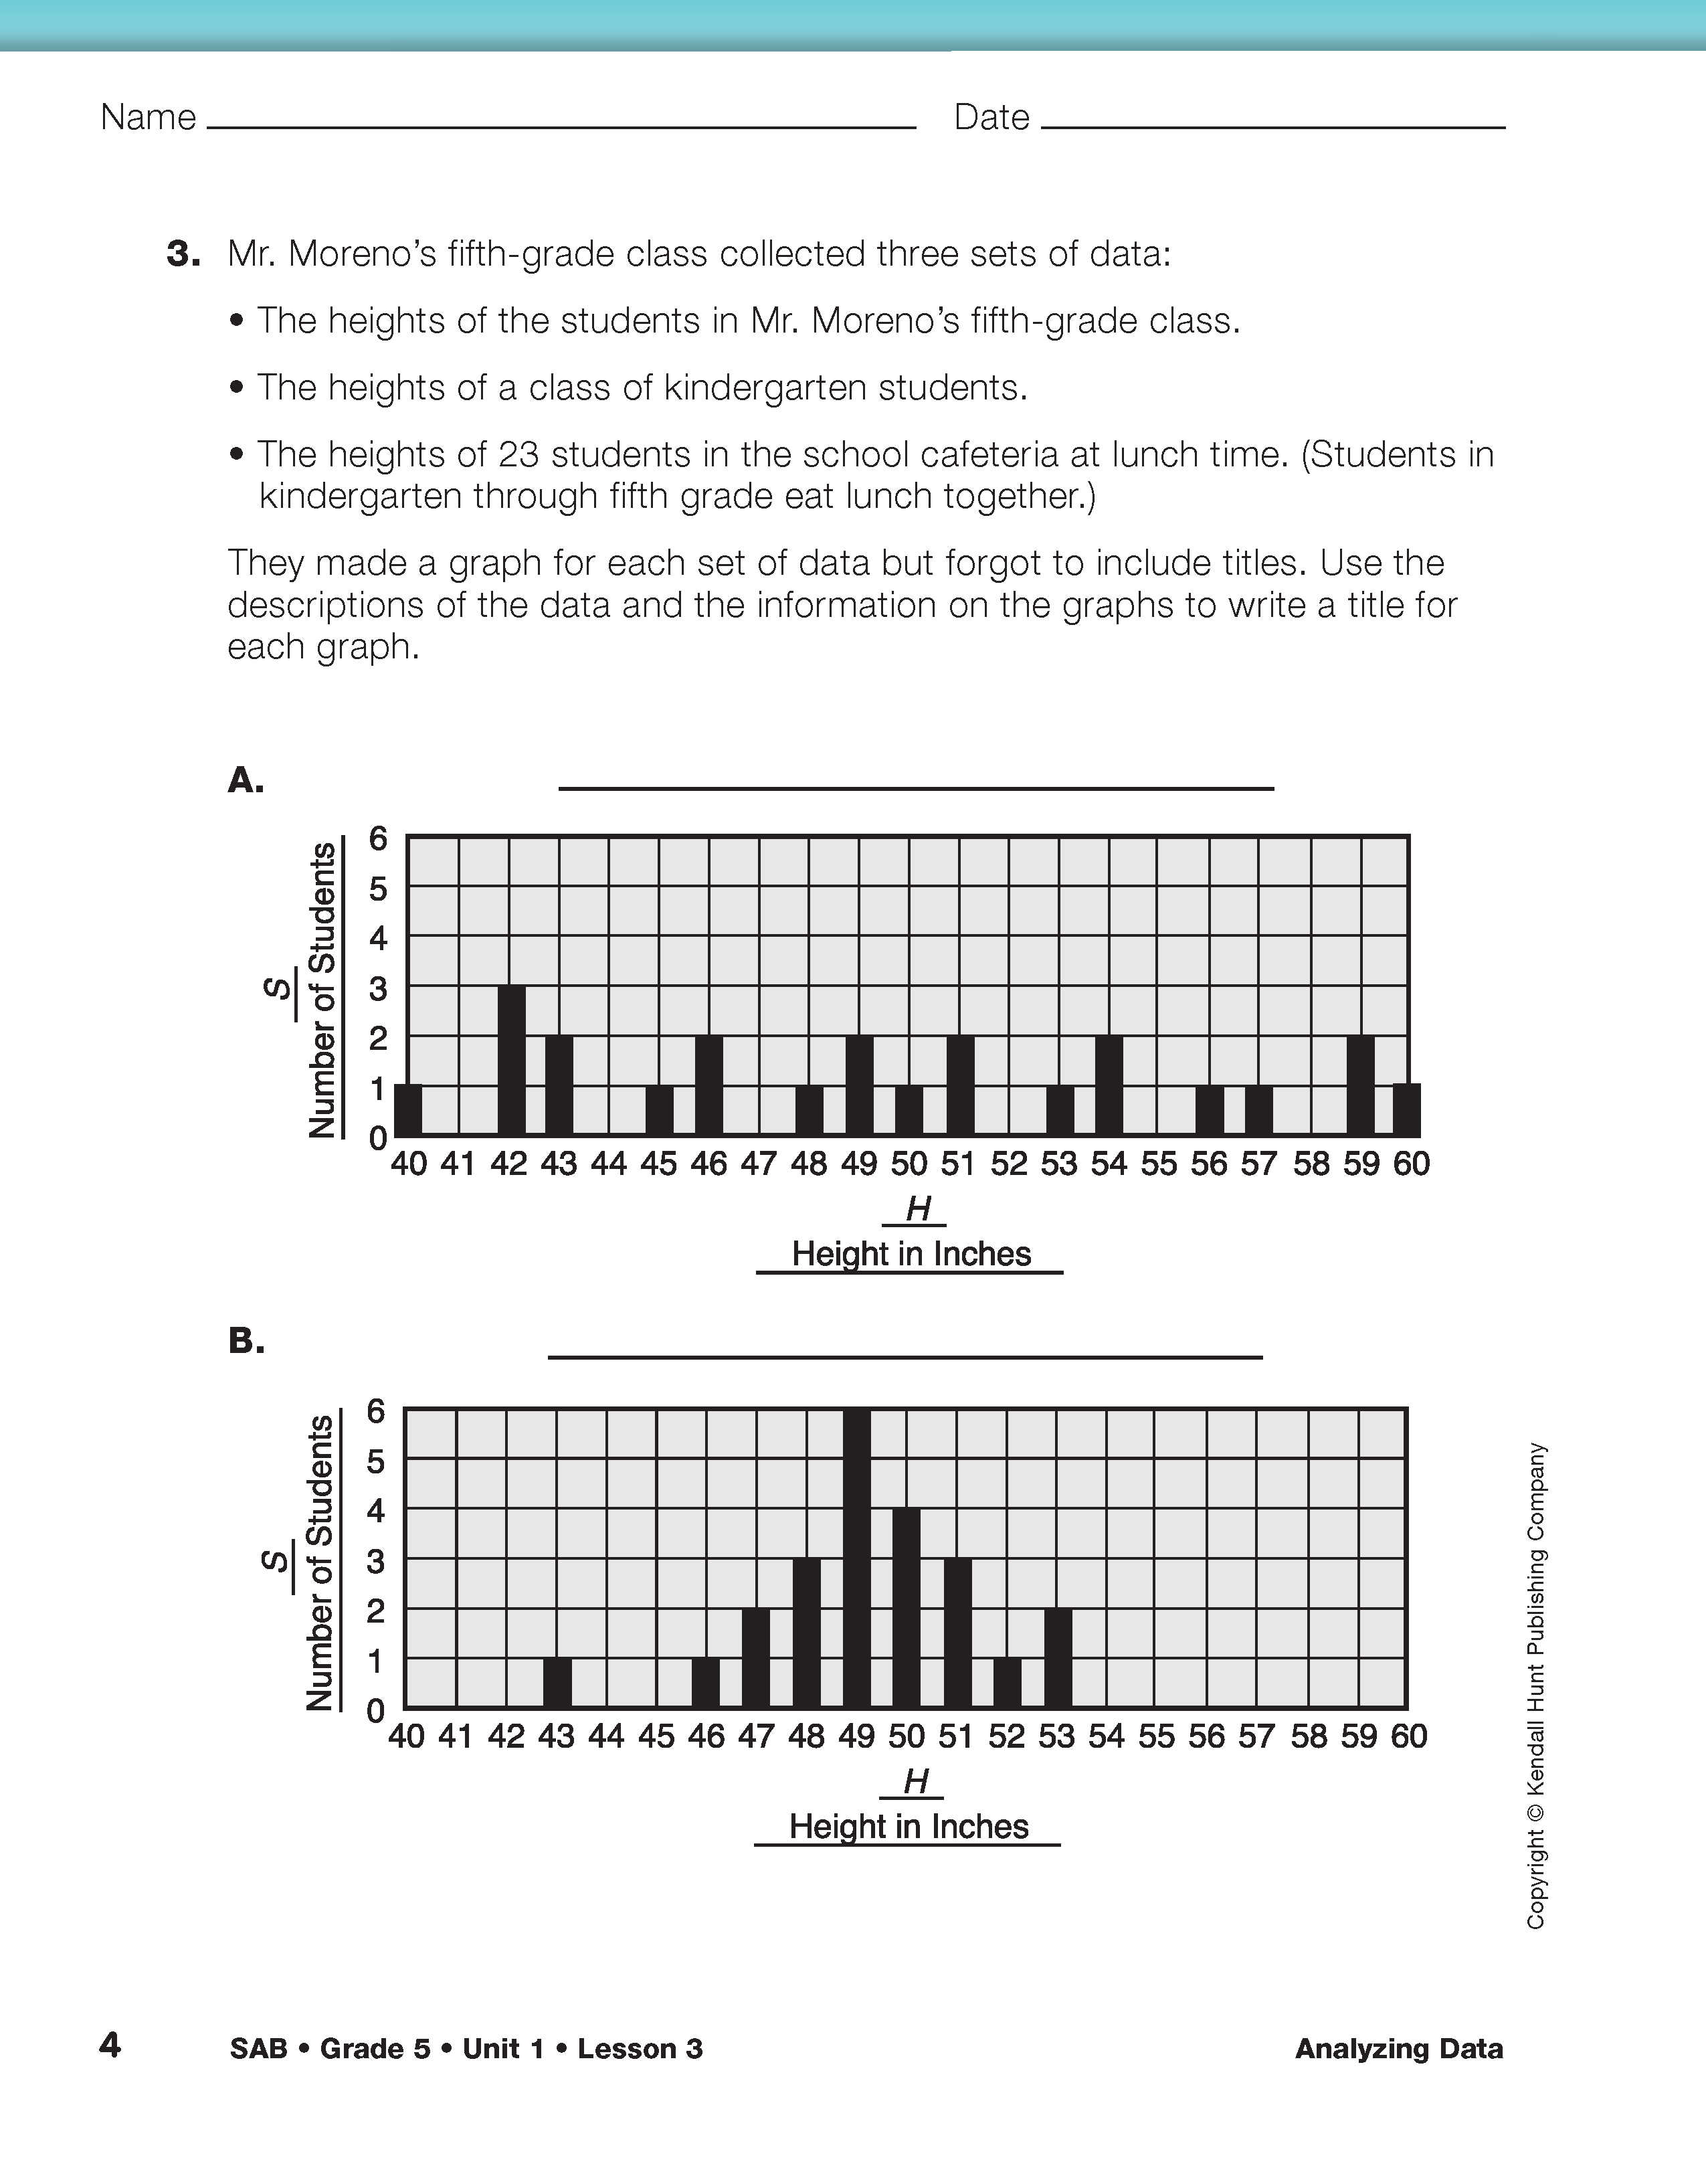
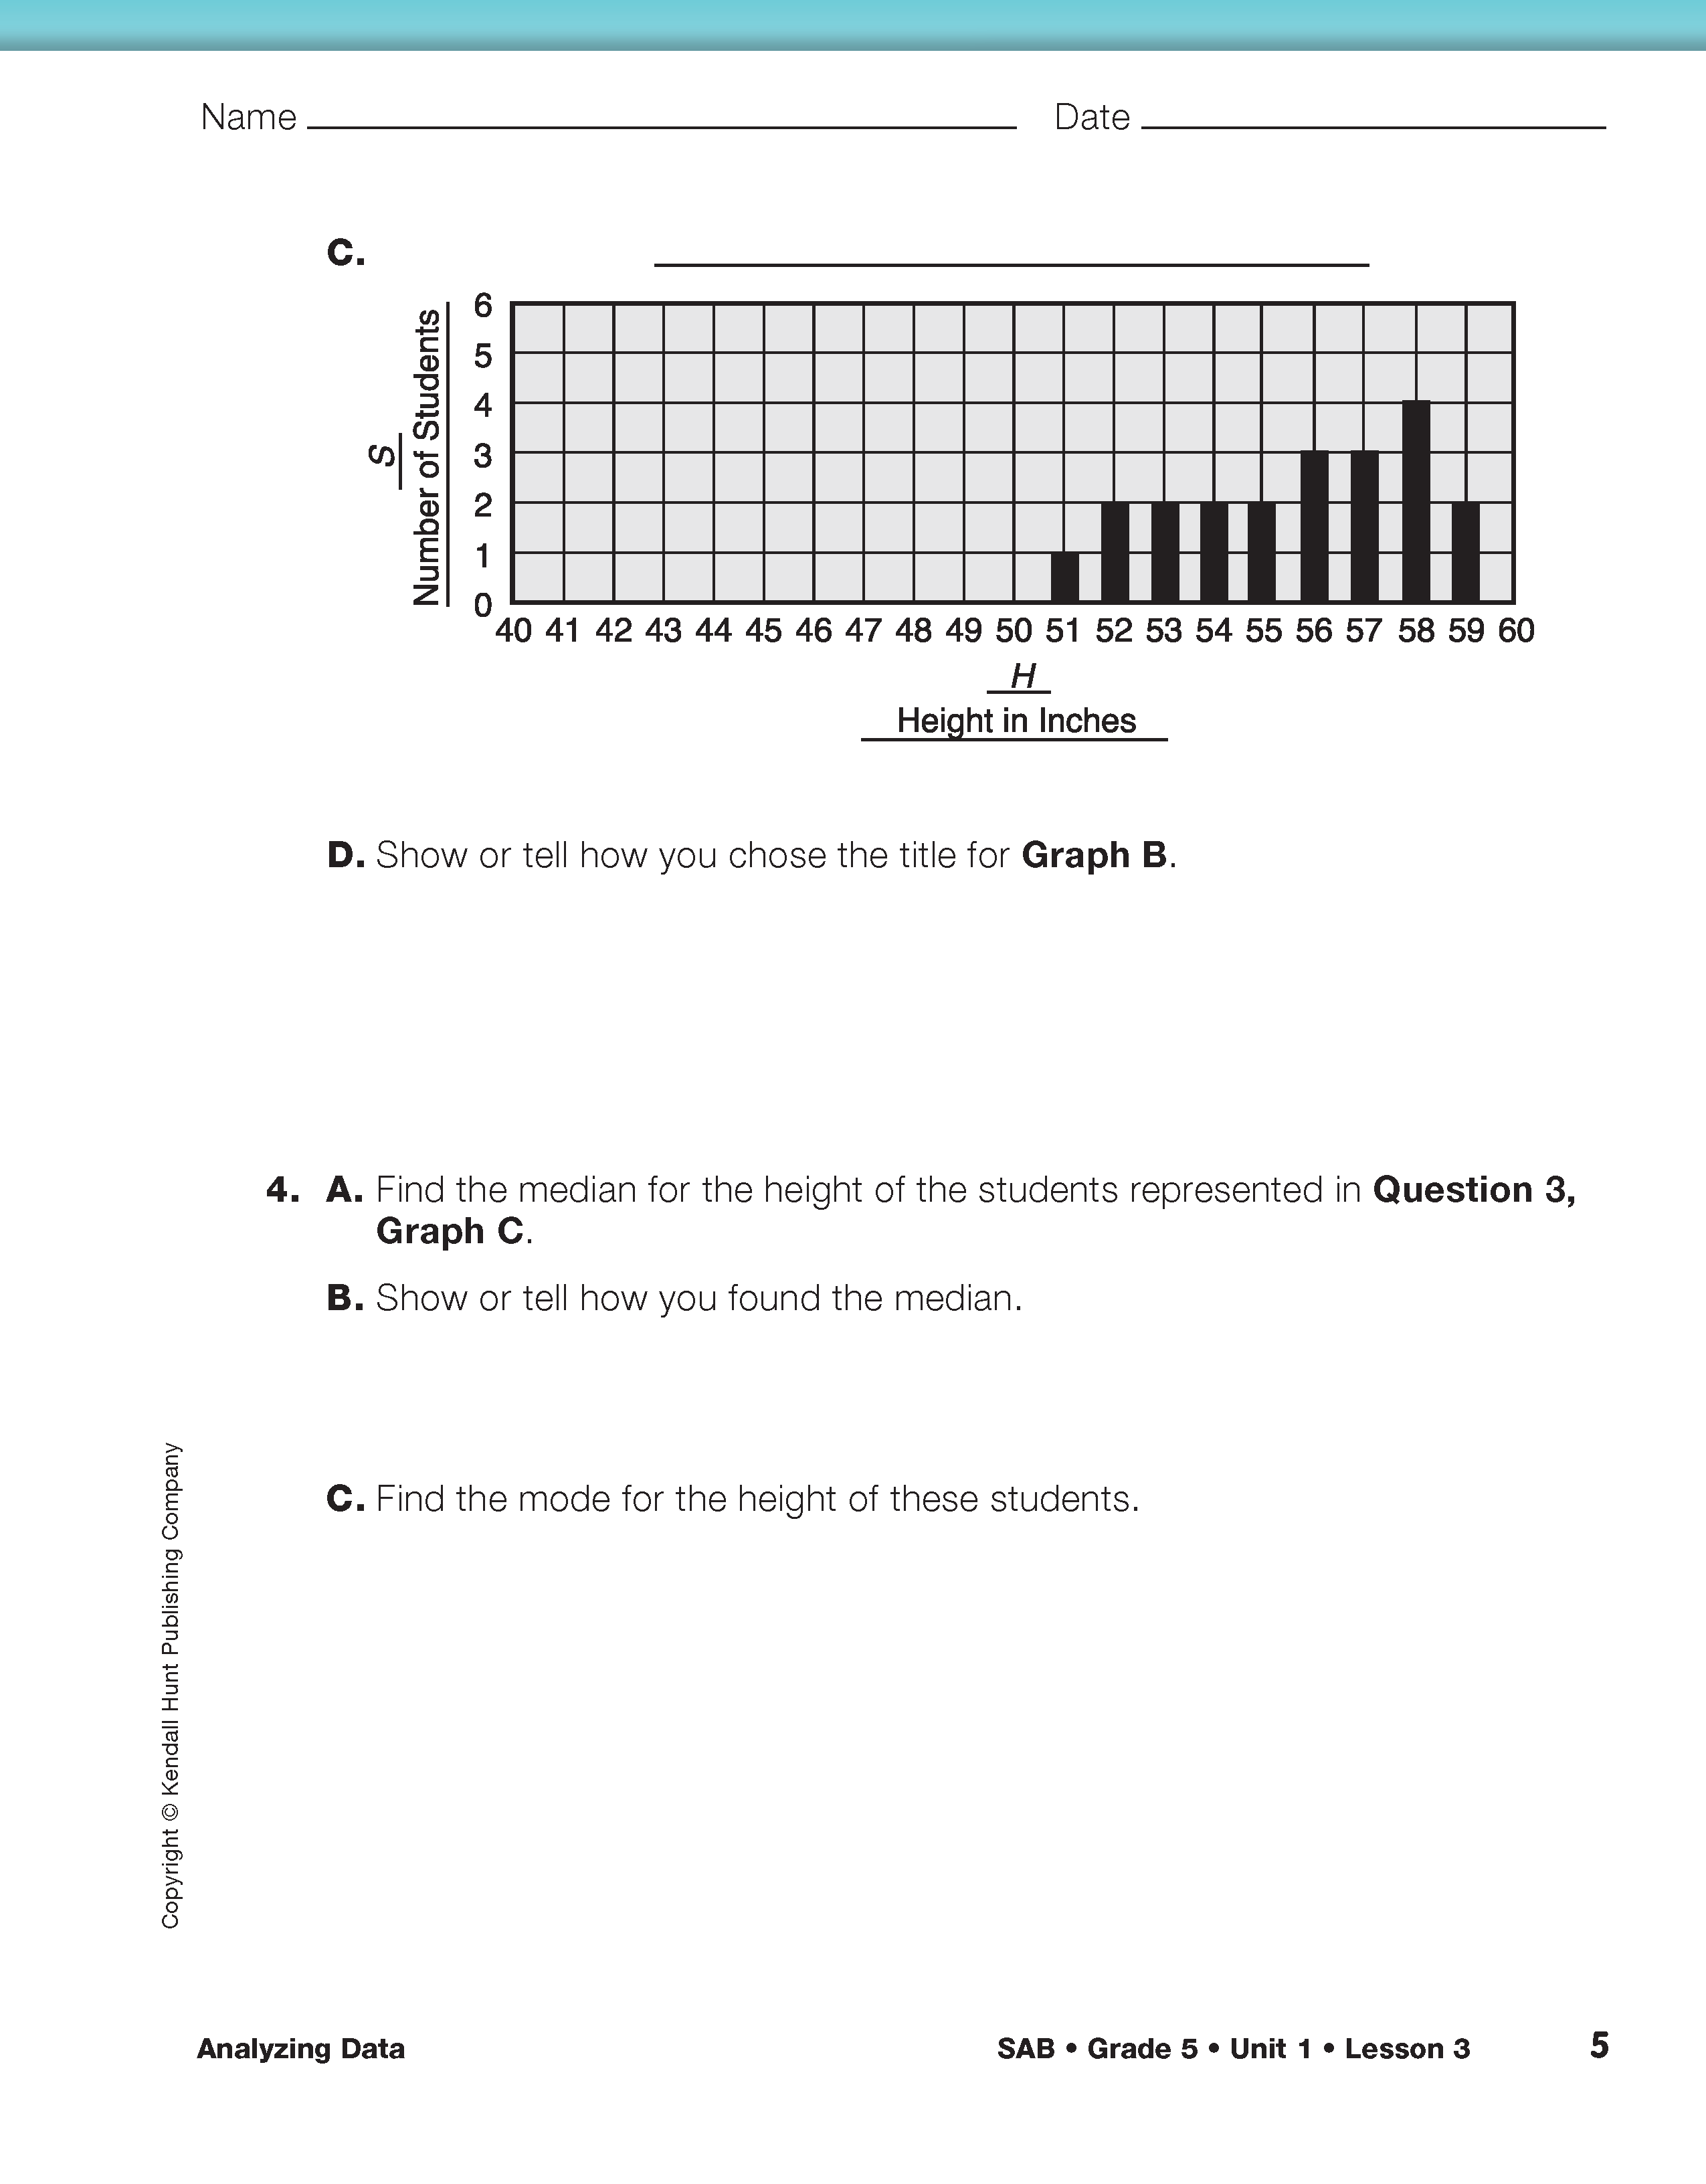
- What do you have to think about when you are reading a graph to solve a problem? (Possible response: When you are using a graph you need to read the labels for each variable carefully so you know what the graph is representing. You need to make sure you understand the way each axis is scaled and what the numbers represent.)
- When you are asked to show or tell how you found an answer, what should you include in your answer? (Possible response: You need to make sure you tell what steps you took to find your answer. You need to label your numbers so others will know what they mean.)
- If you are asked to explain how you made a predication or to justify your thinking, what should you include? (Possible response: You need to give good reasons for your answer and support your thinking by using numbers or words from the problem.)
Assign Check-In: Questions 1–4. After students have completed their work, use the feedback boxes to assess their work. You may choose to have students revise their work based on your feedback.

Use Check-In: Questions 1–4 with the Feedback Box on the Problem Solve with Data pages in the Student Activity Book to assess students' abilities to find the median of a data set [E5]; find the mode of a data set [E6]; read a graph to find information [E7]; make predications or generalizations about a data set using a median and mode [E9]; know the problem [MPE1]; and show work [MPE5].
Compare Populations Targeted Practice. Choose a numerical variable to study from the table of variables and values the class generated in Lessons 1 and 2. Collect and graph data from three different populations. For example, one population can be larger than the other two and one population can be younger or older. Compare and analyze the graphs from the three populations using the discussion prompts in Part 1 of Lesson 3.