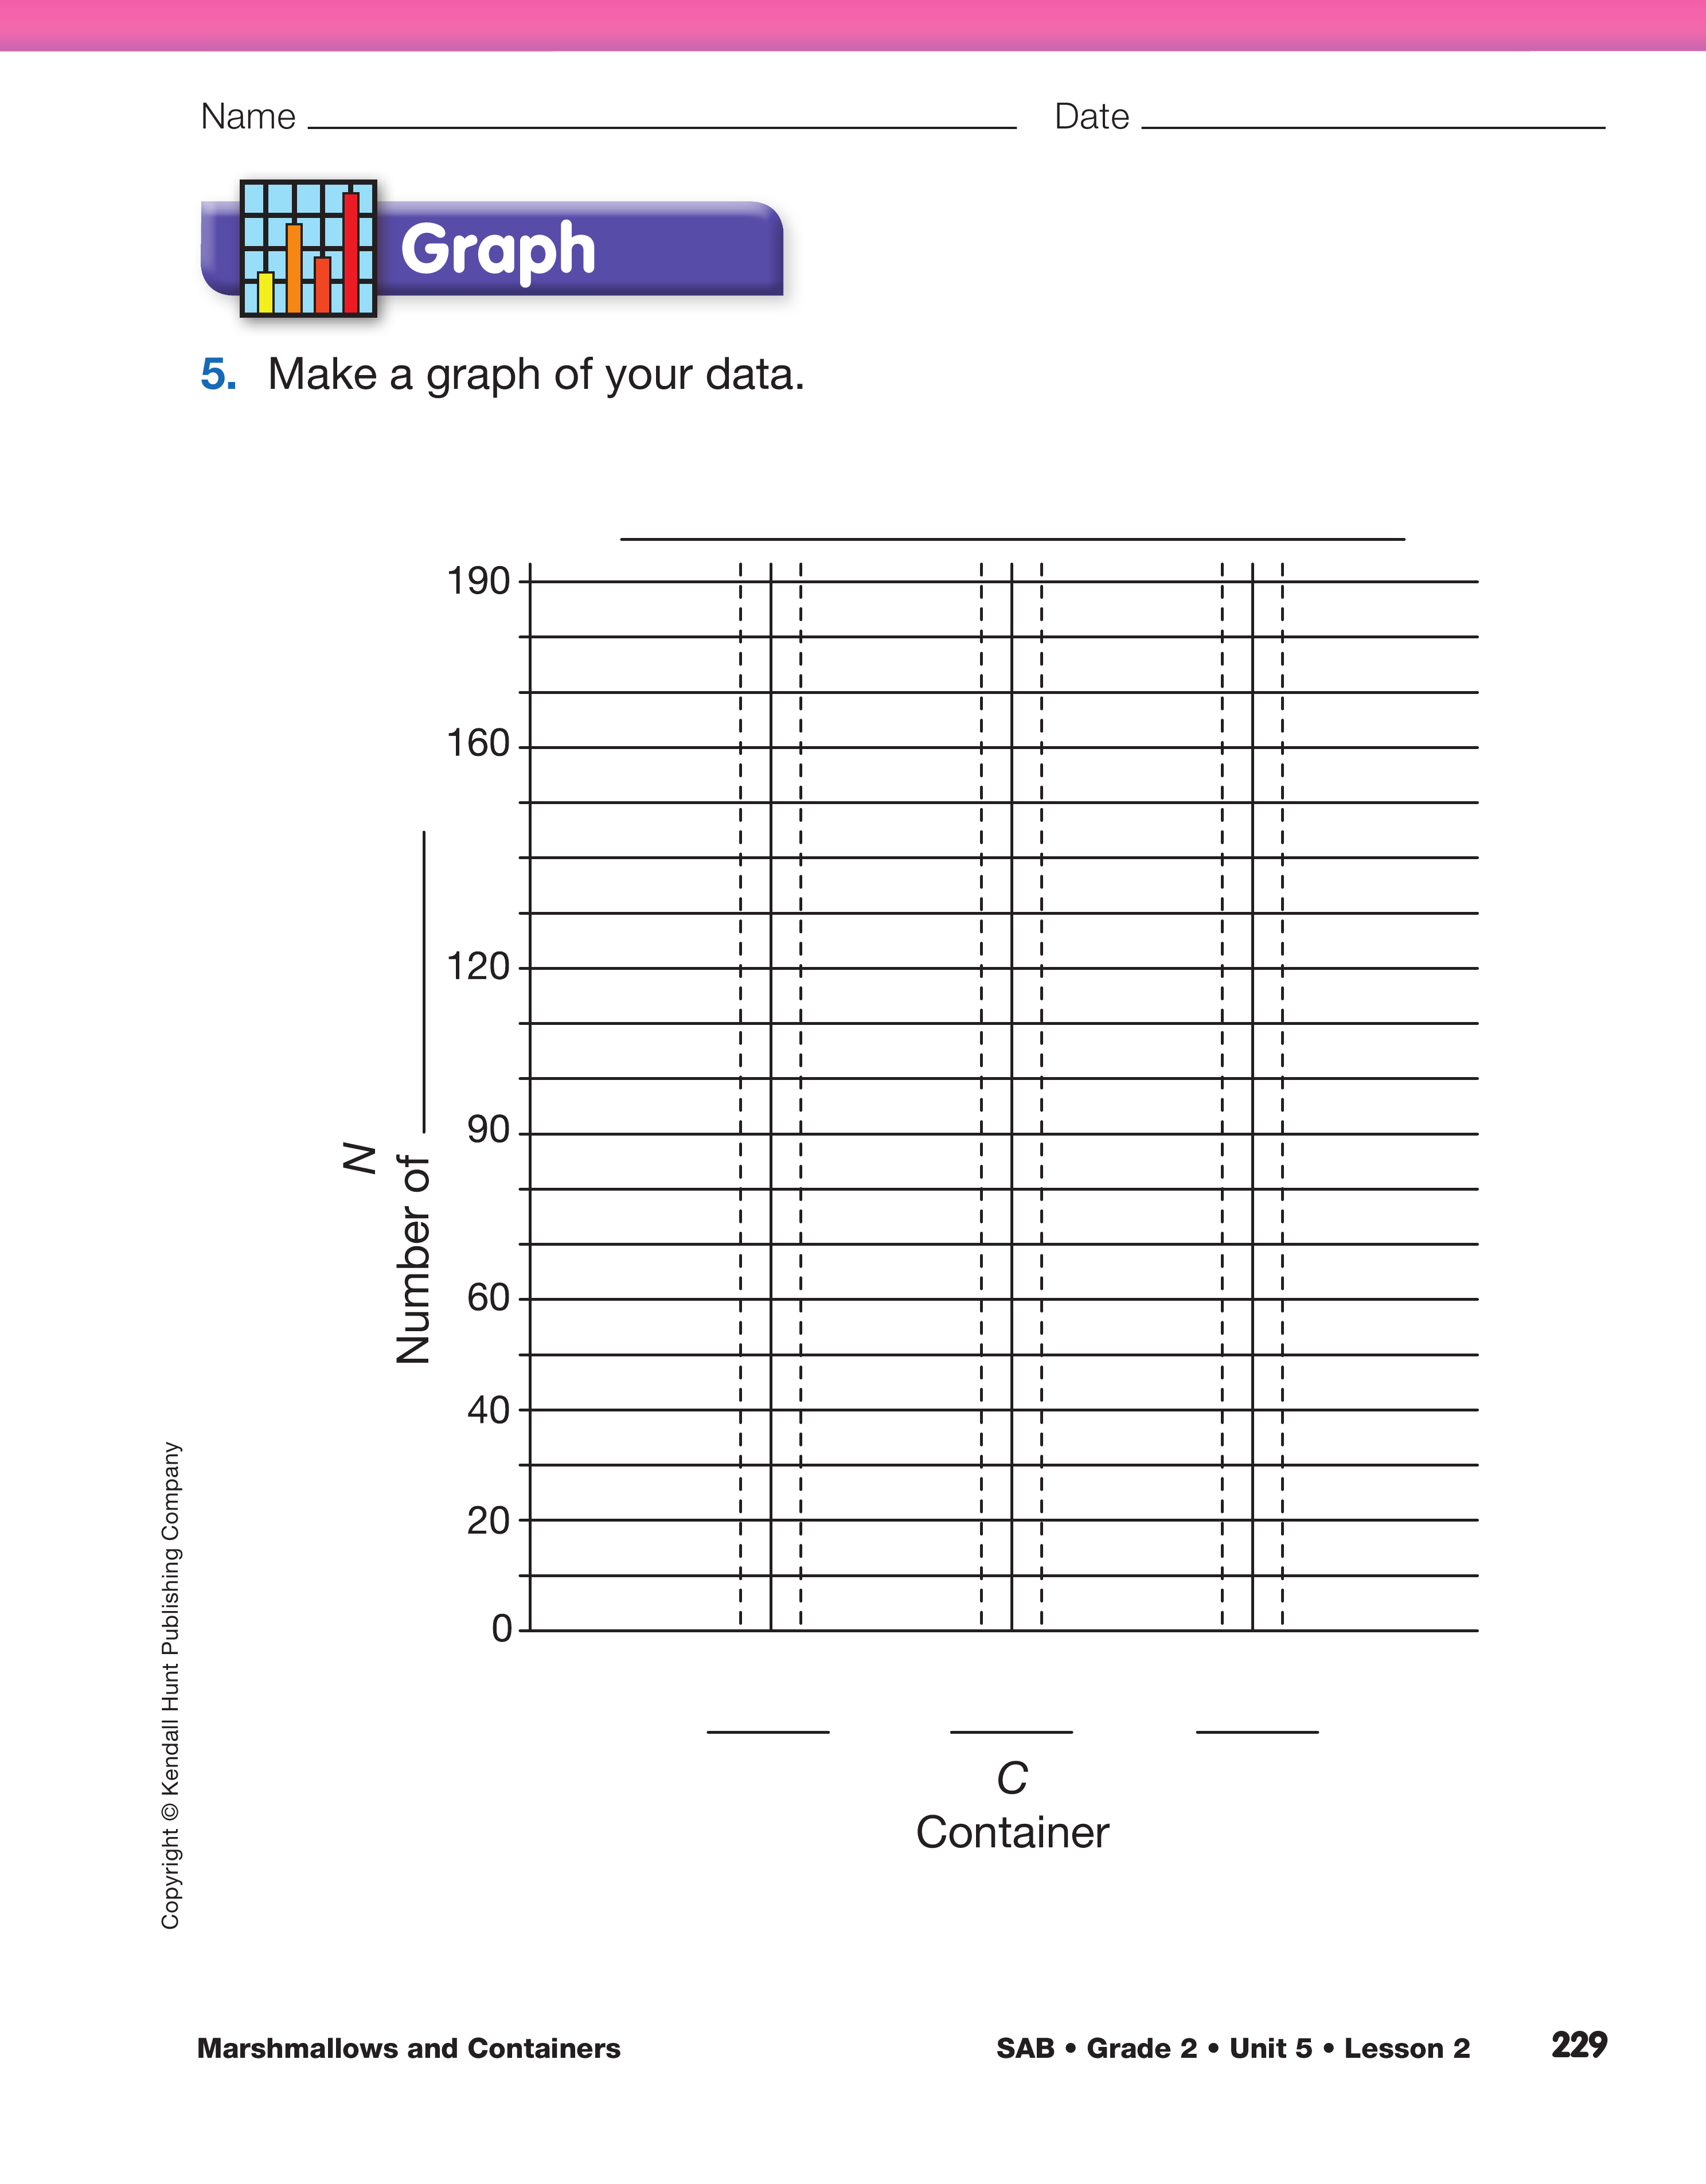
Show a display of the graph in Question 5 on the
Marshmallows and Containers pages. Ask students
to help you fill in the title and labels on the graph as
they follow along on their own graphs.
Point out the vertical axis on the display.
- Describe how it is labeled. (Some of the tens are
missing.)
- How should you label the axes? (Count by tens
for the vertical axis, Number of Marhmallows,
and write the names of the three containers on
the horizontal axis.)
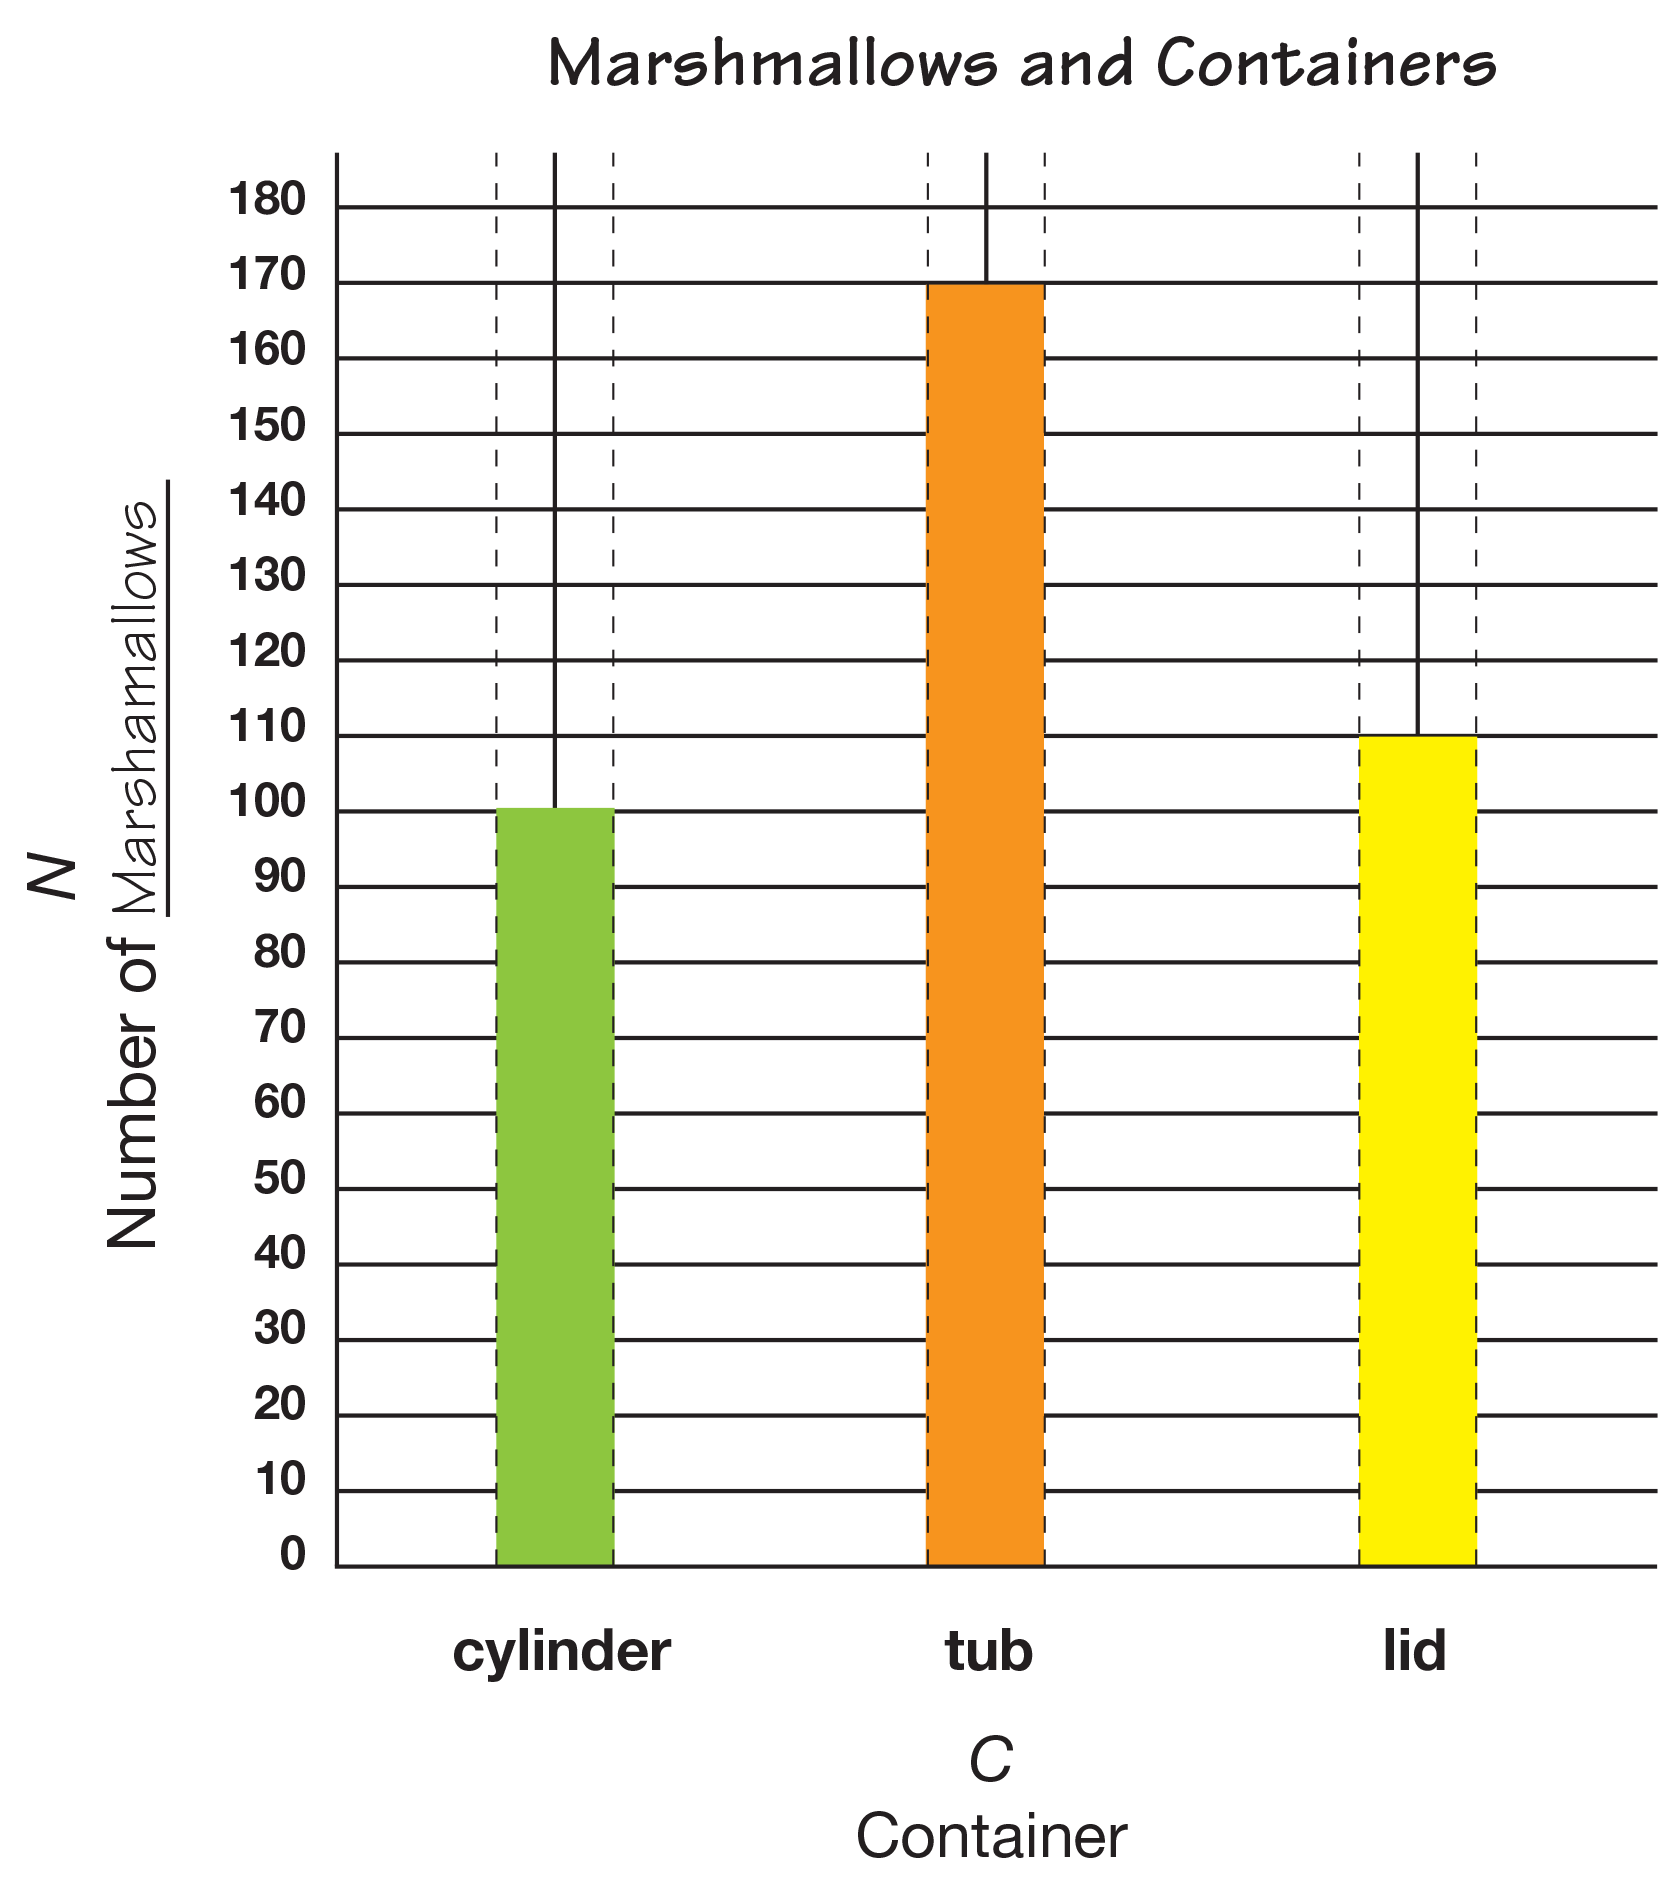
Write the title, the units, and the container names in
the appropriate blanks on the graph. Fill in the missing
numbers along the graph's vertical axis. Instruct
students to do the same and to graph the data. See
Figure 3.
Use the Marshmallows and Containers pages with the
Feedback Box in the Student Activity Book to assess
students' abilities to estimate a quantity [E4]; solve addition
and subtraction word problems involving volume [E8];
measure volume of containers using nonstandard units
[E10]; read and write numbers [E5]; and make and read a
data table and bar graph to find information, make
predictions, and make generalizations about a data set [E11,
E12, E13].