


Which Picks Up More?
Est. Class Sessions: 4–5Developing the Lesson
Part 1. Introducing the Lab
Discuss the Better “Picker Upper.” Students will investigate the absorbency of three brands of paper towels by measuring the area of the spots formed by drops of water. They will investigate further by seeing how many of these spots fit onto a paper model of a towel.
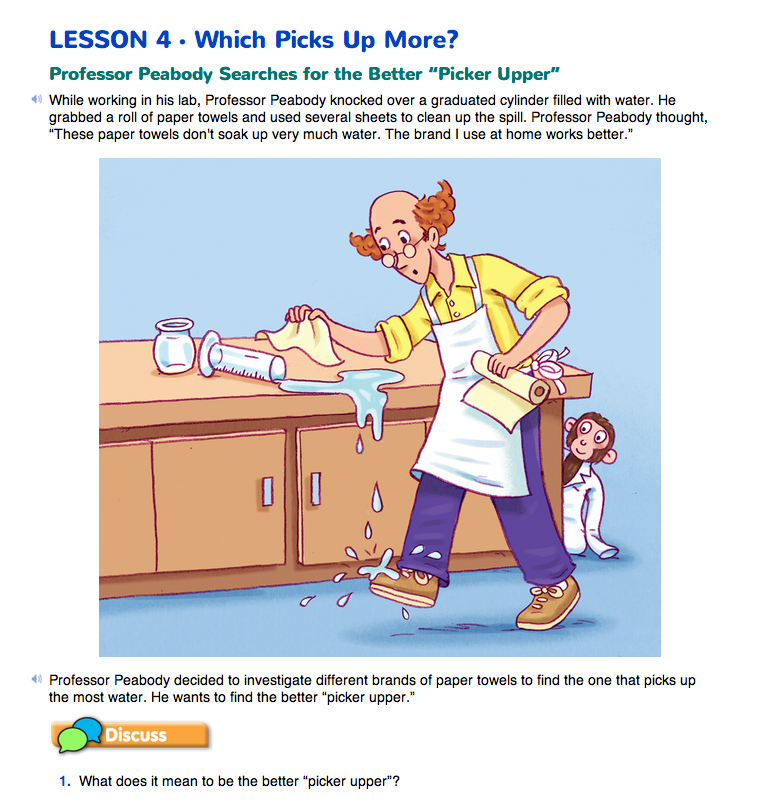
To begin the discussion, read the opening vignette and Question 1 on the Which Picks Up More? pages of the Student Guide. Professor Peabody decides to investigate different brands of paper towels after he cleans up a spill in his lab with one that is not very absorbent. Students will conduct an experiment similar to Professor Peabody's. The discussion of Question 1 should lead students to conclude that they and Professor Peabody are interested in finding out which paper towel can pick up or absorb the most water.
Include in your discussion other questions such as:
Ask students to do some preliminary observations by answering Questions 2–4. Distribute the extra sheets of paper towels and the small container of water and eye dropper to each group. To answer Question 2 students touch and look carefully at each brand. The sheets may differ in size, thickness, and puffiness. To answer Questions 3–4 students may make some additional comparisons by comparing the spots made by dropping water on each sheet. Discuss Questions 3–4 to decide how to measure the differences students observed in the spots.
Ask:

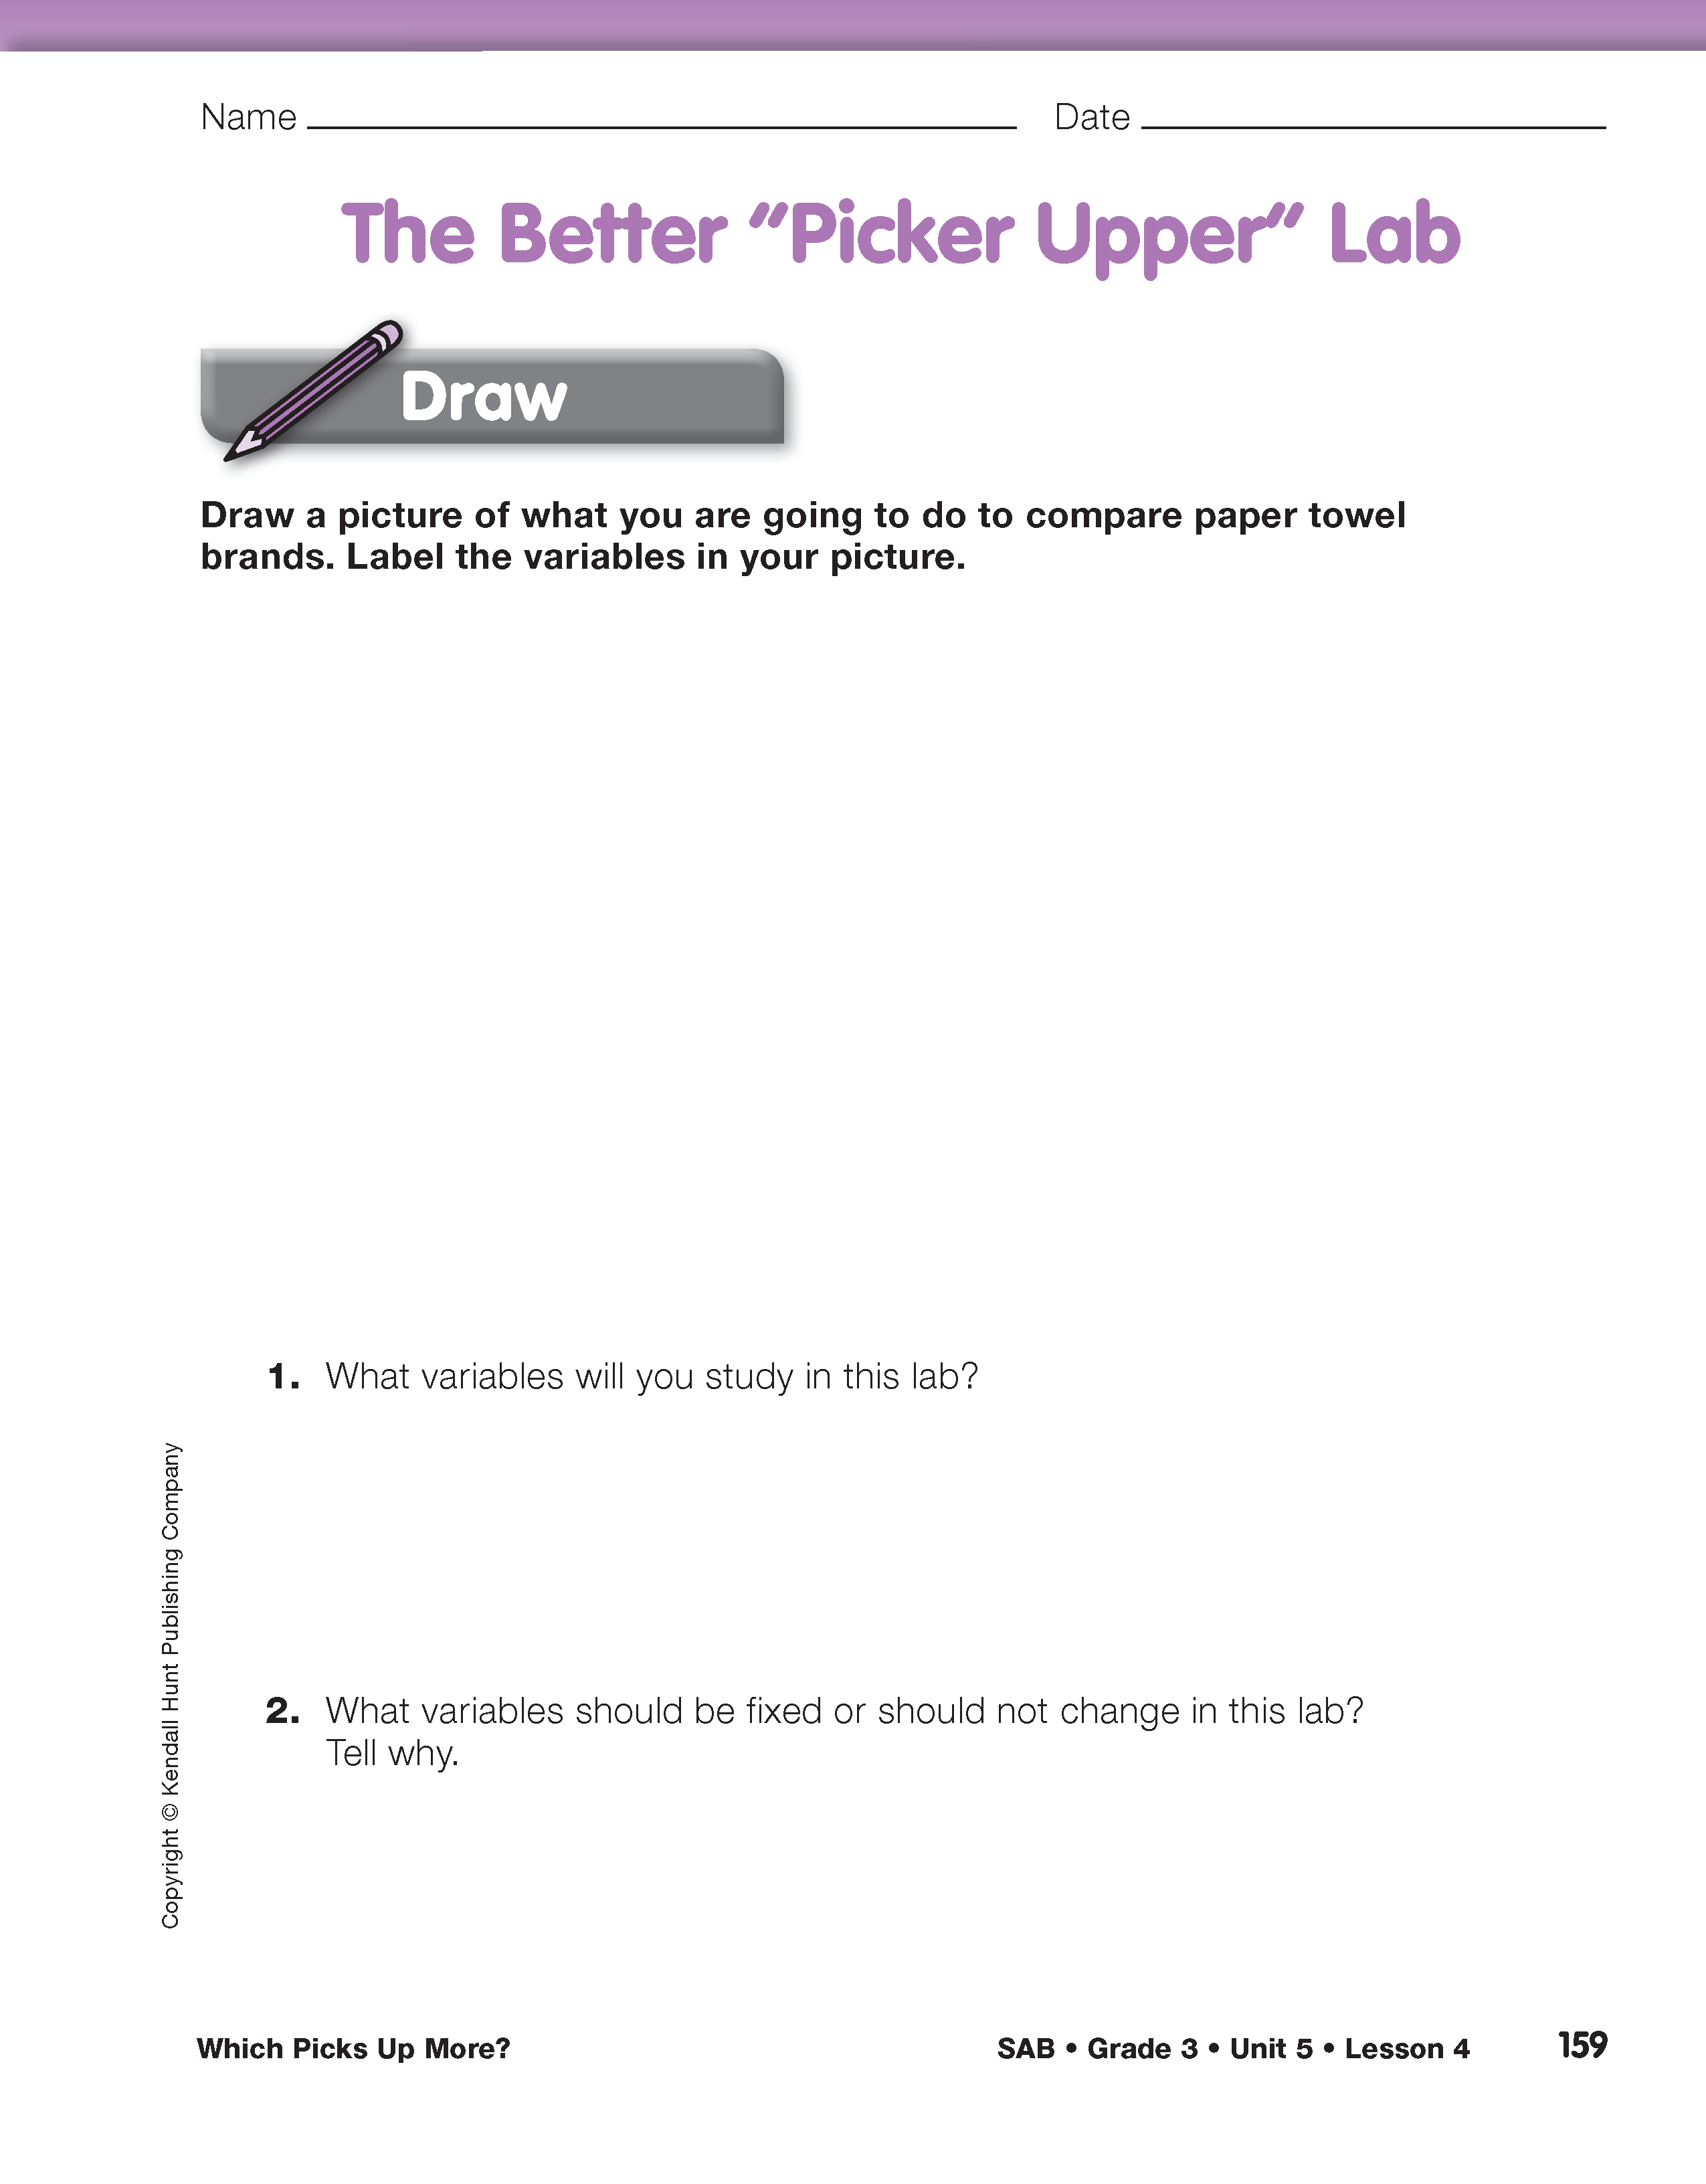
Prepare to Draw the Picture. Ask students to remove The Better “Picker Upper” Lab pages from the Student Activity Book. Ask students to discuss Questions 1–2 with their group before they start to draw a picture for this lab. To answer Question 2 about fixed variables, students may need to work with the materials to make spots. After groups have had a chance to brainstorm some ideas, make a list of student responses. Be sure they include the following:
- Use water on all the paper towels. (A liquid with different properties might spread out differently.)
- Use 5 drops to make each spot. (More water might make larger spots. Then we cannot compare the areas of the spots.)
- Drop all the drops in the center of each spot. (We want to see how far the water spreads out from where the water is dropped. We want the water to make its own shape.)
- Use the same type of eyedropper. (This keeps the size of the drops the same.)
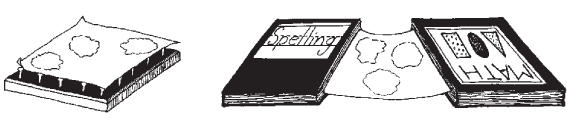
- Keep the towels off the desk until the spot has stopped spreading. (This will ensure that the water will spread out on the paper towel and not on the desk. See Figure 1.)
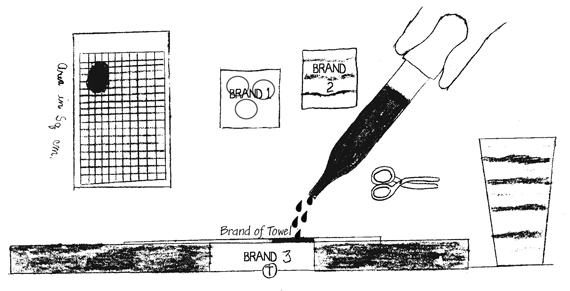
Draw the Picture. Ask students to draw the variables and tools they have already identified. After you demonstrate the lab procedures, students will add to and refine their drawings. See Figure 2 for an example of a finished drawing. Students should be able to show the types of paper towel, the tools, and the fixed variables.
After discussing the variables, model the procedure students will follow for collecting the data. Each group will have one sheet of each of the different brands of paper towels. Label the three brands of paper towels clearly. Because more than one water spot will be made on each paper towel sheet, sheets should be kept off the tabletop so that the spots do not run together. To facilitate this process, students can place two books on the table, spaced a little closer than the width of one paper towel. One edge of a sheet is placed between the pages of each book so that it is lifted off the tabletop, as in Figure 1.

Another method is to lay the paper towels on top of geoboards. Demonstrate the following process to students:
- Label the paper towel with the brand and student group name.
- Use the eyedropper to drop 5 drops of water onto the paper towel.
- Drop all drops in the center of each spot.
- Wait until the spot spreads out.
- Move to another section of the paper towel sheet (far enough from the first spot so that they will not run together) and drop 5 more drops.
- Make three spots on each brand of paper towel.
As soon as the spots stop spreading, show students how to trace the perimeter of each spot with a pencil. This provides an outline of the spot's perimeter that will be visible once the water evaporates. Letting the paper towels dry for several minutes or overnight will make it easier to cut out the spots.
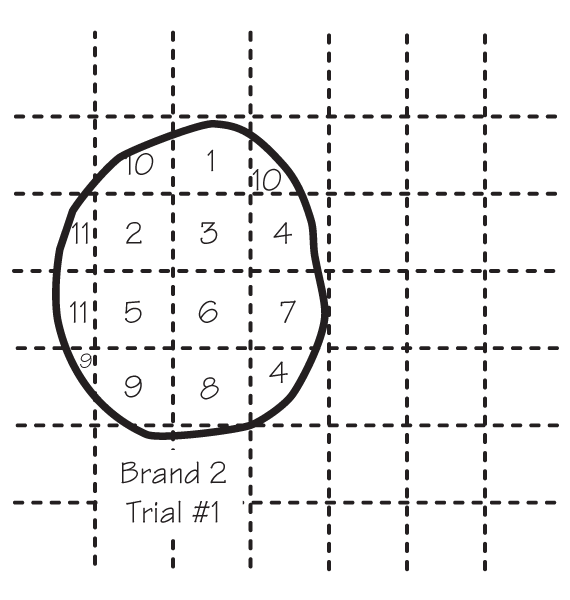
Using the spots you already prepared or when the spots are dry enough, show students how to cut them out and trace them on to a piece of Centimeter Grid Paper. See Figure 3. Also show students how to label their spots and paper towels with their initials and the brand of the paper towel. Ask students to add these additional steps and tools to their drawings.
In the sample picture in Figure 2, Daniel has shown the procedure and labeled the three brands of paper towels clearly. By looking at the picture, we know that he will drop 5 drops of water onto a paper towel, three times to make three different spots. He will use scissors to cut out the resulting spots. He will place the spots on grid paper to find the area in square centimeters. Daniel clearly labeled the two primary variables: “T = Brand of Towel” and “Area in sq cm.”