Lesson 4

Which Picks Up More?

Est. Class Sessions: 4–5

Developing the Lesson

Part 3. Represent and Analyze the Area Data

Make a Graph. In Question 4, students are asked to make a scaled bar graph. Display a copy and distribute copies of the Centimeter Graph Paper Master. Model how to label, scale, and draw bars on this type of graph paper.

  • What variable should we put on the horizontal axis? (Brand of Paper Towel, T)
  • What variable should we put on the vertical axis? (Area of Spot in sq cm, A)
  • How should we label the lines on which the bars will be drawn? (with the names of the brands of paper towels)
  • How should we scale the vertical axis? (by ones; 1, 2, 3, etc.)

Help students decide on an appropriate scale for the vertical axis by looking at the spot with the largest area. If the area is larger than 20 square centimeters, students will have to scale the axis by twos. Ask each group to graph their data on their bar graph (Question 4).

Drawing Bar Graphs. Be sure students draw their bars on the lines and place the labels indicating the towel brands below the lines (not on the spaces) as shown in Figure 5. We use this convention so the transition from making a bar graph to making a point graph in Unit 10 will be easier.

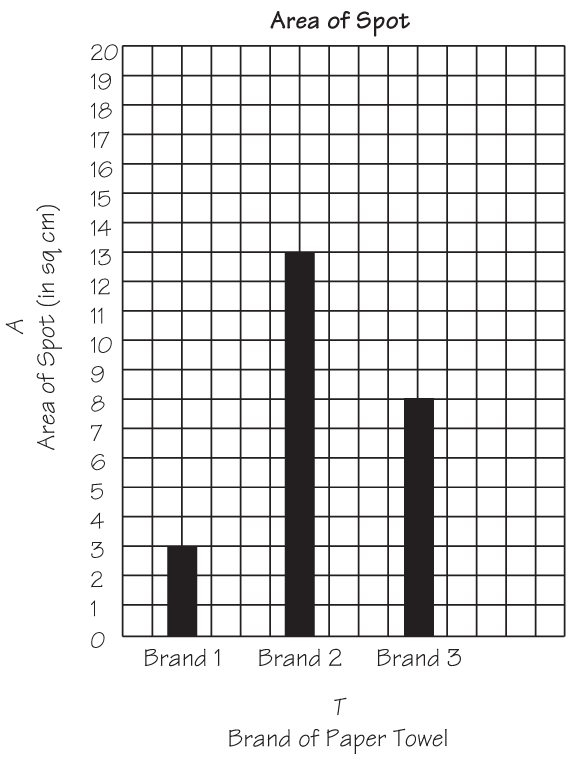
Use the Graph to Make Predictions and Generalizations. Ask groups to discuss and answer Questions 5–9 in the Student Activity Book using the graph they just made.

  • What does the tallest bar on the graph represent? (The spot with the largest area.)
  • What does the spot with the largest area mean? (The water drops spread out the most to make the largest spot. There is not a lot of dry towel left to pick up more water.)
  • Looking at your data, which towel do you think will pick up the most water (Question 9)? (Answers may vary. Two answers to the question are still probable: the towel with the tallest bar will pick up the most water, which is incorrect, or the towel with the shortest bar will pick up the most water. See Sample Dialog.)

Use this dialog to guide discussion of Question 9 in the Student Activity Book.

Teacher: Which towel do you think will pick up the most water? Why do you think so?

Jasmine: I think the Econo because it had the biggest spot.

Teacher: So the towel with the biggest spot will be able to pick up the most water?

Jasmine: Yes.

Other students: No! It's the towel with the smallest spot.

Teacher: What's the relationship between the size of the drop and the amount of room left on the towel? Talk with your partner.

[Students talk among themselves.]

Teacher: Is a bigger spot better? Why or why not?

Scott: No, because the bigger spot means it holds less water because it is more spread out. You can't fit as many big circles on the towel as you can small circles.

Teacher: If the spot is smaller, what does that mean about the rest of the paper towel? Is a smaller spot better? Why or why not?

Kit: Yes, the smaller it is spread out, the more water the rest of the paper towel can hold.

Jerome: There is more soaking up space on the towel.

Shannon: It [the space left over] is bigger and can pick up more things.

Nila: The towel with the smallest spot has more space to soak up more water.

Lisa: You mean absorb more water.

Teacher: Compare spots on both towels. Which towel do you want then: the one with a smaller area for the spot or the one with a spot with a bigger area? Why?

Lisa: Smaller, because it leaves more room on the paper towel to soak up the extra water.

X
SAB_Mini
+
A graph of Daniel's data
X
+