Lesson 4

Which Picks Up More?

Est. Class Sessions: 4–5
X

Mathematical Standards

3.MD.B
Represent and interpret data. (3.MD.B.3)
3.MD.C
Geometric measurement: understand concepts of area and relate area to multiplication and to addition. (3.MD.C.6)

Standards for Mathematical Practice

MP1.
Make sense of problems and persevere in solving them.
MP2.
Reason quantitatively.
MP3.
Construct viable arguments and critique the reasoning of others.
MP4.
Model with mathematics.
MP5.
Use appropriate tools strategically.
MP6.
Attend to precision.

Students use mathematical models (e.g., graphs, tables, and diagrams) to decide which paper towel brand picks up more water or is the better “picker upper.” Students measure the area of a spot made by a given number of drops of water on different brands of paper towels. Then they use a paper model to estimate the number of drops that a paper towel might pick up.

Content in this Lesson

  • Using tables, graphs, and diagrams to model and reason about real-world problems [E8].
  • Identifying the variables of an investigation.
  • Identifying the fixed variables in an investigation.
  • Finding the median of a data set [E7].
  • Making a scaled bar graph using numerical data [E5].
  • Reading a table and graph to find information about a data set [E6].
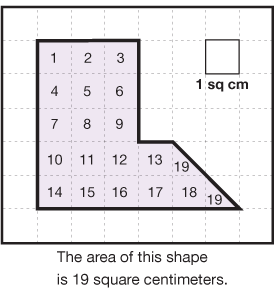
  • Measuring area by counting square units [E3].
  • Making predictions and generalizations about a data set using data tables, graphs, and diagrams [E8].
  • Clearly communicating one's reasoning [MPE5, MPE6].
  • Knowing and using appropriate tools to solve a problem [MPE1, MPE2].
X

Materials for Students

Daily Practice and Problems Lesson Homework Assessment

Student Books

Student Guide      
Student Activity Book    

Teacher Resources

Teacher Guide - digital

Supplies for Student Groups

eyedropper
3 brands of paper towels of varying quality, one sheet of each brand
scissors
small container of water
2 books or 1 geoboard for drying the paper towels
3 sheets of blank copy paper

Materials for the Teacher

Display of Centimeter Graph Paper Master (Teacher Guide)
Display Professor Peabody Makes Another Model section of the Better “Picker Upper” Lab pages
          (Student Activity Book) Page 162
Display of Question 15 of the Better “Picker Upper” Lab pages (Student Activity Book) Page 165
Unit 5 Assessment Record
Math Facts Class Record
eyedropper
one paper towel for demonstration
scissors
small container of water
2 books or geoboards
extra sheets of the 3 brands of paper towels for students' preliminary investigations
food coloring, optional

Materials Preparation

Paper Towels. Gather three brands of paper towels of varying quality. Try to include an inexpensive or generic brand and one brand that is said to be “super absorbent.” You may also want to include a paper towel that is made of recycled paper so that students can explore advertising claims and environmental concerns as well as absorbency.

Organize Lab Materials. Organize the lab materials for each group: an eyedropper, one sheet of each brand of paper towel, scissors, a small container of water, books or geoboards for drying the paper towels, and blank copy paper.

Prepare Water Spots. Early in the lesson you will demonstrate the steps in this lab. After reading through the procedure in Part 1, prepare some spots in advance so students can see what a dry spot will look like and will know how to proceed in their data collection.

Colored Water. Some teachers prefer to make the spots with colored water. To create the colored water, combine 3 to 4 drops of food coloring with about 100 cc of water. Distribute this water into separate containers for the groups to use. Each group will need a small amount of the water—probably 10–20 cc.

Assessment in this Lesson

Assessment Expectation Assessed Math Practices Expectation Assessed

The Better
“Picker Upper” Lab

with Feedback Box
Student Activity Book
Pages 159–166

E3.
Find the area of shapes with straight or curved sides by counting square units.
E5.
Make a scaled bar graph using numerical data.
E6.
Read a table and graph to find information about a data set.
E7.
Find the median of a data set.
E8.
Make predictions and generalizations about a data set using data tables, graphs, and diagrams.
 

Lori's Questions
Assessment Master
with Feedback Box
Teacher Guide - digital

E3.
Find the area of shapes with straight or curved sides by counting square units.
E6.
Read a table and graph to find information about a data set.
E8.
Make predictions and generalizations about a data set using data tables, graphs, and diagrams.
MPE1.
Know the problem. I read the problem carefully. I know the questions to answer and what information is important.
MPE2.
Find a strategy. I choose good tools and an efficient strategy for solving the problem.
MPE5.
Show my work. I show or tell how I arrived at my answer so someone else can understand my thinking.
MPE6.
Use labels. I use labels to show what numbers mean.

DPP Item I
Averaging
Teacher Guide - digital

E7.
Find the median of a data set.

DPP Item O
Subtraction Strategies
Teacher Guide - digital

E9.
Use mental math strategies to subtract, including using doubles and thinking addition, for the facts in Groups 7 and 8.
 

Home Practice Part 4
Finding Area
Teacher Guide - digital

E1.
Recognize that different shapes can have the same area.
E3.
Find the area of shapes with straight or curved sides by counting square units.
 

Vocabulary in this Lesson