


Which Picks Up More?
Est. Class Sessions: 4–5Developing the Lesson
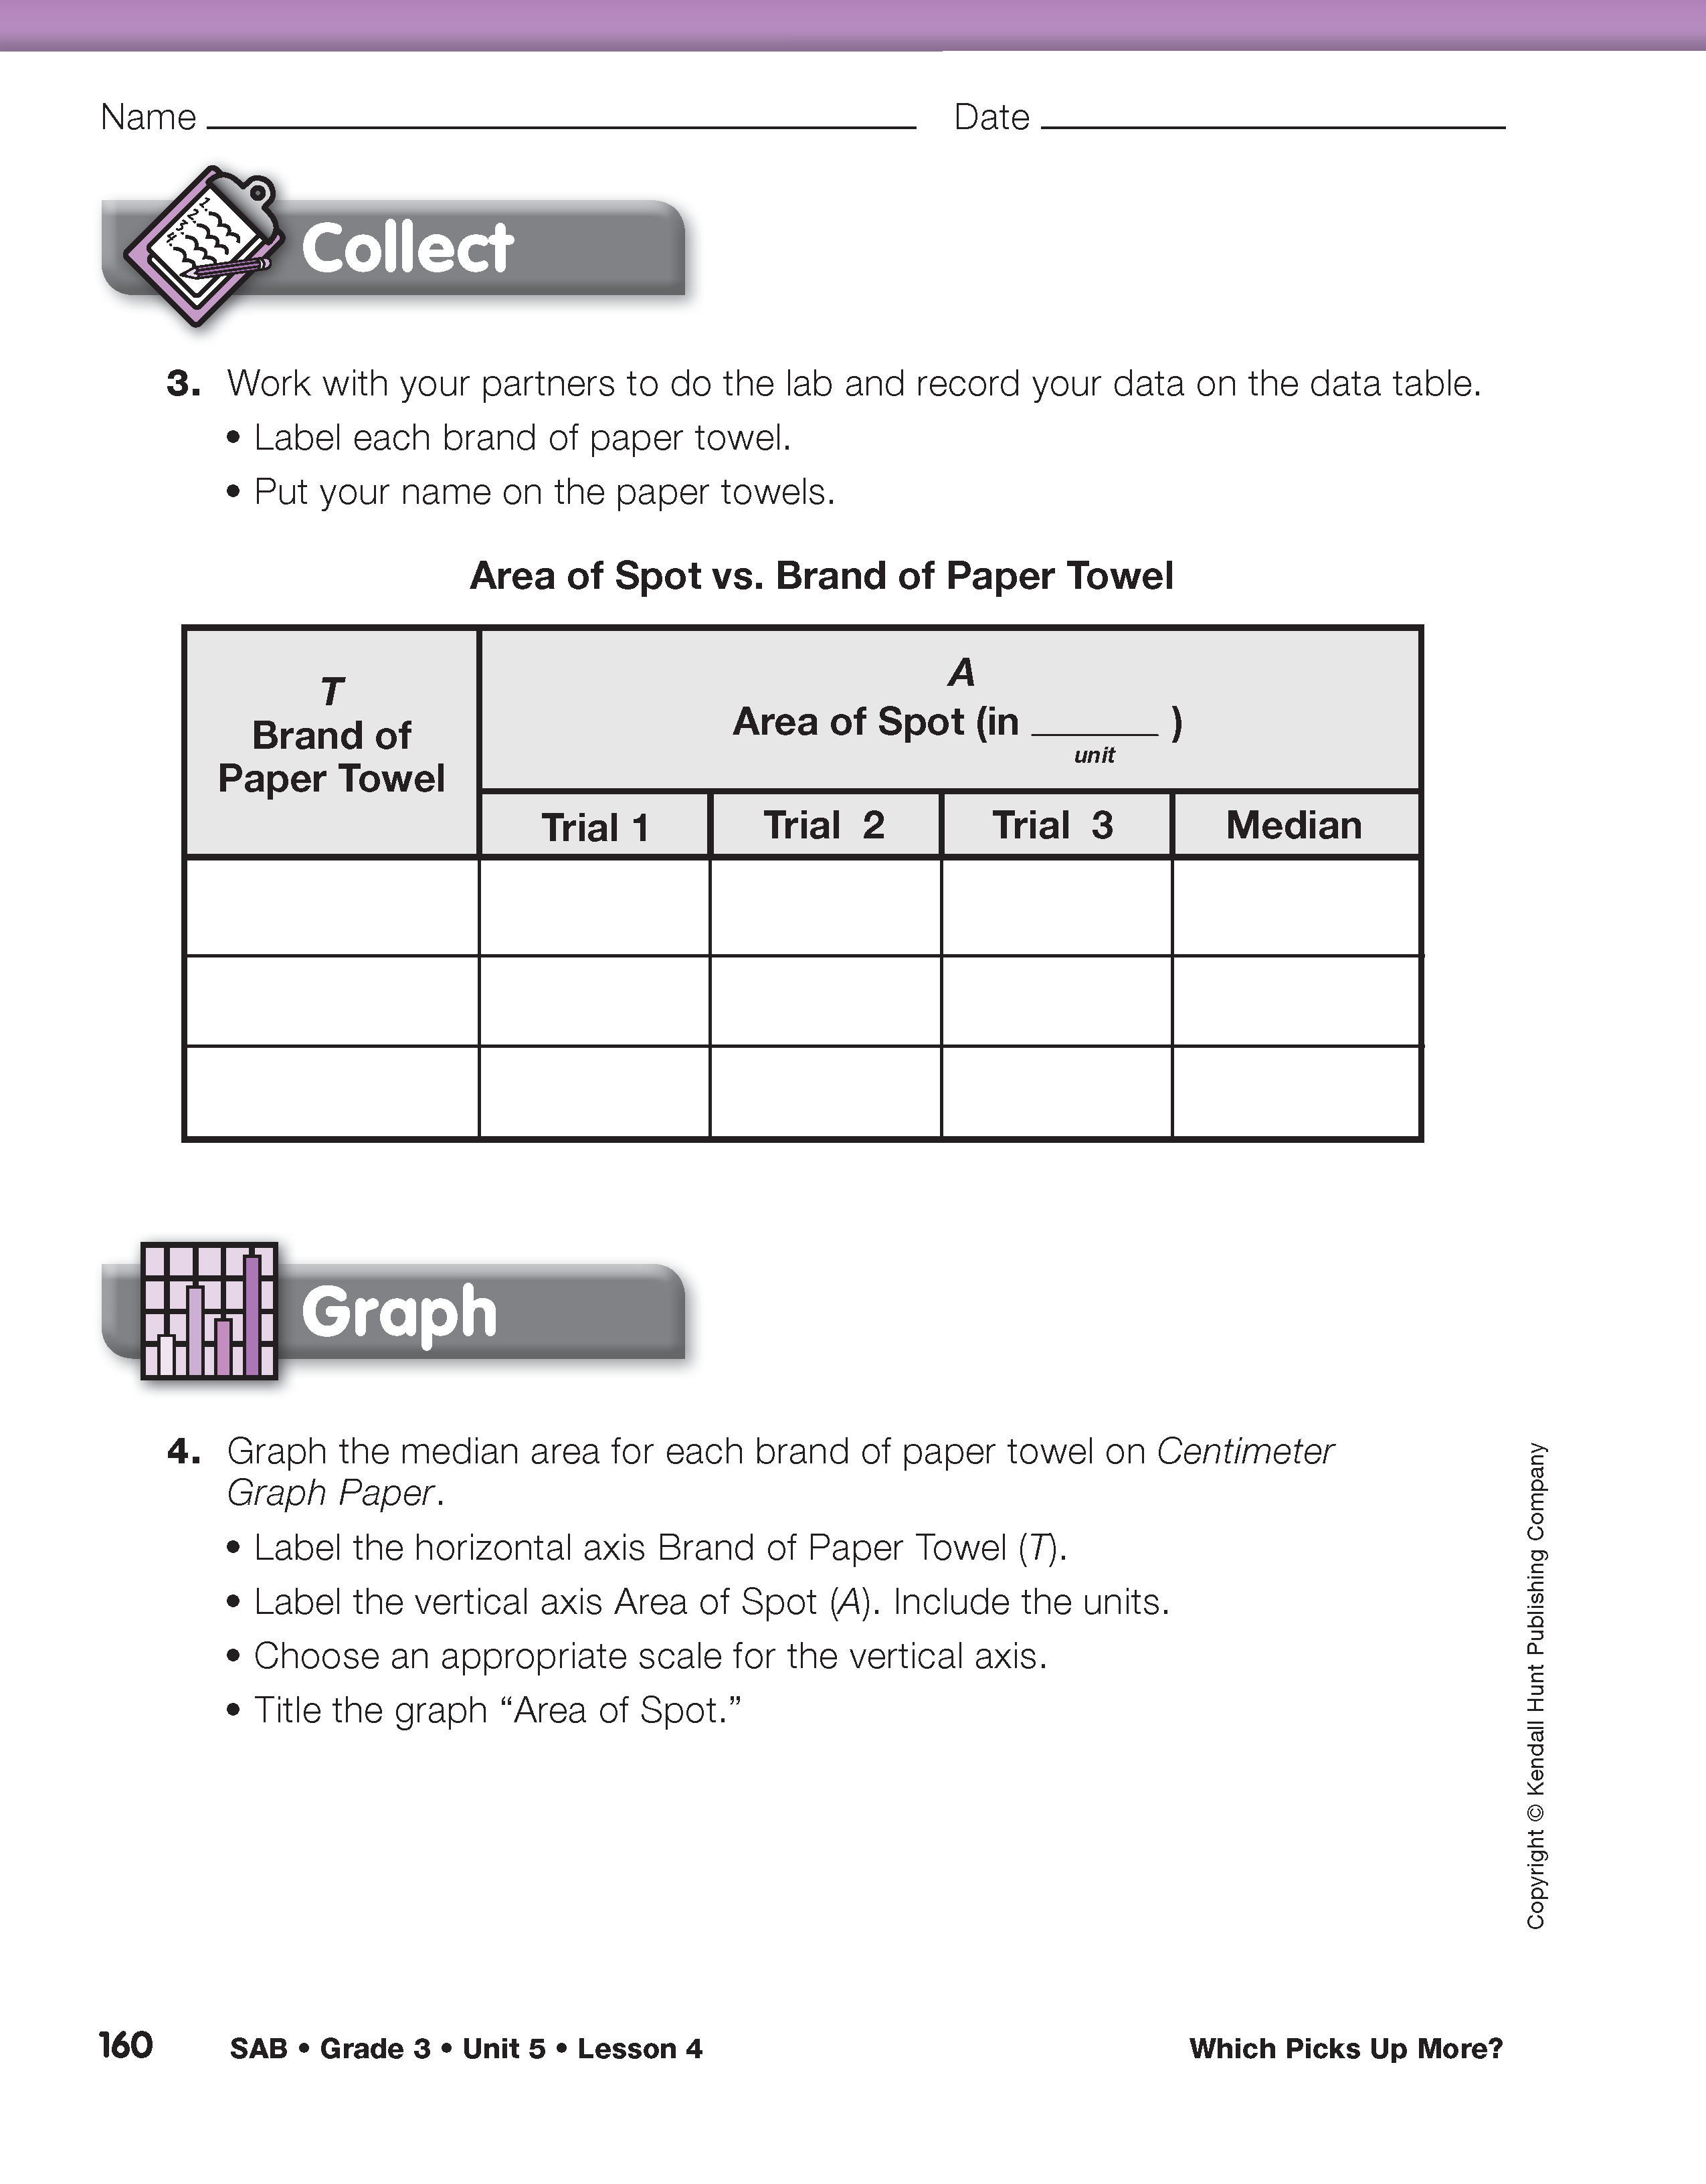
Part 2. Collecting and Recording the Area Data
Discuss Finding the Median Area. Discuss with the class the need to measure more than one spot for each brand of paper towel. The data table on The Better “Picker Upper” Lab pages in the Student Activity Book provides room to record the results of three trials and their median value. For a discussion of finding the median, see Lesson 3 Boo the Blob.
Ask:
The groups are now ready to collect data about each paper towel brand. Distribute the lab materials you organized for each group of 4 students: an eyedropper, one sheet of each brand of paper towel, scissors, small container of water, and books or geoboards for drying the paper towels. Students will collect and record data on the data table provided in Question 3 of the Collect section of The Better “Picker Upper” Lab pages in the Student Activity Book.

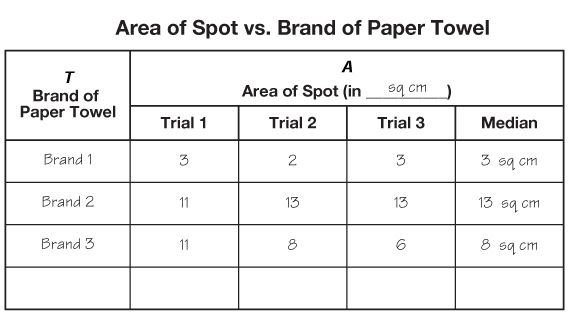
Check Student Data. While students are gathering and recording data, check the results of each group. Although we expect a certain amount of error, the measured area of the three spots for each type of paper towel should be relatively close. In Daniel's data table shown in Figure 4, the results of the three trials for both Brand 1 and Brand 2 are as close to one another as we can expect.
However, the data for Brand 3 looks suspect: the area for the first trial is almost double the area found in the third trial. These differences provide an opportunity to discuss the possibility of making mistakes—perhaps Daniel did not trace or cut out one of the spots as carefully. This is also a good time to point out problems that can occur if the fixed variables are not actually held constant—perhaps the first spot contained too many drops. If possible, this group should perform a fourth trial and use this data to judge which trial contains the most error and replace it with the new trial.