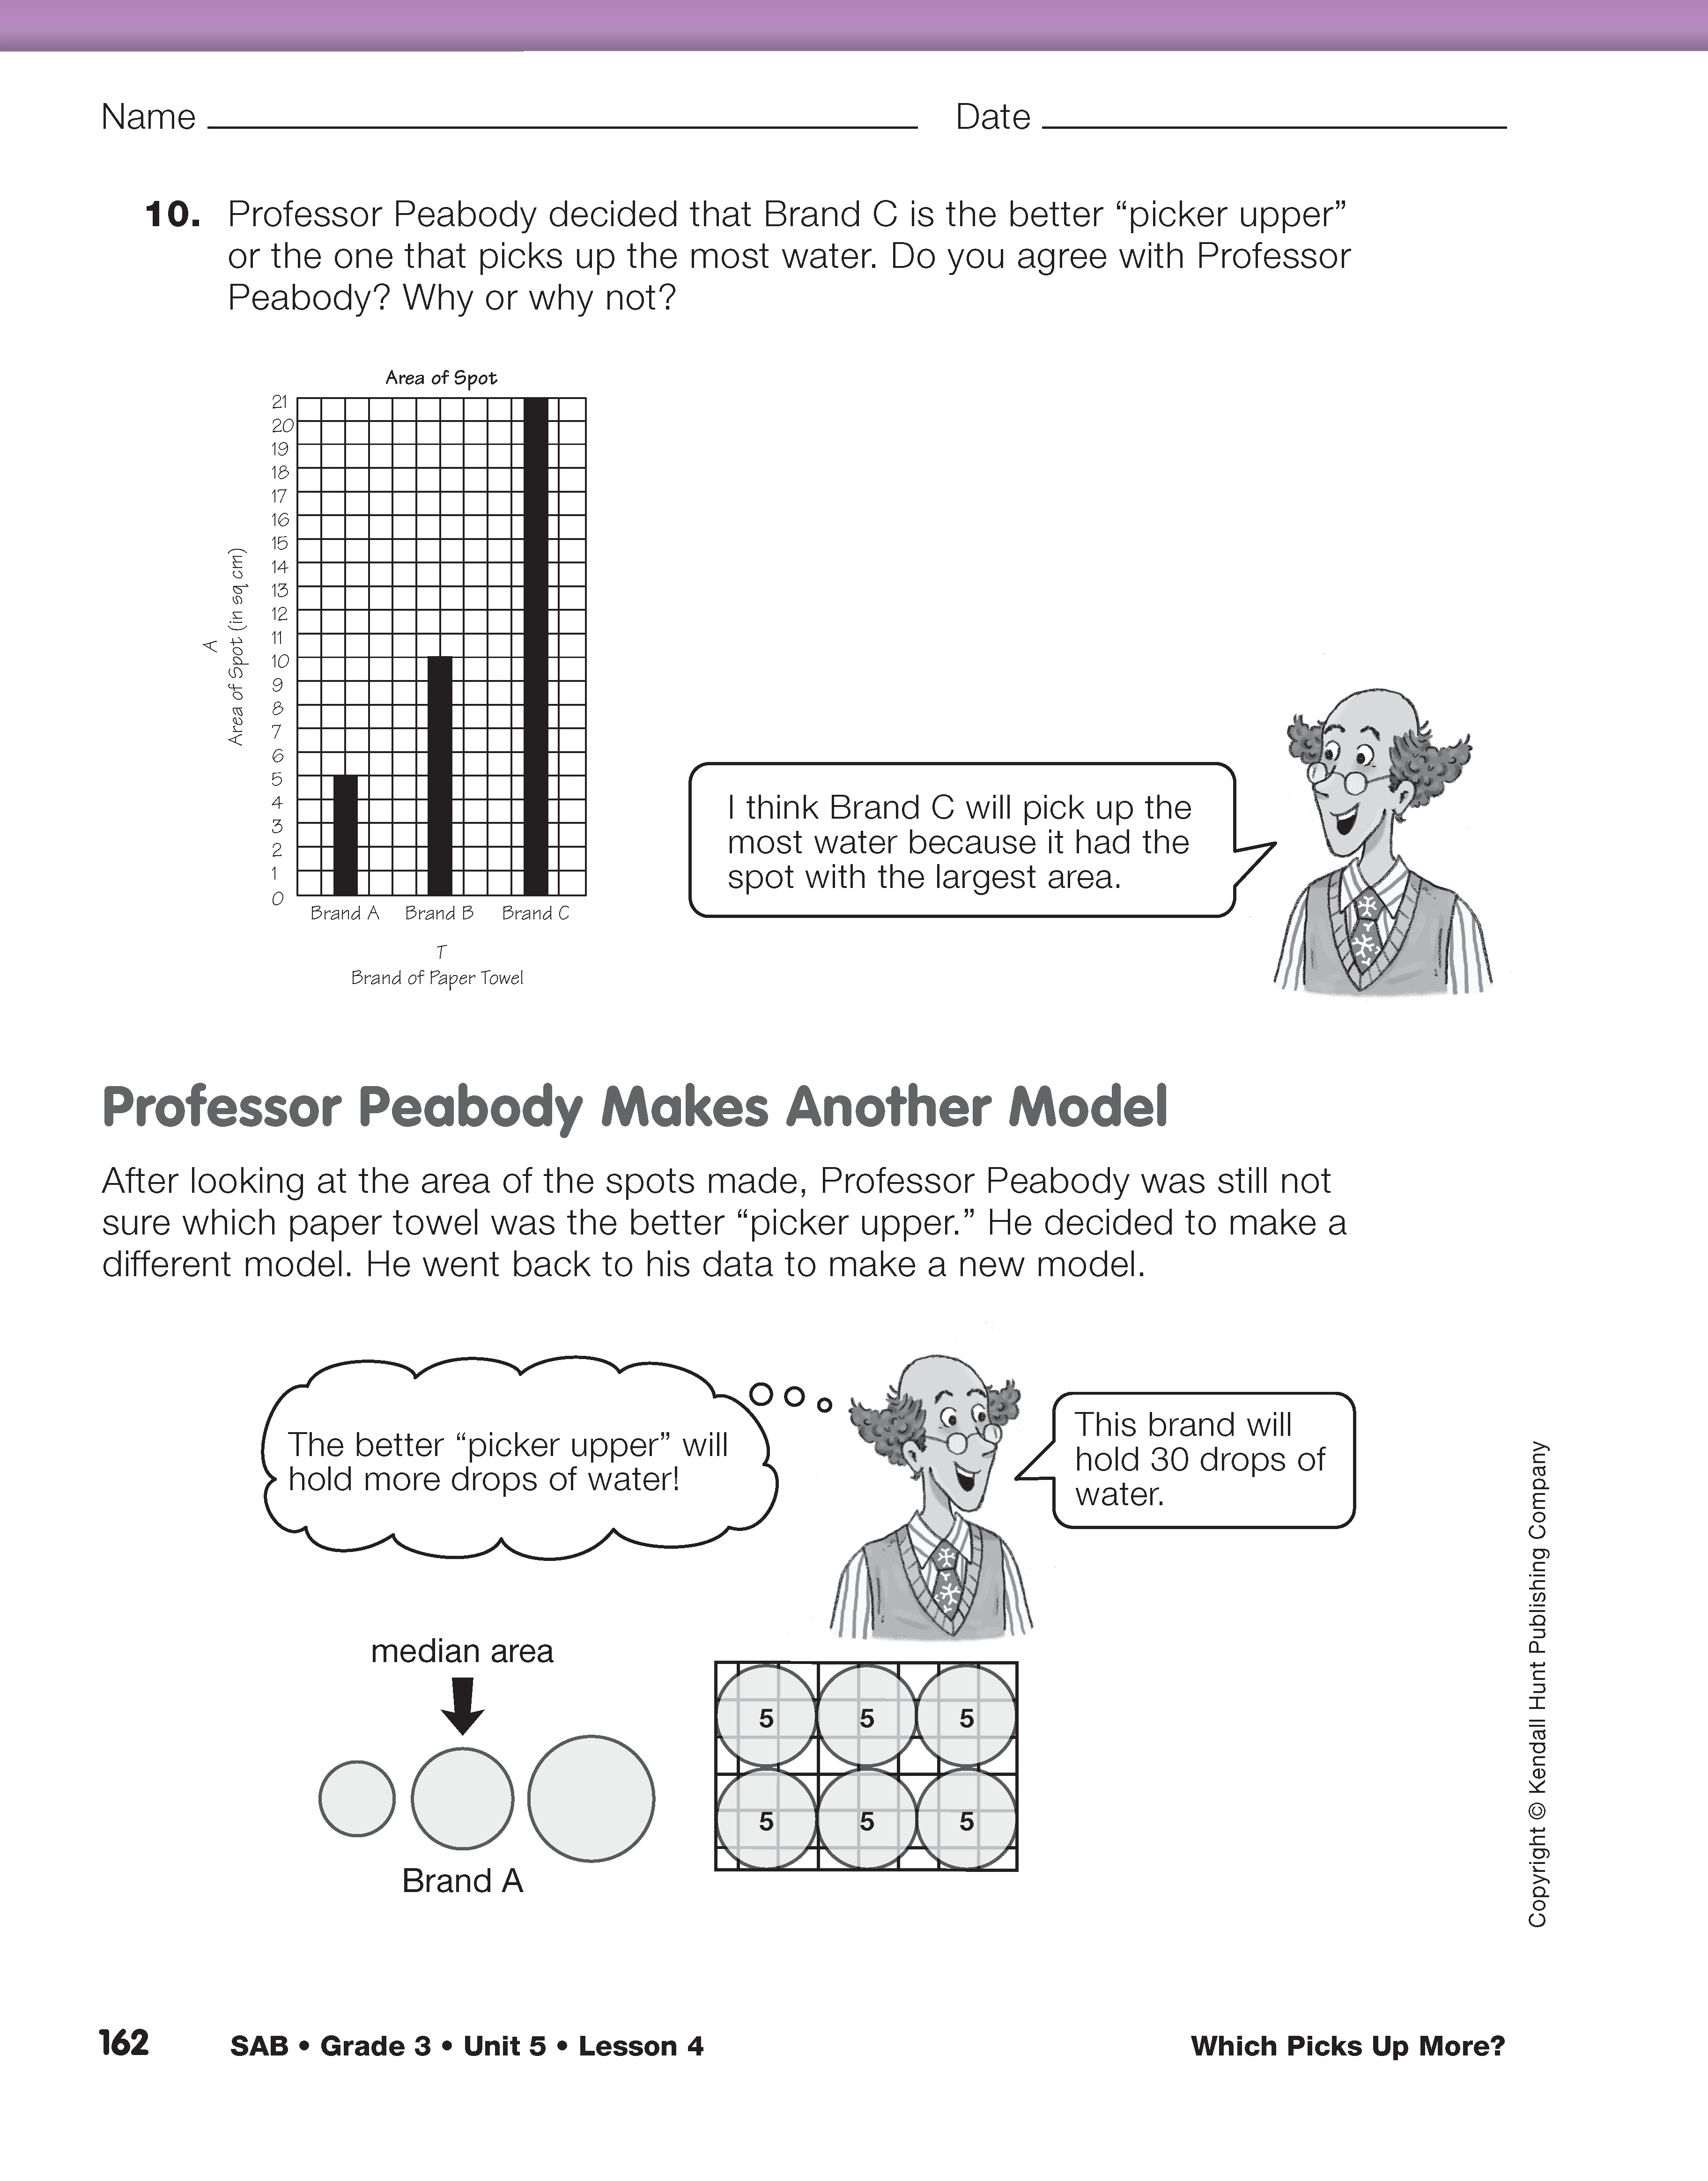
Model the Number of Drops. Read and discuss Question 10 in the Student Activity Book together with the class.
- Look at Professor Peabody's graph in Question 10. Do you agree with Professor Peabody's conclusion? Why or why not? (Responses will vary as some students may incorrectly believe, as the professor did, that the larger the spot, the better the absorbency. Professor Peabody did not realize that the spot with the largest area leaves the least dry area on the remainder of the towel.)
Refer students to the Professor Peabody Makes Another Model section in the Student Activity Book. Display the vignette and discuss his model.
- Look at Professor Peabody's model. About how many drops will his paper towel pick up? (Looking at the picture with the spots traced, his paper towel will hold about 30 drops.)
- What is Professor Peabody showing in his model? (He shows the number of drops on a paper towel, the number of drops in each spot, and the number of spots that fit on a paper towel or given space.)
- Which Brand A spot do you think he used to make his new model? (Responses will vary. Students should suggest the spot with the median area.)
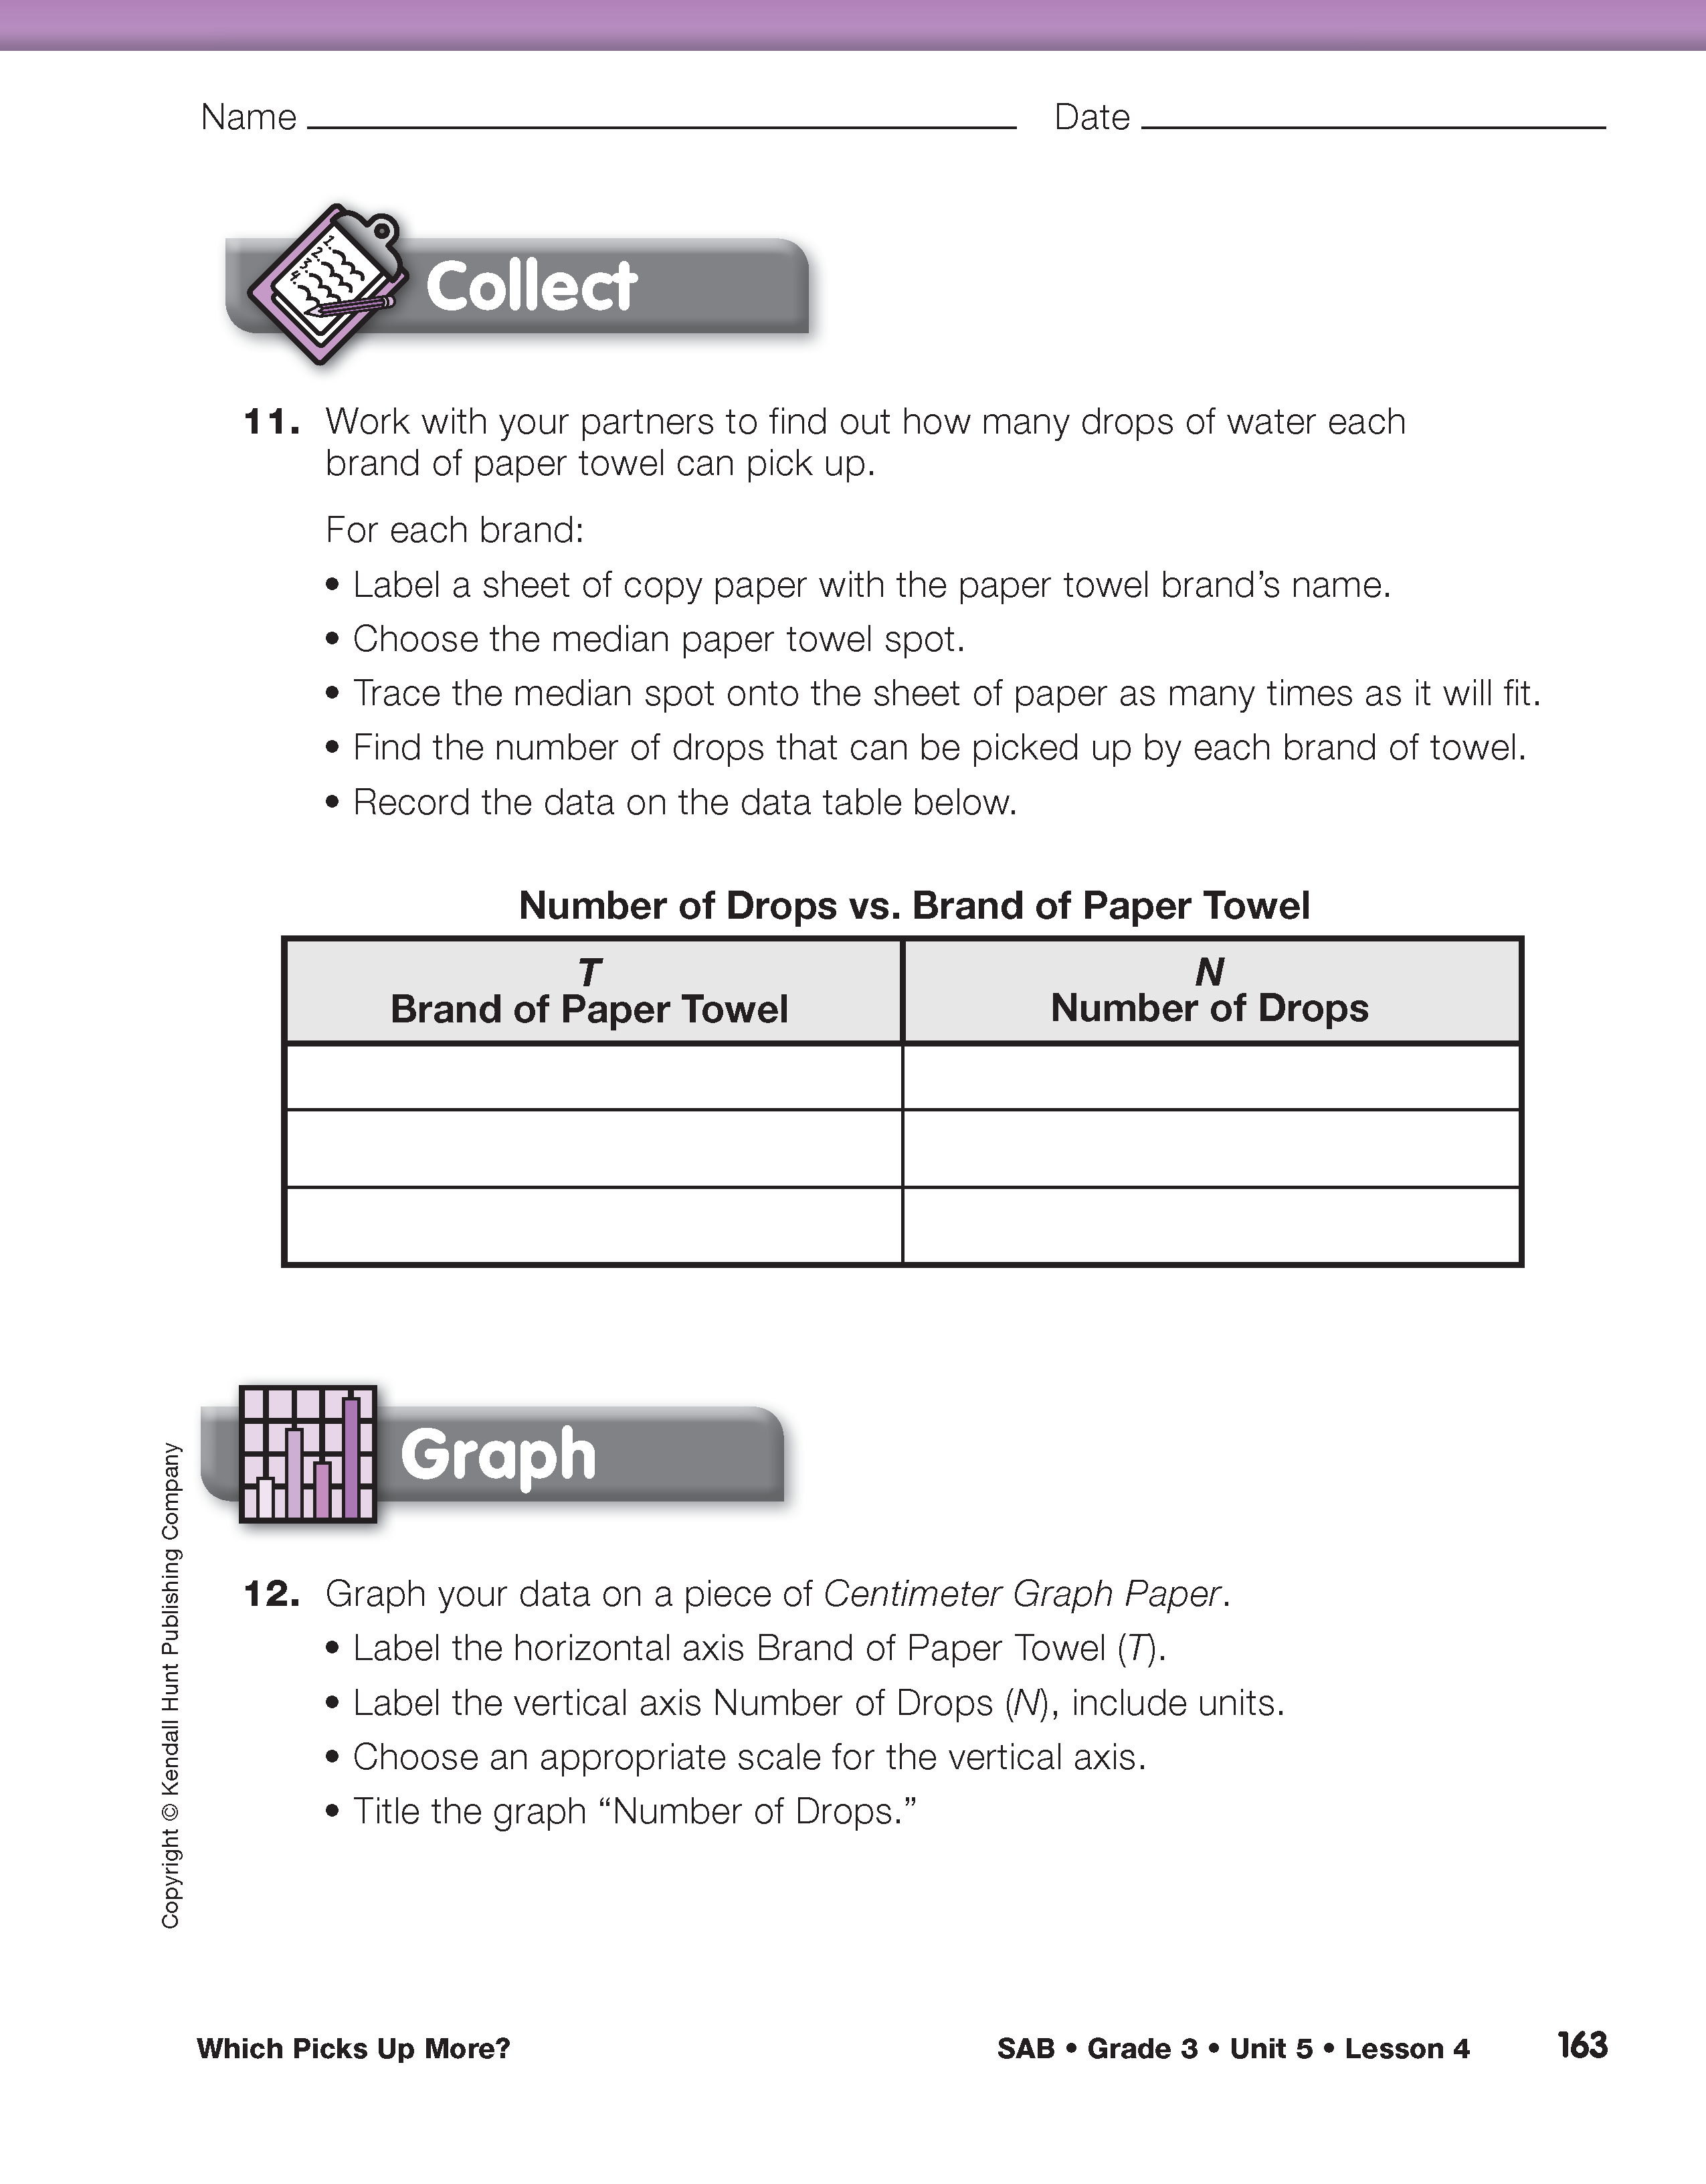
Ask students to turn to Question 11. This question describes how to make a model that shows the number of drops in a space for each brand of paper towel. Students should choose the spot with the median area and trace the spot repeatedly to cover a sheet of copy paper. To compare absorbency it is important that the size of the paper is consistent. Sheets of blank copy paper are easiest to access and easiest to keep consistent.
As groups collect data and work on Question 11, check to make sure they are recording the number of drops on each paper, not the number of spots they see. This is also a good opportunity to observe students' strategies for finding the number of drops on each paper towel model. Students might use skip counting, repeated addition, or group the spots into multiplication facts they know. Identify one or two strategies to share with the rest of the class.
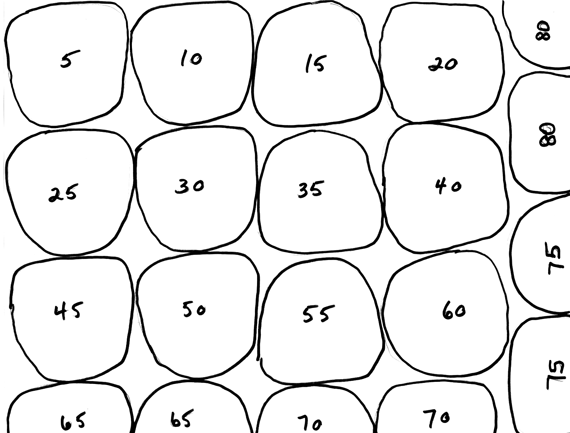
When students are tracing the spots they should try to fill the space to get a more reliable estimate. For example, notice how the student used the spot to trace partial spots in the model. See Figure 6. He or she traced one half of the spot and then the other to systematically cover the paper model. The student estimated the number of drops and decided that the paper towel would pick up about 80 drops.
In Question 12, students are asked to make a graph showing the number of drops for each paper towel. Using a display of the Centimeter Graph Paper, show students how to label, scale, and title their graph. Students' graphs will more than likely need to be scaled by five or ten to accommodate the data. Then ask students to graph their own data on the graph.
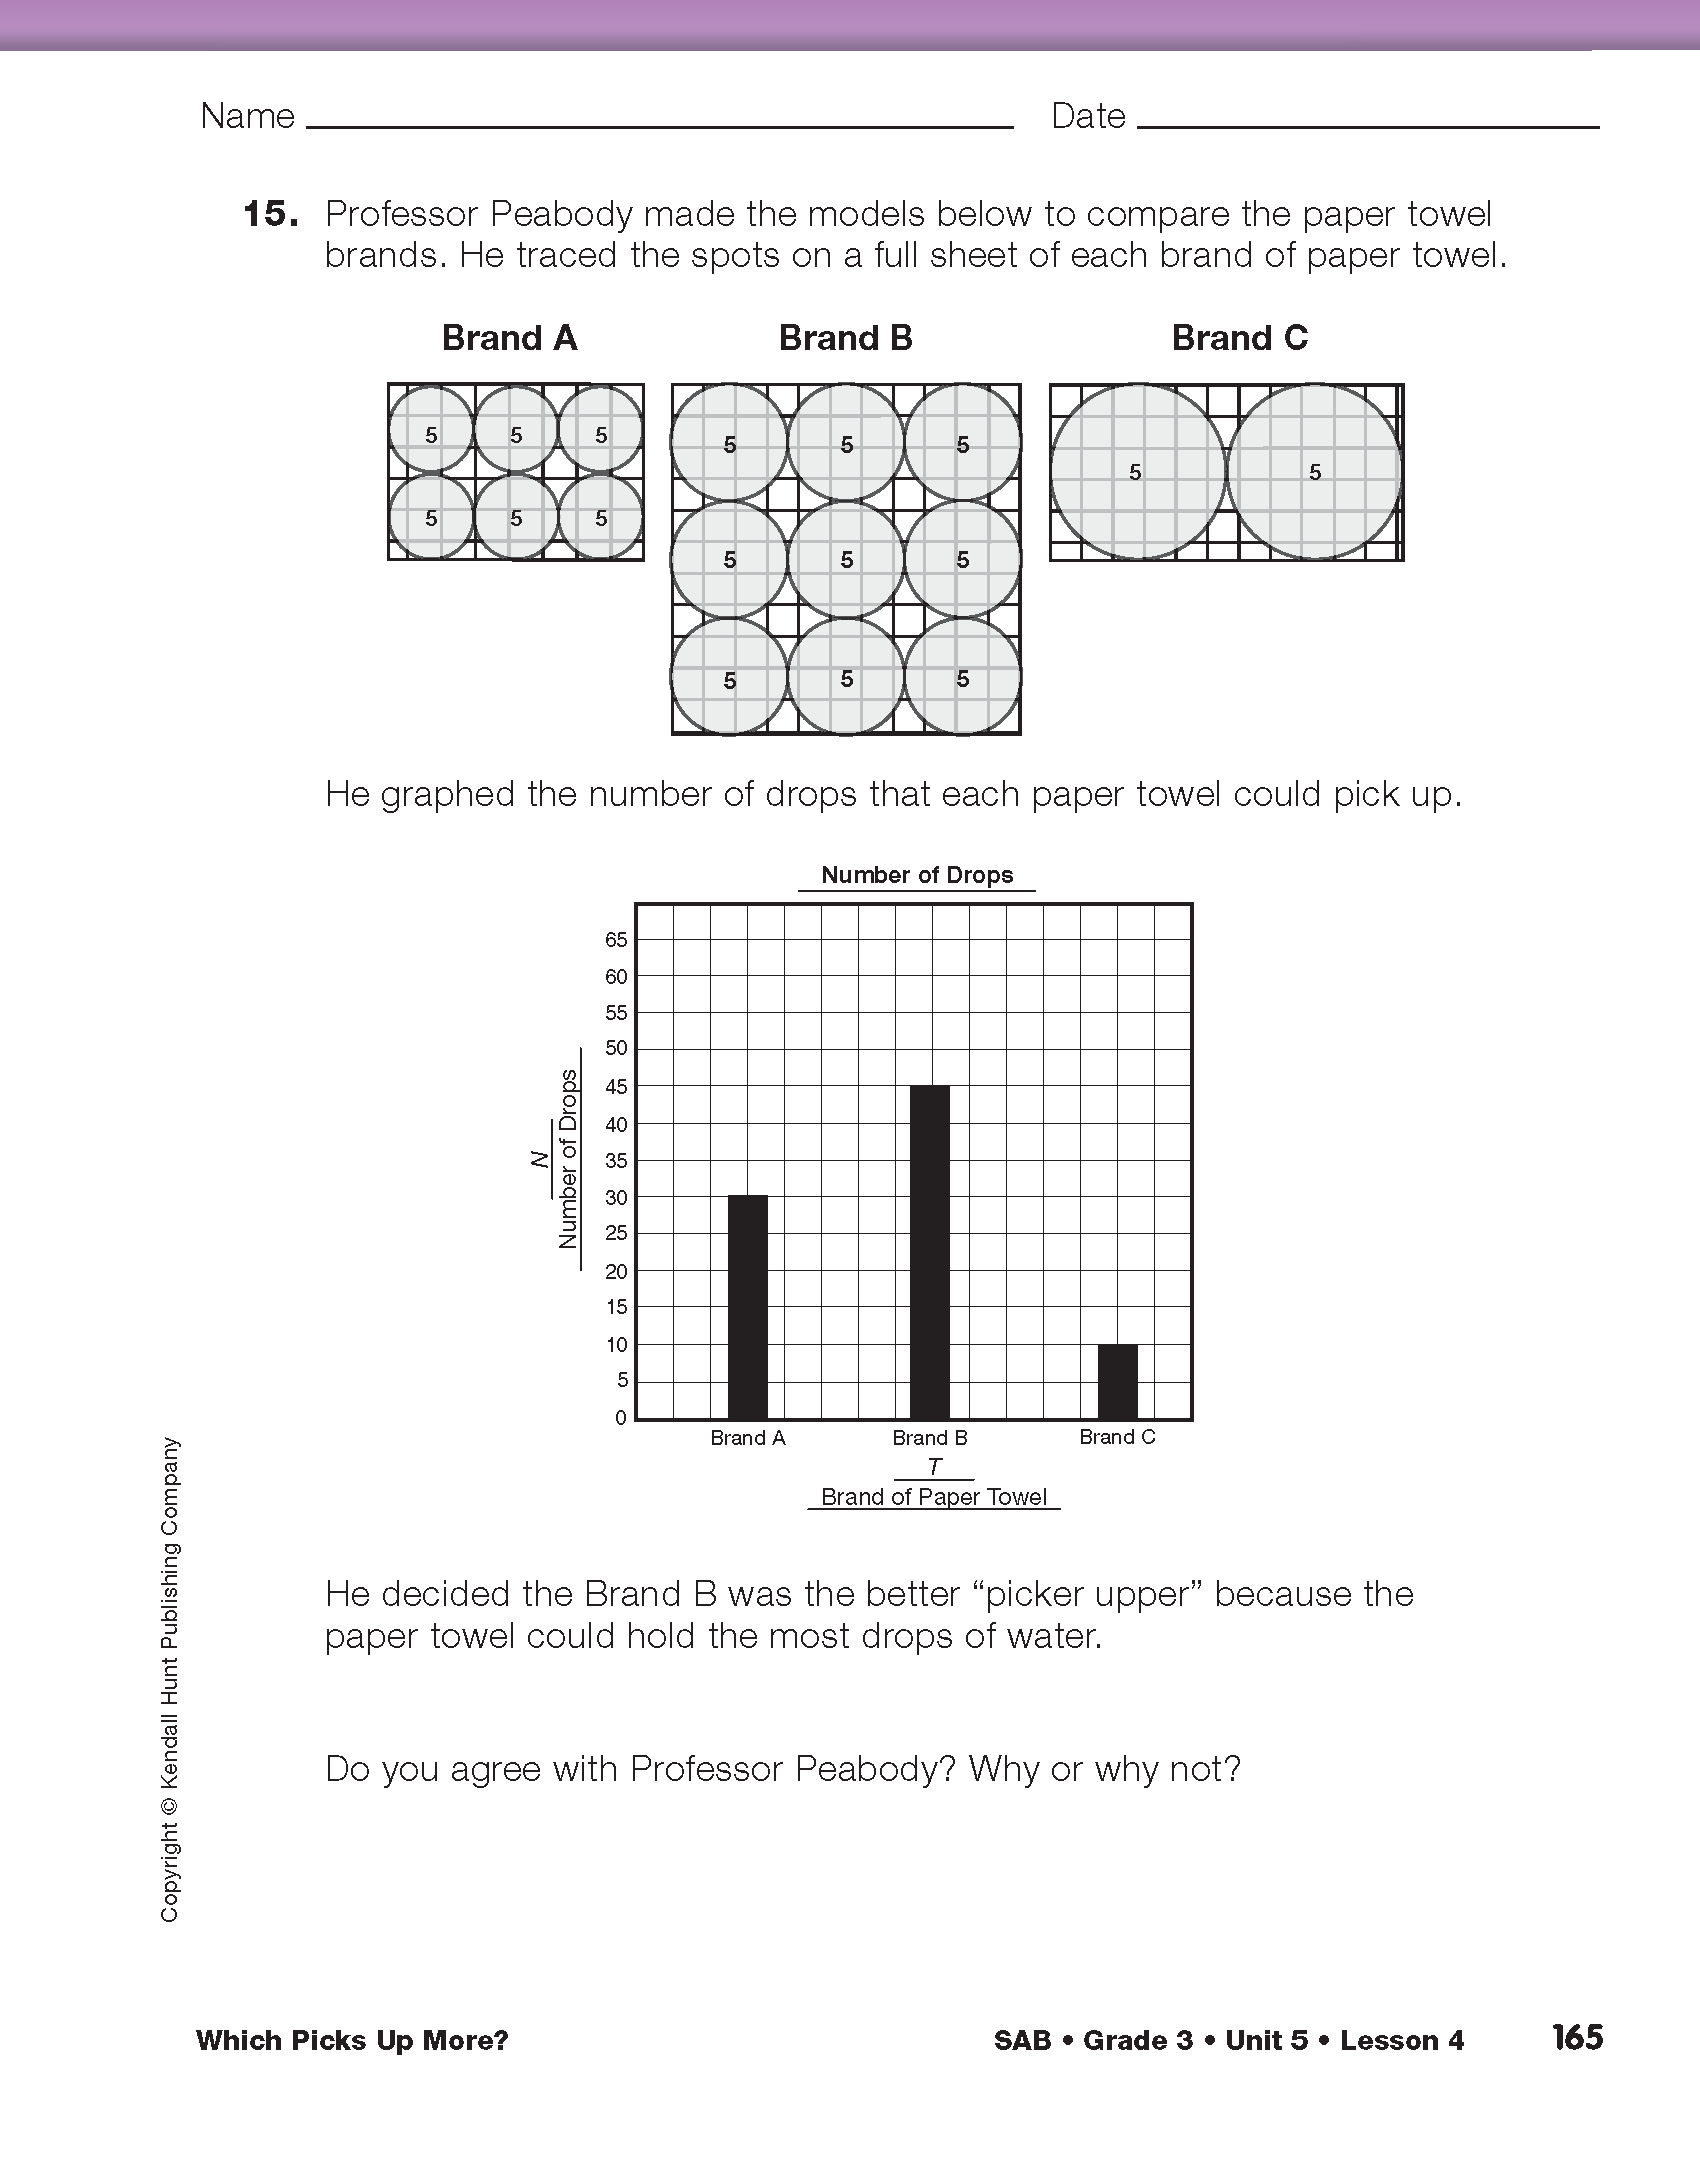
Use the Diagram and Graph to Make Predictions and Generalizations. Ask groups to discuss and answer Questions 13–15 in the Student Activity Book using the graph and diagrams they just made. After student groups have had a chance to discuss and respond, gather the class to discuss Question 15. Display Question 15 from the Student Activity Book.
- How many of you agree with Professor Peabody?
- How many of disagree with Professor Peabody?
- Compare your diagrams to Professor Peabody's. What is different about Professor Peabody's model? (His paper models are not the same size; ours are.)
- How might Professor Peabody be thinking about the better “picker upper”? (He might be looking at only the number of drops on each sheet of paper towel and not thinking about the size of the towel, or of its absorbency. Brand B seems to be more absorbent because it holds the greatest number of drops, but this sheet is larger than the others. The professor is not wrong because Brand B does hold the greatest number of drops in his experiment. However, Brand A's sheet is only half the size of Brand B's sheet. If the sheets for Brand A and B were the same size, Brand A might hold more water than Brand B.)
- Do you agree with Professor Peabody's definition of the better “picker upper”?