X. Using Line Plots 
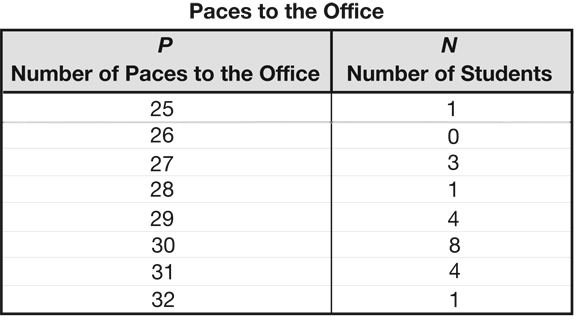
Mr. Moreno's class counted the number of paces it takes each student to walk from the classroom to the school office. Each time a student stepped on his or her right foot counted as one pace. They organized their results in a data table.

- Use the data in the data table to complete the line plot.

- What is the average number of paces from the classroom to the school office? How did you decide?
- Which student has the shorter pace: the student who traveled a distance of 25 paces or the student who traveled 32 paces? Explain how you decided.


