


Colors
Est. Class Sessions: 3–4Developing the Lesson
Part 3: Sharing Data
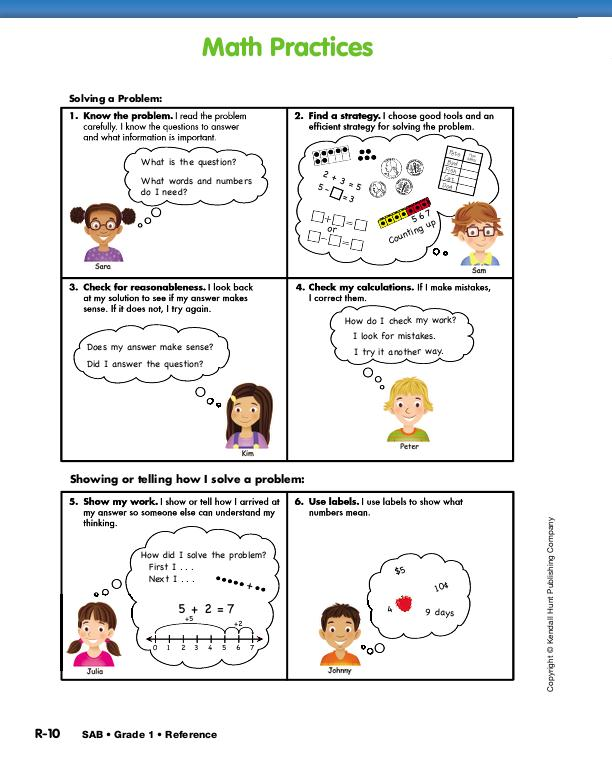
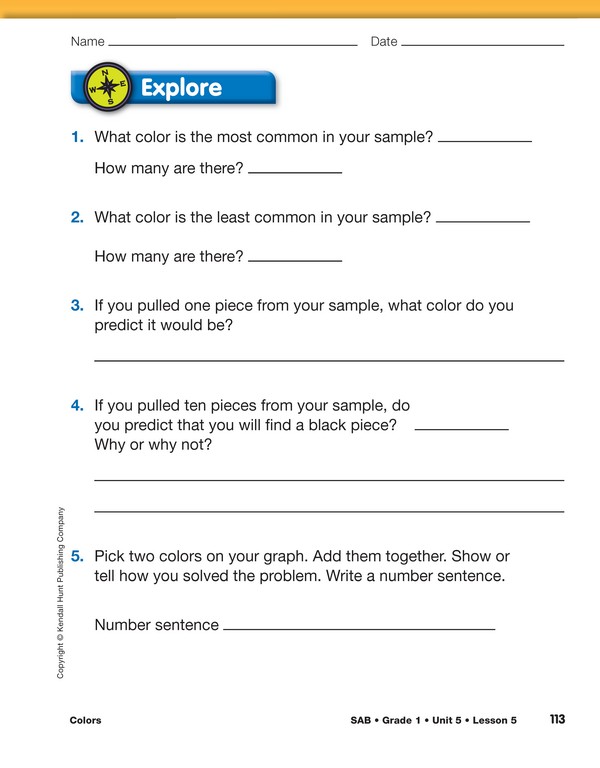
Analyze Data. In the fourth step of the TIMS Laboratory Method, students analyze and discuss their results. Display the Math Practices page from the Student Activity Book Reference section. Direct students’ attention to Math Practices Expectation 2, Find a strategy, and Math Practices Expectation 5, Show my work. Tell students that when answering Question 5, they will need to explain how they add two of the quantities displayed on their graphs. They can write their answers in words or show their strategies by drawing pictures. Assign Questions 1–5 in the Explore section of the Colors Lab pages to student pairs.
When all students have completed the questions in the Explore section, have them refer to their answers and their individual graphs.
Ask: