Lesson 5

Colors

Est. Class Sessions: 3–4

Summarizing the Lesson

Group and Count. Refer to the Colors in Our Class graph you assembled. Students will be impressed at the visual display of their work.

  • Without counting, how can you tell what the most common color is in our class? The least common color? How do you know? (The most common color has the tallest bar and the least common color has the shortest bar.)
  • Is that the same as the most common color in your own small sample? (Answers will vary.)
  • How can we find the totals for each color? (Responses may vary. Possible response: We can just count each colored space on each bar for each color.)
  • The bars show that there are a lot of pieces. Is that an efficient way to count all the colored spaces? Is there a more efficient way? (Responses will vary. Possible response: We can group the spaces by fives or tens and skip count.)
  • Why do you think this is a better way to count? (Answers will vary. Possible response: When I count a lot of numbers by ones, sometimes I get mixed up and forget where I am.)
  • How can you use the graph to find the total number of pieces in the whole class? (If you add the numbers that each bar represents, you will get the total number of pieces in the whole class.)
  • What tool can help you find or check the total? (a calculator)

Have students share grouping and counting strategies to find the totals for each of the colors, including using a calculator.

Making marks across the graph at the end of every ten spaces, or circling groups of spaces will make it easier to count on the class graph. See Figure 5 for an example of labeling the class graph to facilitate skip counting. As a class, find each color’s total. Post the totals for each color at the top of that color’s bar on the graph as shown in Figure 6.

Assign a student or students the task of finding the total number of pieces in the class’s samples. They can group and count using the bar graph or another tool, or add the totals with a calculator. Ask them to explain their strategies to the class.

Make Predictions.

  • What does “impossible” mean? (Possible responses: You can’t do it. It could never happen. For example, no matter how hard I try, it is impossible for me to fly.)
  • What does “certain” mean? (Possible responses: It is surely going to happen. It will happen no matter what. I can count on it happening.)
  • If I said that I pulled a [color not on bar graph] from the bowl of cereal, what would you say? Is that impossible or certain? Why? (It’s impossible. No matter how hard you try, you won’t be able to find this color. That color is not on the graph or in the box.)
  • If I said I think I will pull a [list all colors found on bar graph] piece from the bowl of cereal, what would you say? Why? (Possible response: That is certain. You will get one of those colors for sure.)
  • If I pulled one piece of cereal from the bowl, what color do you predict it will be? (the most common color)
  • If I wanted to make a prediction about what color would be the most common in all the boxes of this cereal at the store, do you think it would be better to look at one of our little samples or at the big sample of our whole class? Why? (The big sample; having more data and information helps us make a better prediction. See the Sample Dialog.)
  • What do you predict is the most common color in all the boxes? (the most common color in our class data)

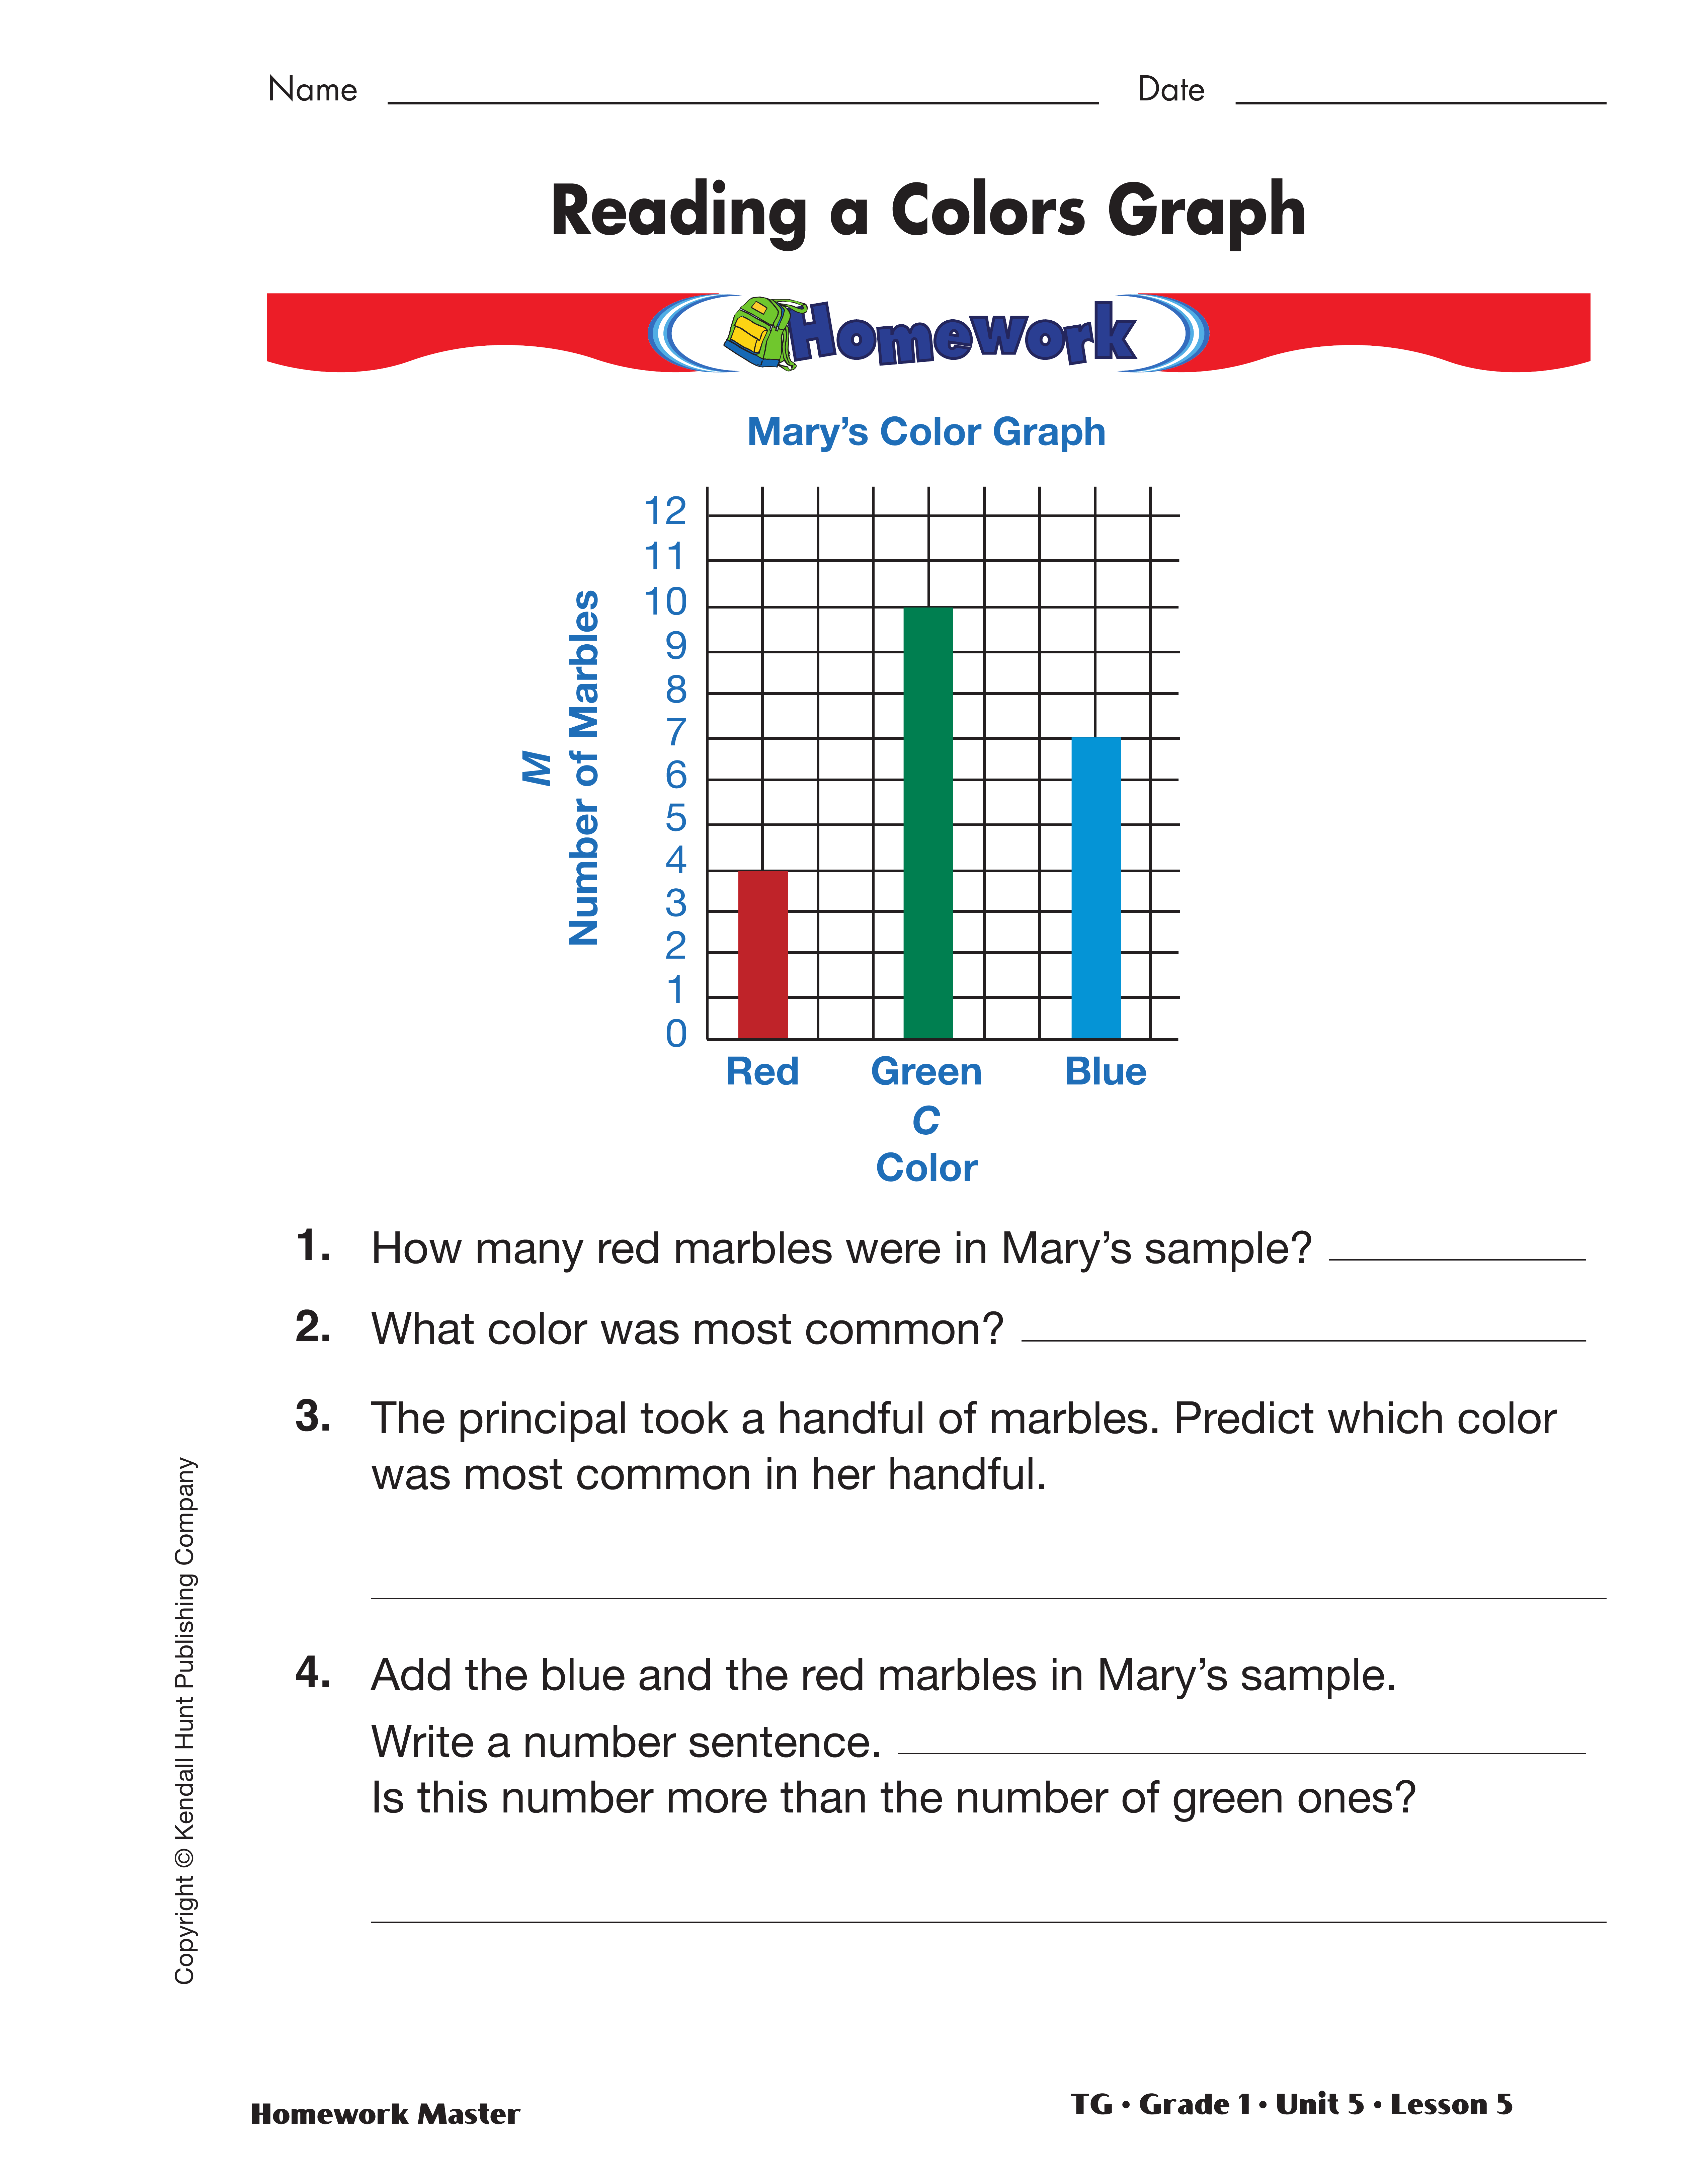
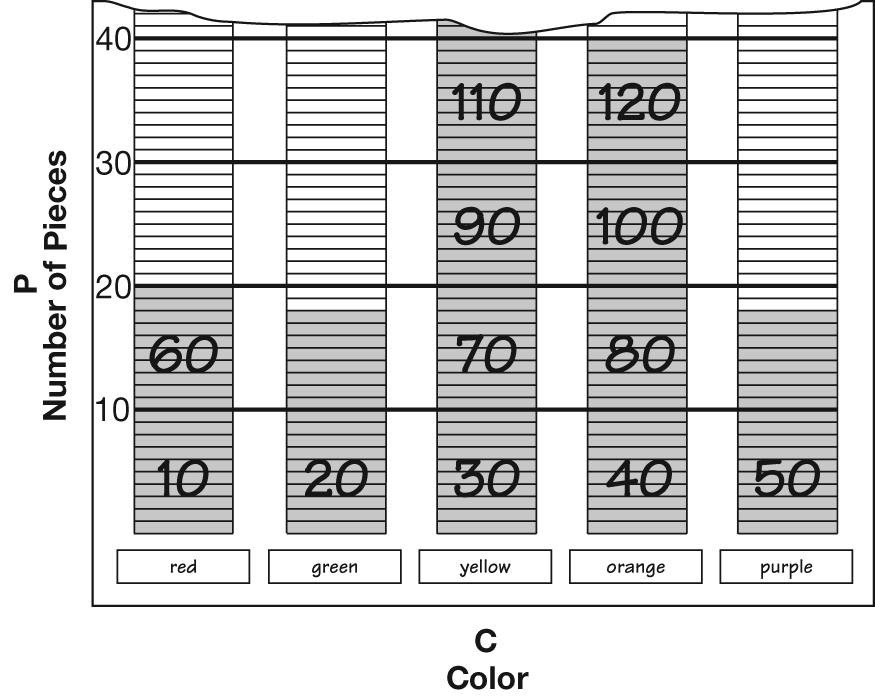
Use the Sample Dialog to lead a discussion analyzing and making predictions from the data represented in a graph or data table.

Teacher: If I wanted to make a prediction about what color would be most common in all the boxes of this cereal at the store, do you think it would be better to look at one of our little samples or at the big sample of our whole class?

Romesh: I think mine because I know it’s right.

Teacher: Does your sample look the same as your neighbor’s sample?

Romesh: No.

Teacher: So, if everyone’s sample is not the same how do we know whose sample is right?

Romesh: I guess we don’t know.

Ming: I think the big one.

Teacher: Why do you think it would be better to look at the bigger sample?

Ming: There’s more there so we know more.

Teacher: How does knowing more help?

Jerome: Knowing more helps us see more and that helps us.

Teacher: Does it help us to make a better prediction?

Jerome: Looking at my sample the most common is red. Looking at the class data, green is the most common. My sample is not right.

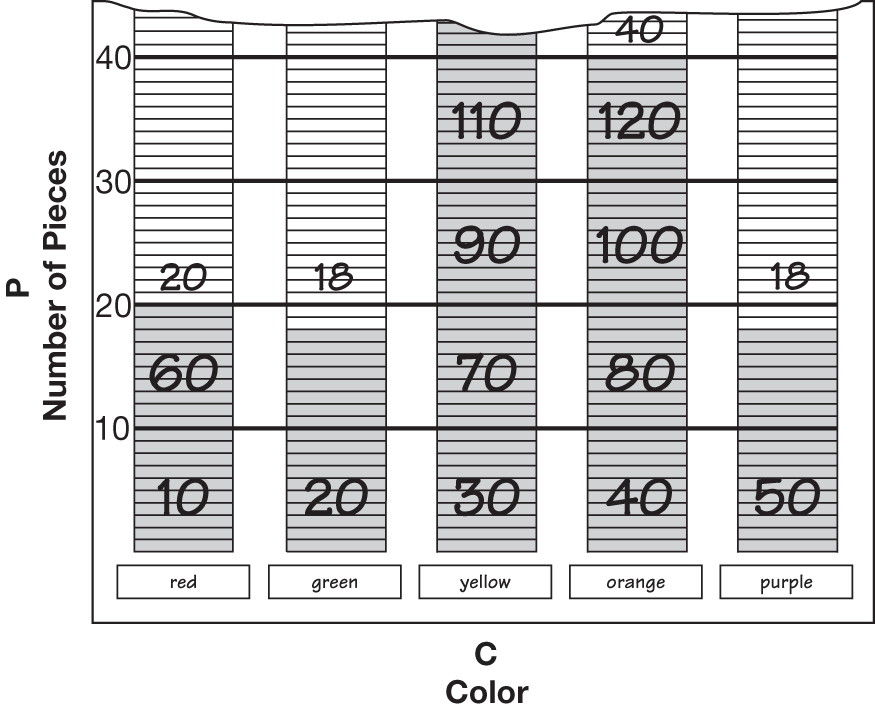
Teacher: Here's another question. What would you say if I told you that I reached into the cereal box and I got five brown pieces?

Tanya: You can't. There aren't any brown.

Teacher: Why do you say that?

Tanya: Because I looked. There's no brown.

Teacher: Tanya's right. If there aren't any brown pieces, then I can't pull out a brown. We say that this is impossible. What if I said that I'd give Grace a nickel if she could pick out a red, blue, green, yellow, or orange [name all the available colors] piece without looking into the box. She can pick out any one of those colors and still get the nickel. Is Grace going to get her nickel? Jacob: What if she picked a brown one? Would she get a nickel?

Grace: No. There's not any brown ones. How could I pick a brown one?

Teacher: Grace is right, Jacob. Remember, we just said there are no brown ones and so we say it is impossible to pick brown. But what happens if she picks a [list all the available colors]?

Grace: I think I get a nickel because what else could I pick?

Teacher: That's right, Grace. We say that it is certain that you will pick one of those colors because that's all the colors we have.

Assign the Reading a Colors Graph Homework Master.

X
SG_Mini
+
Grouping the color strips by tens to facilitate skip counting
X
+
Posting totals for each color on graph
X
+