


Colors
Est. Class Sessions: 3–4
Students investigate the color distribution in multicolored cereal while grouping and counting by fives and tens. This provides an introduction to sorting and sampling. The TIMS Laboratory Method, a four-step adaptation of the scientific method, is also introduced.
Content in this Lesson
- Connecting mathematics and real-world events: sampling a population and investigating colors in cereal.
- Grouping and counting objects by twos, fives, and tens [E1].
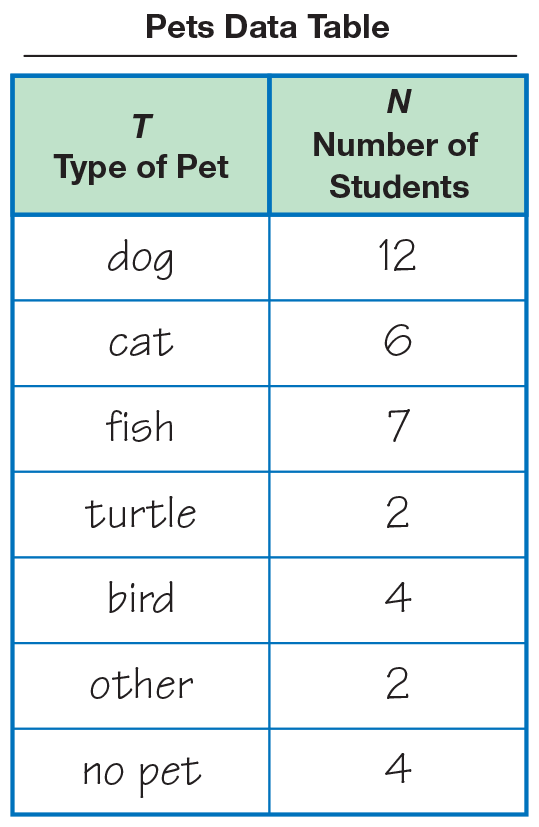
- Collecting and organizing information in a data table [E8].
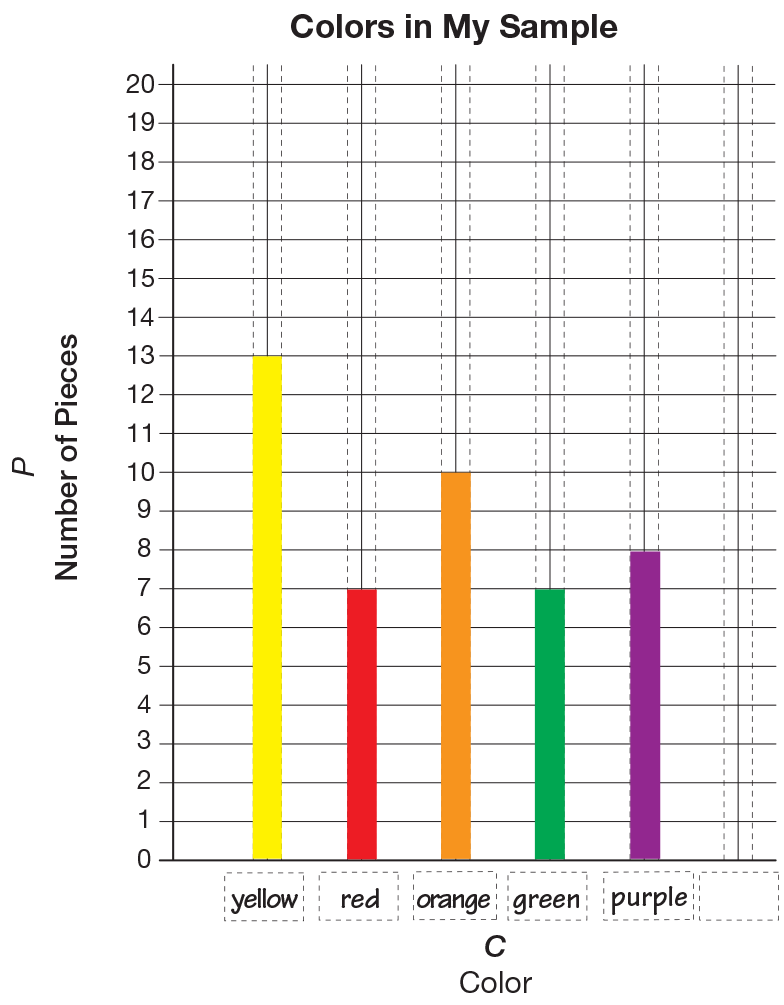
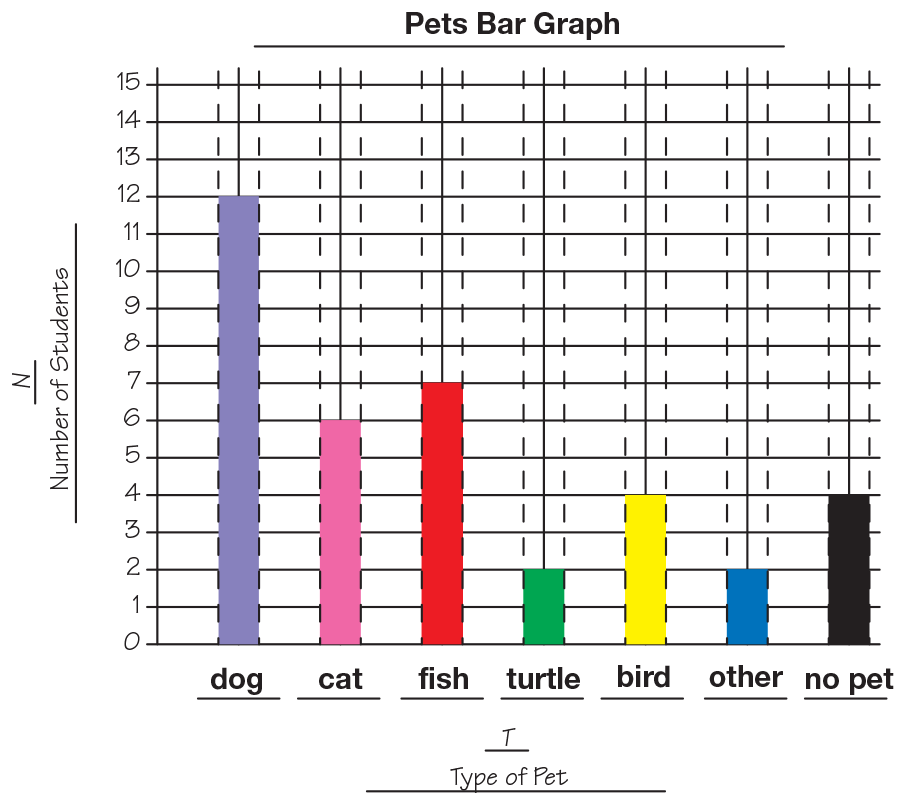
- Making a bar graph to find information about the colors in a sample [E9].
- Solving addition problems using data represented in a bar graph and a
table [E7]. - Reading a table or bar graph to find information about a data set [E10].
- Making predictions and generalizations about the colors in cereal using a data table and bar graph [E11].
- Connecting representations of quantities
(e.g., ten frames, data tables, graphs) [E5]. - Finding good strategies and tools to solve addition problems [MPE2].
- Communicating solution strategies [MPE5].
Daily Practice and Problems O–T

Materials for Students
| Daily Practice and Problems | Lesson | Homework | Assessment | ||
|---|---|---|---|---|---|
Student Books |
Student Activity Book |
|
|
||
Teacher Resources |
Teacher Guide - digital |
|
|
Supplies for Student Pairs
one ten-unit color strip for each color
desk number line (0–40)
connecting cubes
calculator
crayons or markers in colors that match the cereal pieces
scissors
tape
Materials for the Teacher
Display of Colors Lab Comic Master (Teacher Guide)
Display of data table and graph from Colors Lab (Student Activity Book) Pages 110‐111
Display of Math Practices (Student Activity Book) Reference
Unit 5 Assessment Record
Unit 5 Individual Assessment Record
class number line (0–130)
multicolored cereal such as Froot Loops®
large bowl
two-ounce or ¼-cup measuring cup
scissors
glue or tape
chart paper or butcher paper for class graph. See Materials Preparation.
Materials Preparation
Purchase Cereal and Gather Supplies. A box of multicolored cereal such as Froot Loops® is needed for the experiment. If using food for this lesson is not an option, substitute colored cubes or tiles. A mixture of five different colors is recommended. Make sure the colors are well mixed and that there are more of some colors than there are of others. Gather a large bowl to place the mixture in and a 2-ounce or ¼-cup measure with which to scoop the samples.
Cut Out Color Strips. Make copies of the Color Strips Master. Each student pair will need 1 copy of the page so that they have one ten-unit color strip per color of cereal and a couple of extras. Cut apart the strips prior to class. Make a few copies to accommodate mistakes.
Prepare a Class Graph. Prepare a large graph on pieces of chart paper or butcher paper as shown in Figure 1. In Part 2 of the lesson, students will attach color strips, creating bars for the graph. The bars can reach 6 feet in length, so leave enough room to accommodate them. Title the graph “Colors in Our Class.” Use a straightedge to draw a horizontal and a vertical axis. Label the vertical axis “Number of Pieces” but do not number the axis. You will number the vertical axis during the discussion. Label the horizontal axis “Colors.” Write the names of the colors across the bottom of the allocated space.
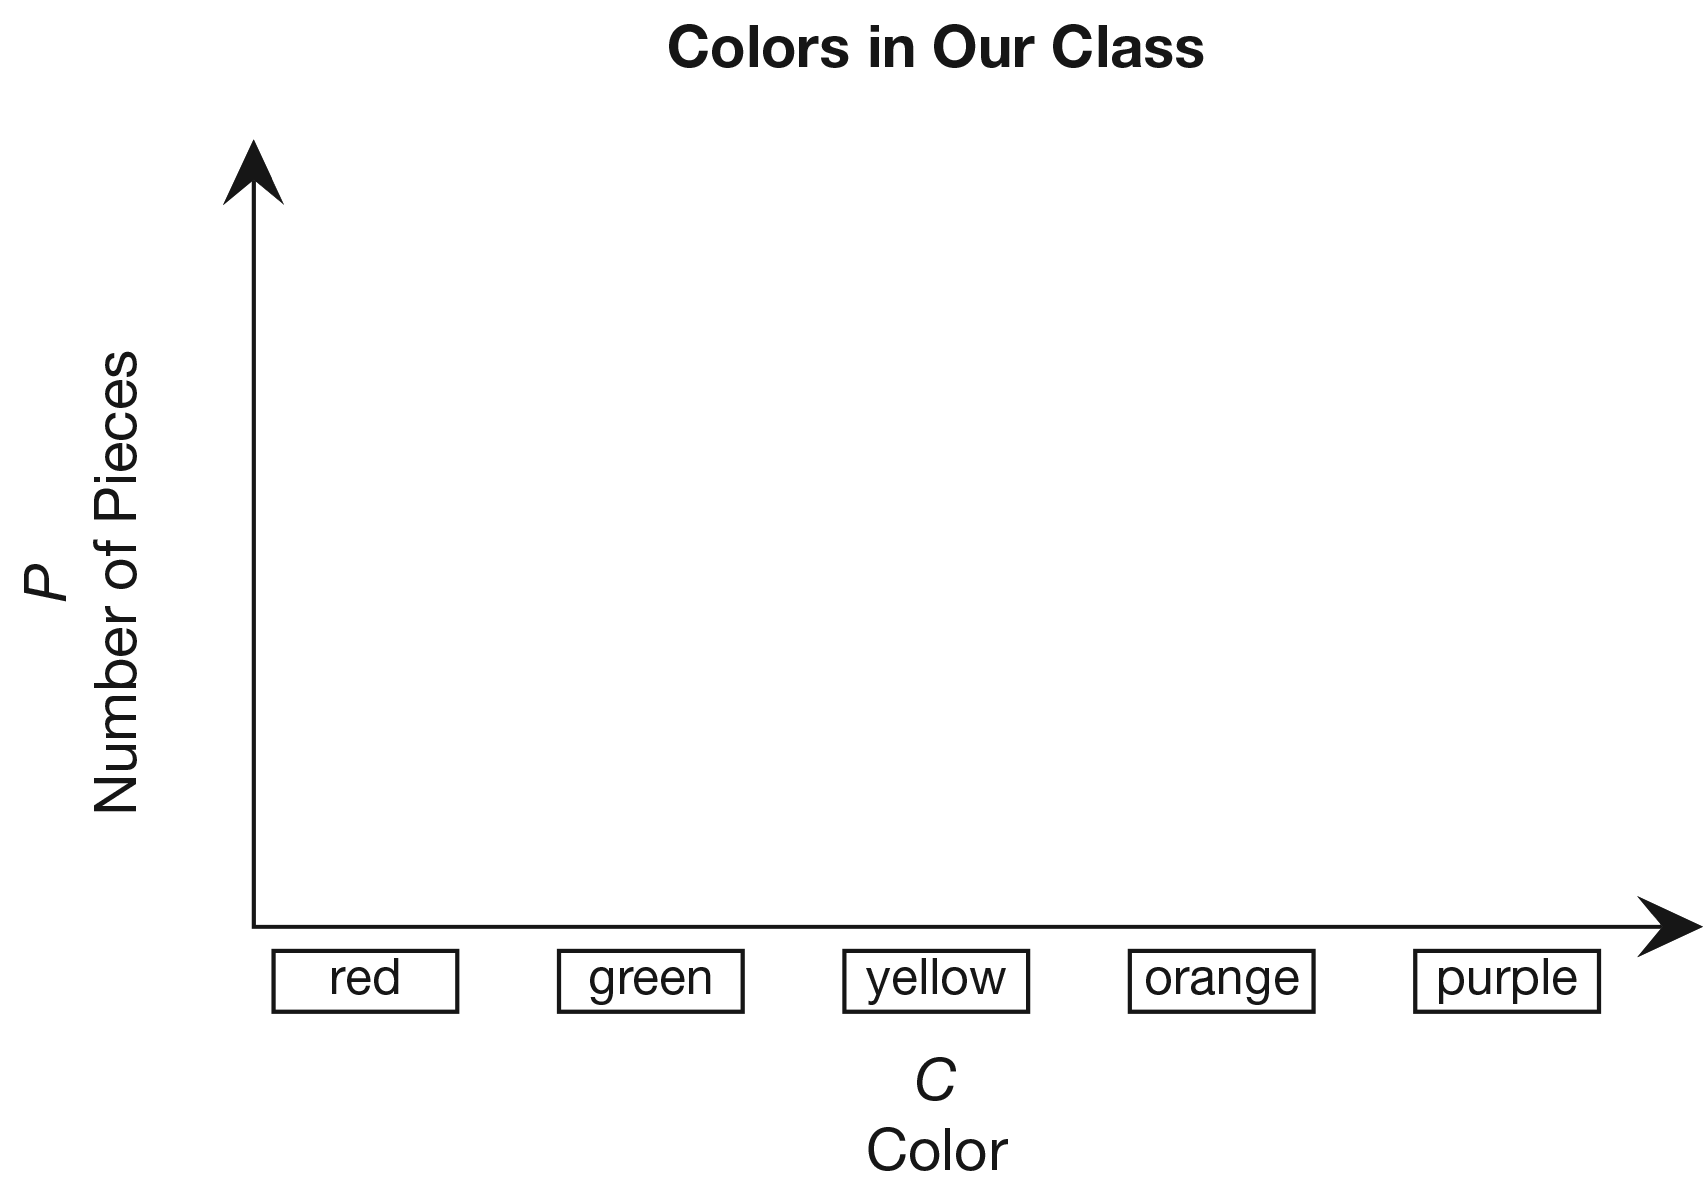
Figure 1: A sample prepared “Colors in Our Class” graph
Assessment in this Lesson
| ASSESSMENT | EXPECTATION ASSESSED | MATH PRACTICES EXPECTATION ASSESSED |
|---|---|---|
|
Colors Lab Data Table Student Activity Book Page 110 |
|
|
|
Colors Lab Bar Graph Student Activity Book Page 111 |
|
|
|
Colors Lab Questions 1–5 with Feedback Box Student Activity Book Pages 113–114 |
|
|
|
DPP Item O Sharing Stickers Teacher Guide - digital |
|
|
|
DPP Item R More of Grandma’s Cookies Teacher Guide - digital |
|
|
|
DPP Item T Spoonful of Cereal Teacher Guide - digital |
|