Make Predictions.
Begin by displaying the box of
cereal. Remind students that when we make a guess
about something ahead of time, before we know for
sure, we predict what will happen.
Ask questions such as the following:
- What colors do you predict the pieces are inside
this cereal box?
- Do you think each box has the same number of
each color?
- If something is “common,” is it special or unique?
(no)
- If something is “common,” would you be surprised
to see it? (I would not be surprised to see
it.)
- If something is “common,” are you more likely to
see it than something that is uncommon? (Yes,
you are more likely to see something that is common.)
- Think about the box of cereal. Make a prediction.
Which color is most common?
- How can we find out the answers to all these questions?
Fill a large bowl with cereal and let students examine
it visually. Continue the discussion.
- What colors do you see?
- Which color or colors do you predict will have
more pieces in the whole box?
- When we guess ahead of time what our answer
will be, we say that we “make a prediction.” How
can we find out if our prediction is true?
- Is this is an efficient method?

Concepts of Probability. In this lesson, students
experience their first encounter with the basic concepts of
probability. They take a sample of a population, analyze it,
and make a prediction for the whole population based on
their sample. They consider whether a future event is
impossible or certain. Sorting and counting the sample is
a fairly straightforward and concrete task. However, the
other concepts involve a deeper level of abstraction. These
abstractions motivate and create a context for students to
make sense of the numbers, identify patterns, and make
comparisons among the numbers.
The lab provides a real-life context for discussing these
ideas using concrete examples. Students predict the color
distribution of the entire box based on the color distribution
of their own small samples. (This assumes that the color
distribution is fairly uniform throughout all the cereal of this
brand.) If the range of colors in the cereal box is red, green,
blue, orange, or yellow, then an example of impossibility is
choosing a piece that is purple. An example of certainty is
choosing a piece that is one of the colors listed on the data
table. The important thing at this age is that students get
exposed to these terms. Keep all examples within the
context of the lab and as simple and uncluttered as
possible.
Making Predictions. One goal of this lesson is to
encourage students to begin to think about what kind of
data they need to know to make informed decisions. In
order to move students from making random guesses to
making decisions and predictions based on data, students
need to be presented with these types of problems and
questions even if their ability to choose good data is
limited. In this lesson, students predict which color cereal
they are most likely to draw from a larger “population”
based on data showing the most common color in a
sample.
Students may suggest counting the pieces of each color.
Agree that this would be a good way to find
the answer, but that it might not always be practical,
especially when there are many things to be counted.
- How could a person tell which color is the most
common if there were too many things to count?
Explain that when scientists and others encounter
this kind of a problem, they often count only some
of the items—a sample—and then use the information
to make predictions about all the items in the
whole group.
Tell students that they will use the same tools and
follow the same steps as scientists. In this investigation,
they will take samples of the cereal and use the
information to predict which colors are most common
and least common.
Demonstrate the Procedure. Discuss the steps of
the experiment with the students:
- take a sample of the cereal;
- count the total number in the sample;
- sort the sample by color;
- count the number of pieces of each color.
Demonstrate the first three steps of the procedure
with a small sample of cereal. Have a student volunteer
group the sample in small piles of two, five, or
ten to facilitate counting. Count aloud by twos, fives,
or tens as you determine the total number of pieces
in the sample. Avoid counting each piece separately
so that students see the merit and efficiency of
grouping and counting when there are many items to
count. Remind them that if you forget which number
you are on, you can go back and begin counting by 5
or 10, for example, instead of beginning at 1. Have a
volunteer sort the pieces by color. After sorting by
color, leave the piles intact and tell students that you
will count the number of pieces in each color group
a little later.
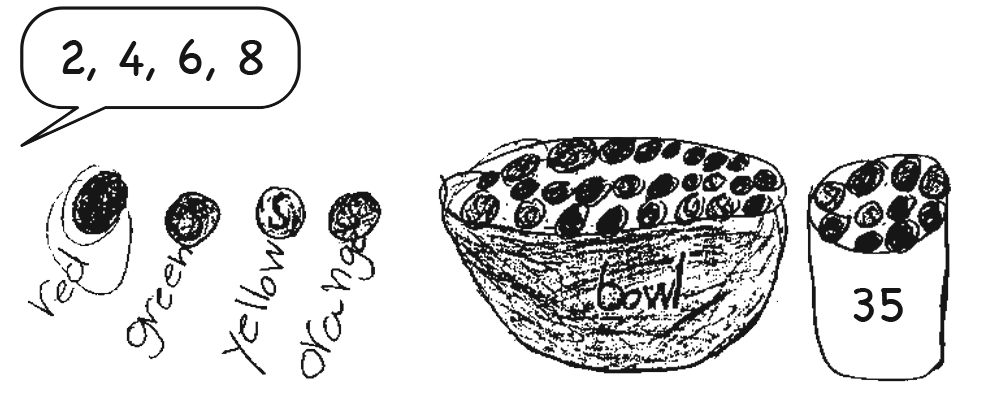
Draw a Picture. This is the first step in the TIMS
Laboratory Method. Tell students that they are going
to draw a picture that shows all of the important elements
in the lab that you just demonstrated. See
Figure 2 and the Content Note.
- What are some important things to include in your
picture? (a bowl of cereal with multicolored
pieces, a cup with a sample of the cereal, piles of
the cereal sorted by color, counting)
Pictures are to be drawn individually, even though
the data collection is done in pairs. Ask students to
draw their pictures in the Draw section of the Colors
Lab pages.
Picture. The picture allows students to plan and organize the
procedure used in the lab and provides a way for them to
communicate this procedure. It can also provide you with some
insight into students’ understanding. To assess their
understanding of the lab, look for each of these important
elements in the picture:
- each cereal color
- sampling the cereal
- sorting and counting the cereal
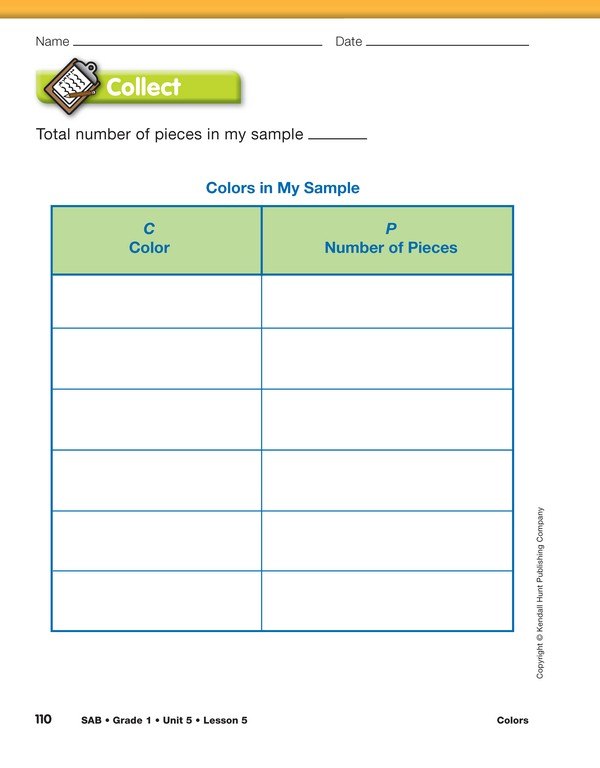
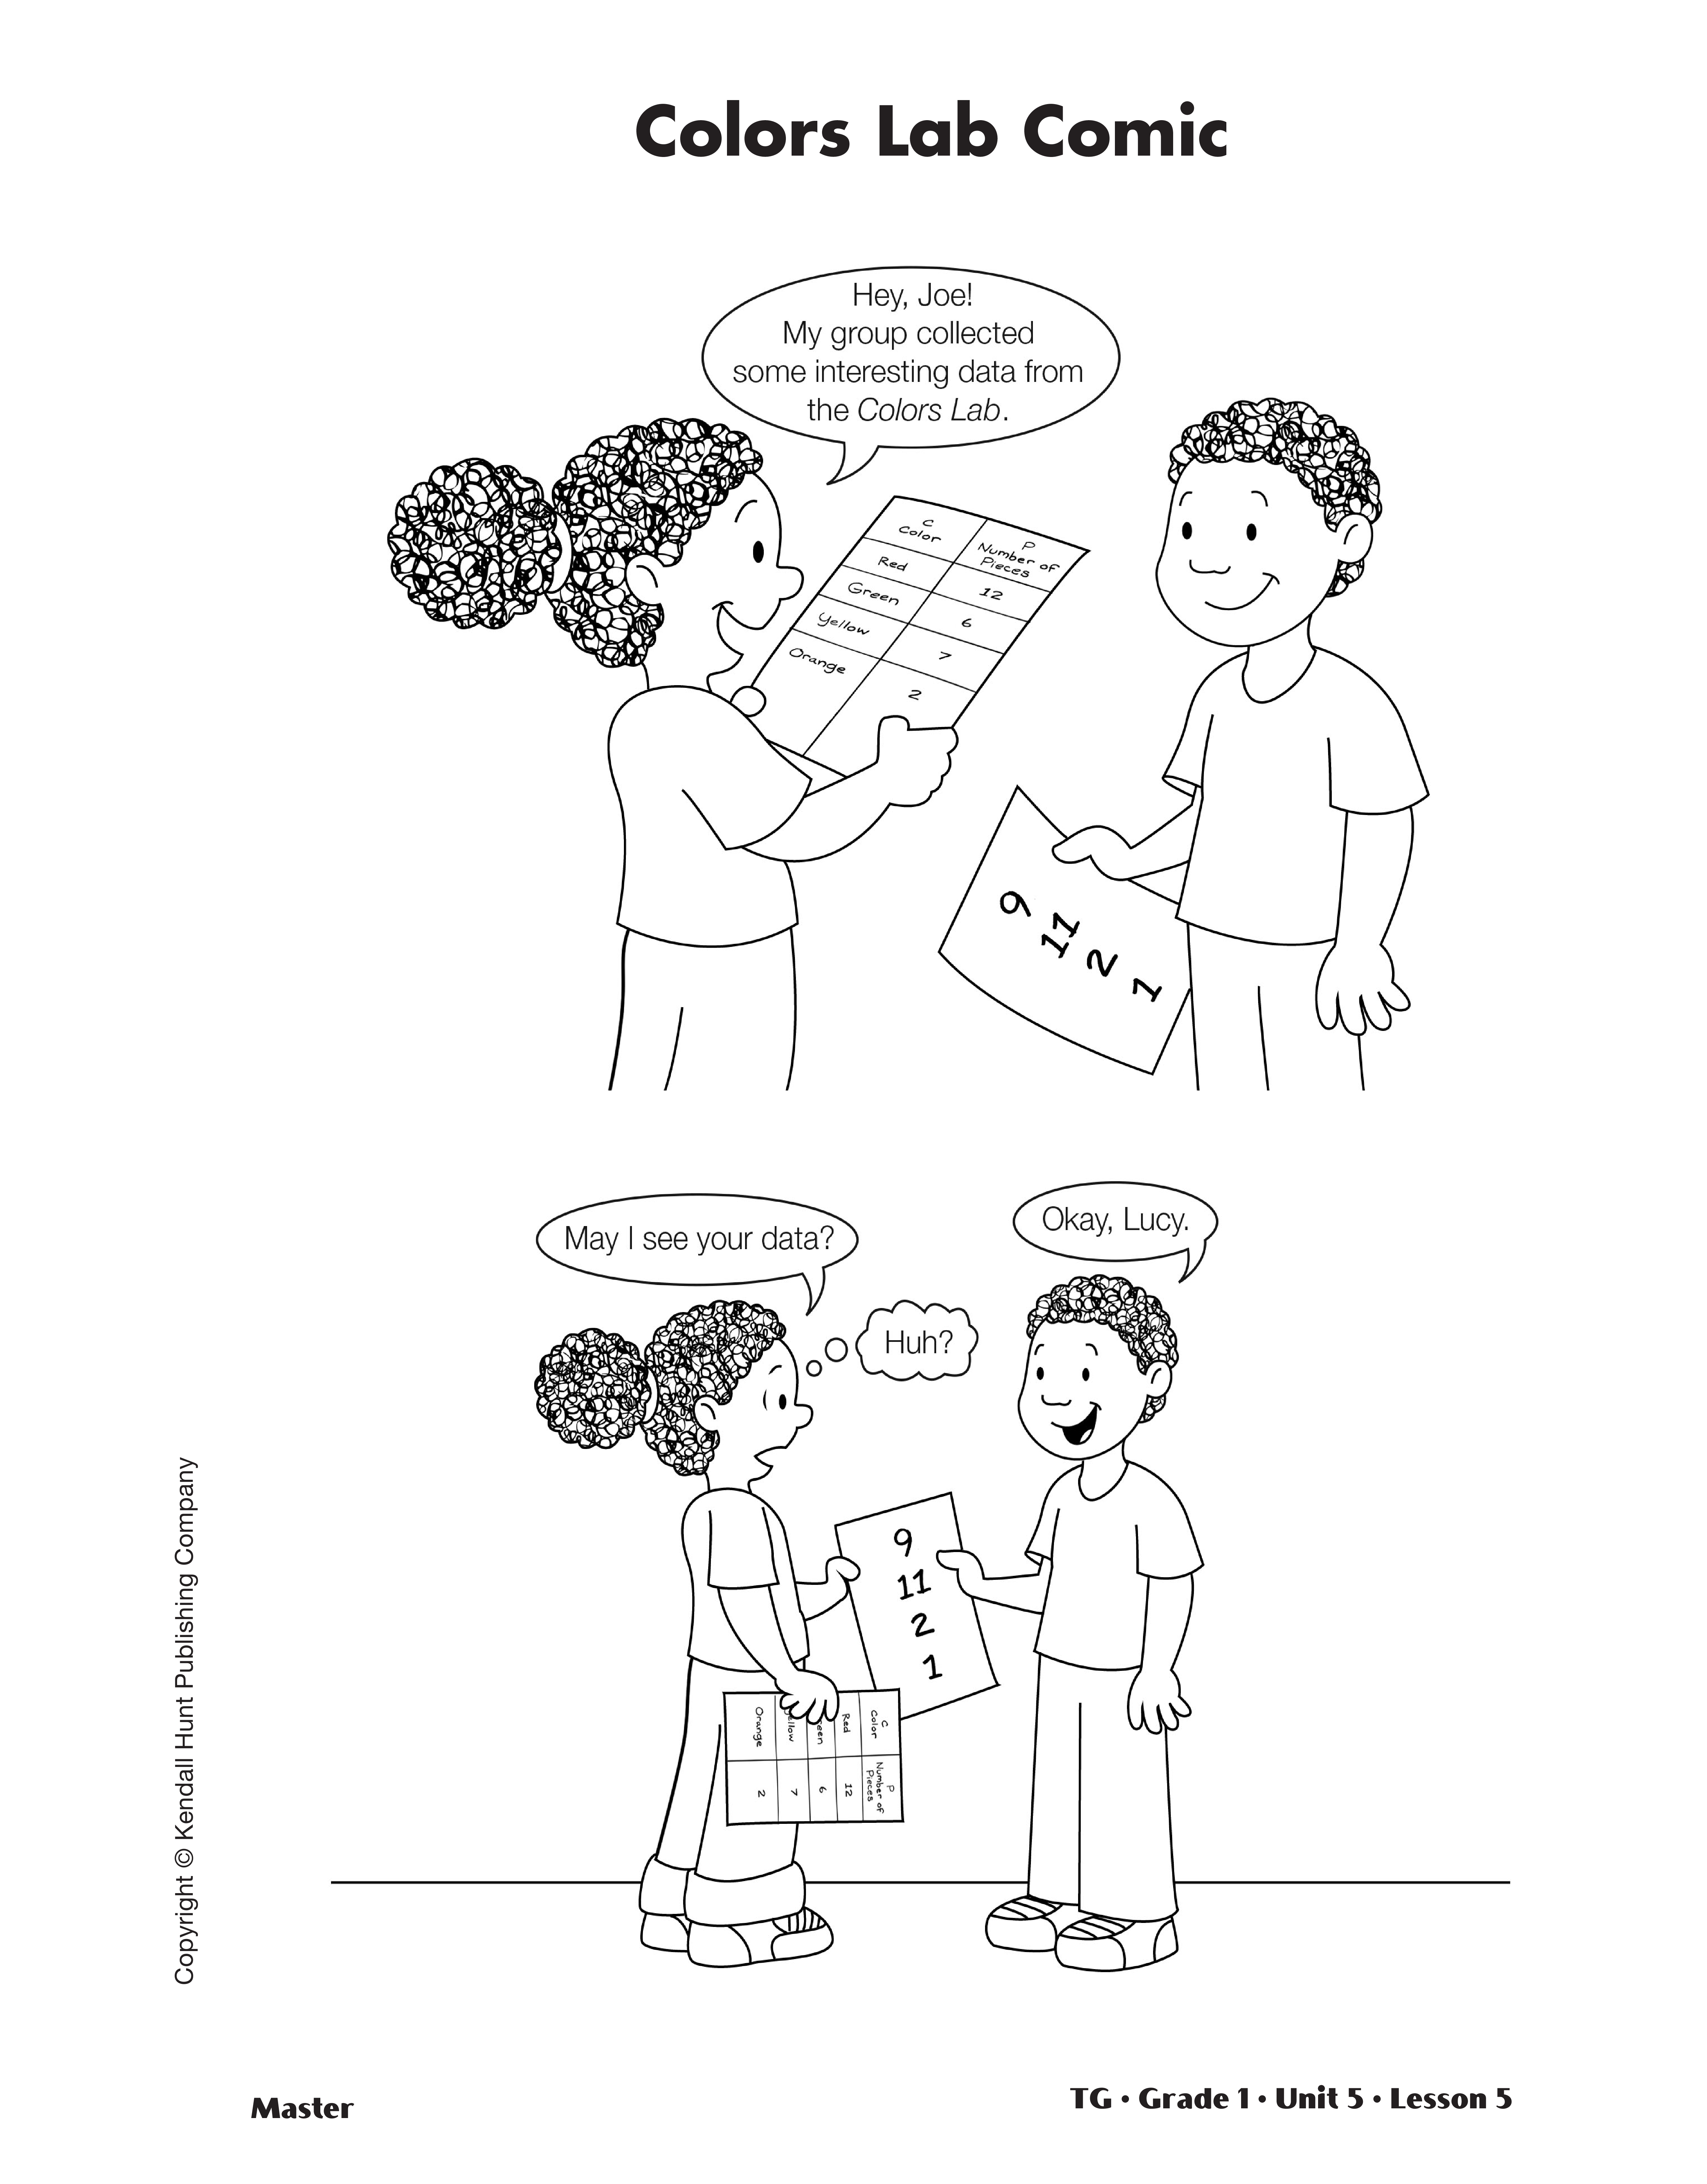
Record Sample Data. The second step in the TIMS
Laboratory Method is to collect data and organize it
into a data table. Display the Colors Lab Comic
Master. The children in the picture have just finished
sorting and counting their cereal samples. Lucy has
organized her data in a table, but Joe has not. It
stresses the importance of using a data table as a tool
to clearly organize data. Read the cartoon aloud to
the students, or ask student volunteers to do so.
- What is happening in this cartoon? (Lucy has
recorded her data in a data table. Joe has only
made a list of unlabeled numbers. Lucy doesn’t
know what Joe’s numbers mean.)
- Is Joe able to clearly explain or show the work that
he has done to Lucy? Why or why not? (Probably
not; he may forget what the numbers mean.)
- Can you think of a tool that could help him organize
his data? (a data table with labels)
Display and direct students’ attention to the data
table on the Collect section of the Colors Lab pages.
Tell students that data tables help us organize information
and data. Show students the sample used earlier
for demonstration.
- Even before you sort and count the pieces, what
do you know about what is in this sample? (We
know there are different colors of cereal in the
cup.)
Record the total number of pieces in the sample in
the blank above the data table. Ask students to identify
all the colors in the cereal.
Using the display, fill
in the names of the colors in the “Color” column of
the table as students fill in their own.
- After scooping, sorting, and counting the number
in each pile, what kind of information are you
going to have? What are you going to find out?
(the number of yellow, green, orange, etc., pieces
of cereal in the sample)
Have volunteers help you count the number of
pieces in each color group. Depending on the number
of pieces in each pile, ask a volunteer to count a
group by twos, fives, or tens.
- Can someone show another way to count the
pieces in this pile? (Students may count all the
pieces, or group and count the pieces by fives or
tens. Some students may use a ten frame.)
Have student volunteers show how to record the
number of pieces counted for each color on the data
table. Remind students that they can find numbers to
40 on their desk number lines, and numbers to 130
on the classroom number line.
Interpret Sample Data Table. When the data table
is complete, have students read the data table for
information and use it to solve addition problems.
Ask questions similar to the following:
- Of which color do I have the most?
- Of which color do I have the least?
- How many [orange] pieces do I have?
- How many [yellow] and [red] pieces do I have together? How did you find out?
- Do I have more [blue] or more [red]?
- If we hadn’t counted the pieces, is there another
way to find the total number of pieces in my sample?
(Add all the recorded numbers on the data
table together.)